
Nutrition Percentage of secondary schools that did not
- Slides: 18
Nutrition
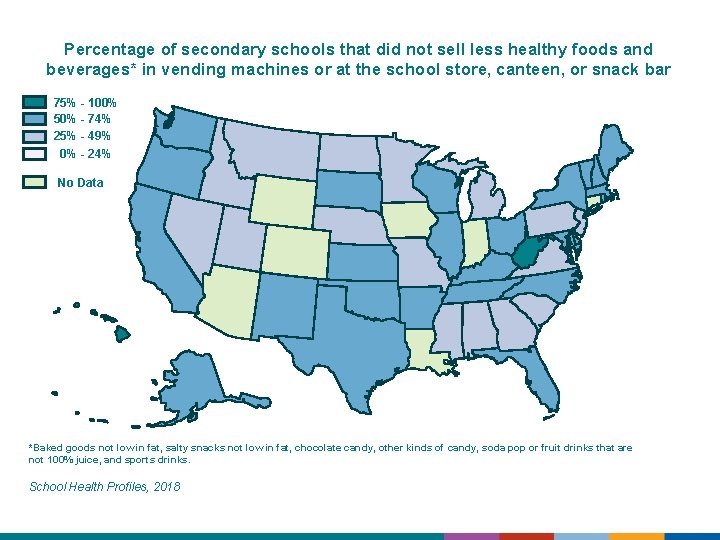
Percentage of secondary schools that did not sell less healthy foods and beverages* in vending machines or at the school store, canteen, or snack bar 75% - 100% 50% - 74% 25% - 49% 0% - 24% No Data *Baked goods not low in fat, salty snacks not low in fat, chocolate candy, other kinds of candy, soda pop or fruit drinks that are not 100% juice, and sports drinks. School Health Profiles, 2018
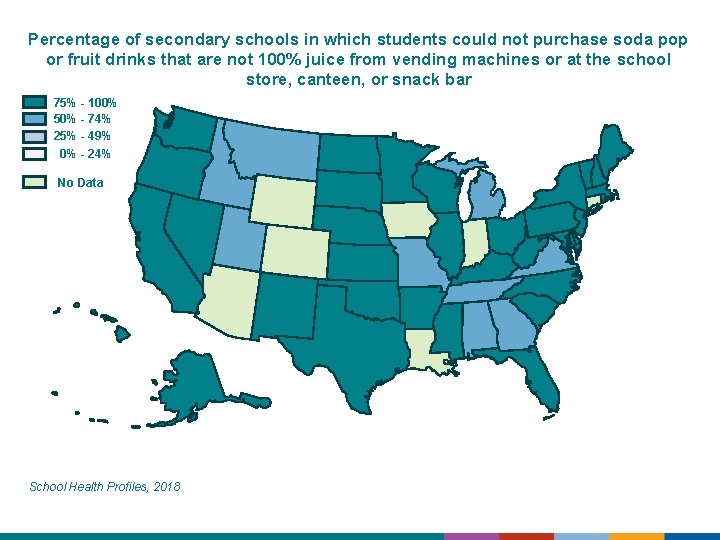
Percentage of secondary schools in which students could not purchase soda pop or fruit drinks that are not 100% juice from vending machines or at the school store, canteen, or snack bar 75% - 100% 50% - 74% 25% - 49% 0% - 24% No Data School Health Profiles, 2018
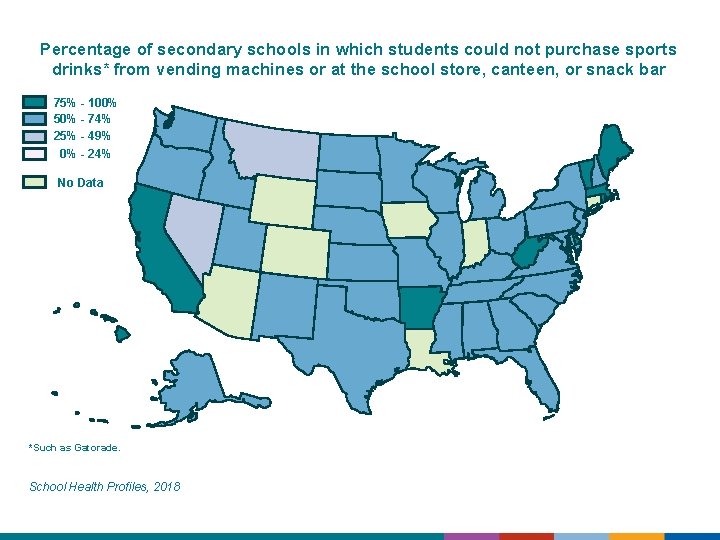
Percentage of secondary schools in which students could not purchase sports drinks* from vending machines or at the school store, canteen, or snack bar 75% - 100% 50% - 74% 25% - 49% 0% - 24% No Data *Such as Gatorade. School Health Profiles, 2018
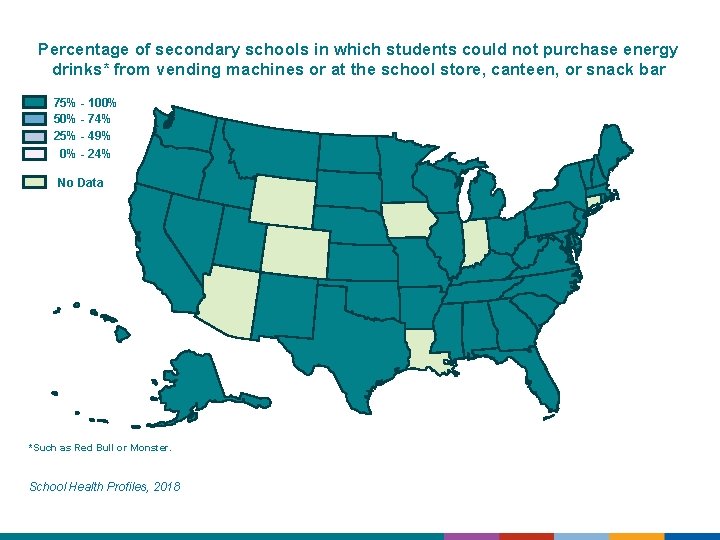
Percentage of secondary schools in which students could not purchase energy drinks* from vending machines or at the school store, canteen, or snack bar 75% - 100% 50% - 74% 25% - 49% 0% - 24% No Data *Such as Red Bull or Monster. School Health Profiles, 2018
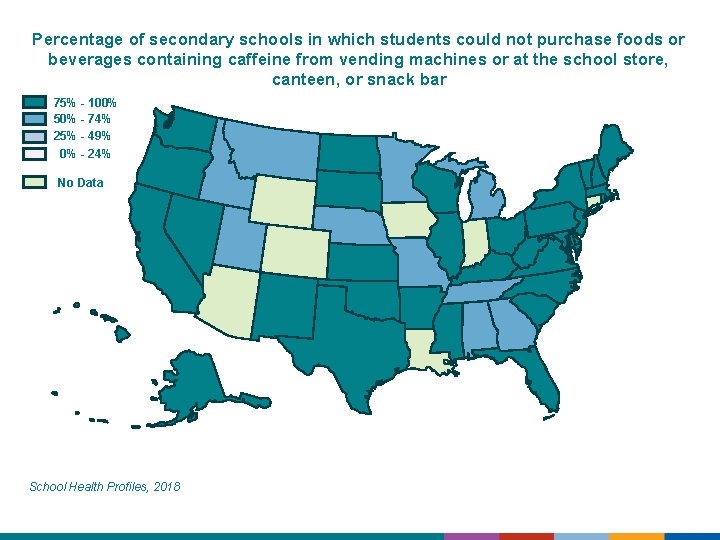
Percentage of secondary schools in which students could not purchase foods or beverages containing caffeine from vending machines or at the school store, canteen, or snack bar 75% - 100% 50% - 74% 25% - 49% 0% - 24% No Data School Health Profiles, 2018
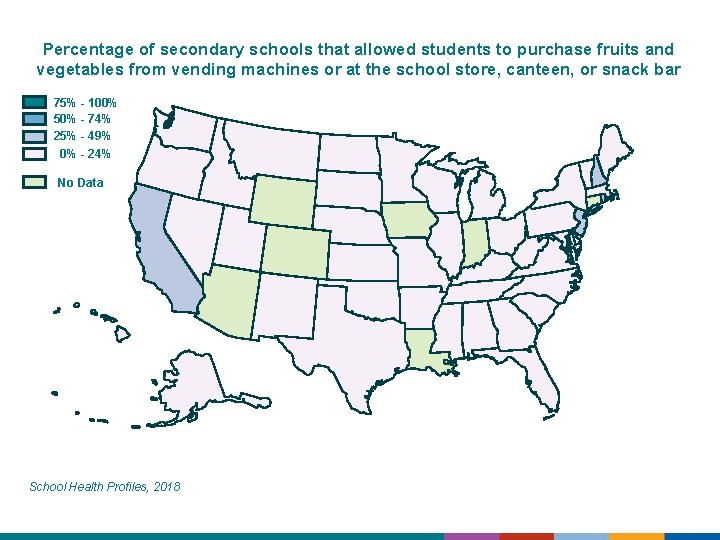
Percentage of secondary schools that allowed students to purchase fruits and vegetables from vending machines or at the school store, canteen, or snack bar 75% - 100% 50% - 74% 25% - 49% 0% - 24% No Data School Health Profiles, 2018
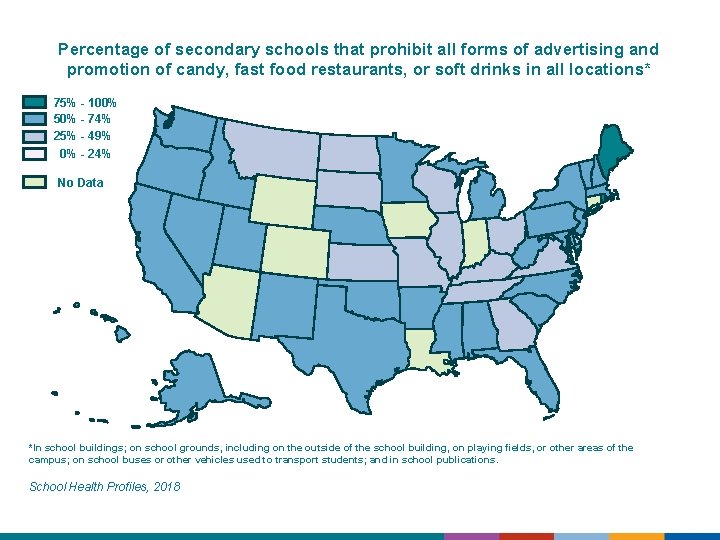
Percentage of secondary schools that prohibit all forms of advertising and promotion of candy, fast food restaurants, or soft drinks in all locations* 75% - 100% 50% - 74% 25% - 49% 0% - 24% No Data *In school buildings; on school grounds, including on the outside of the school building, on playing fields, or other areas of the campus; on school buses or other vehicles used to transport students; and in school publications. School Health Profiles, 2018
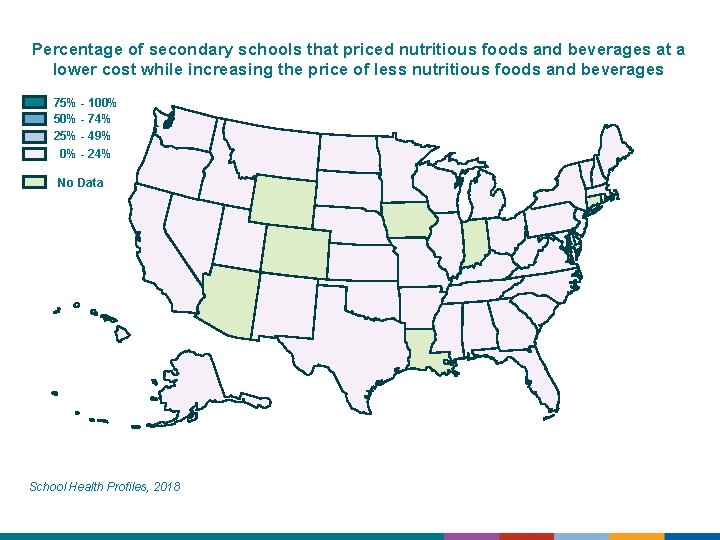
Percentage of secondary schools that priced nutritious foods and beverages at a lower cost while increasing the price of less nutritious foods and beverages 75% - 100% 50% - 74% 25% - 49% 0% - 24% No Data School Health Profiles, 2018
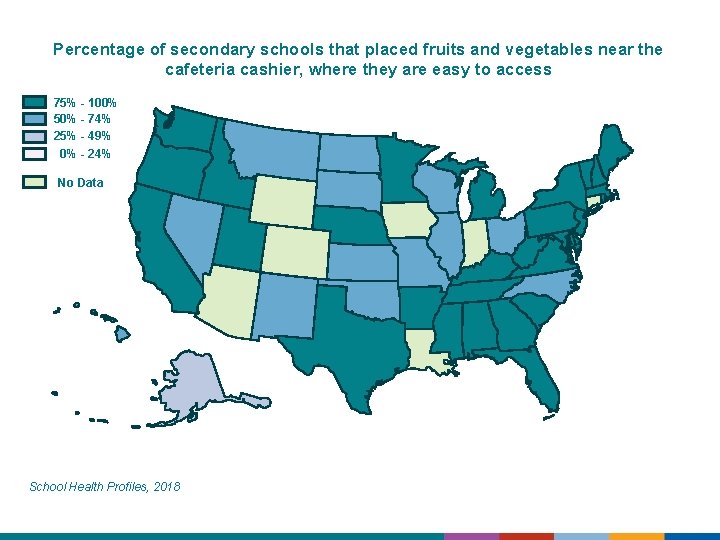
Percentage of secondary schools that placed fruits and vegetables near the cafeteria cashier, where they are easy to access 75% - 100% 50% - 74% 25% - 49% 0% - 24% No Data School Health Profiles, 2018
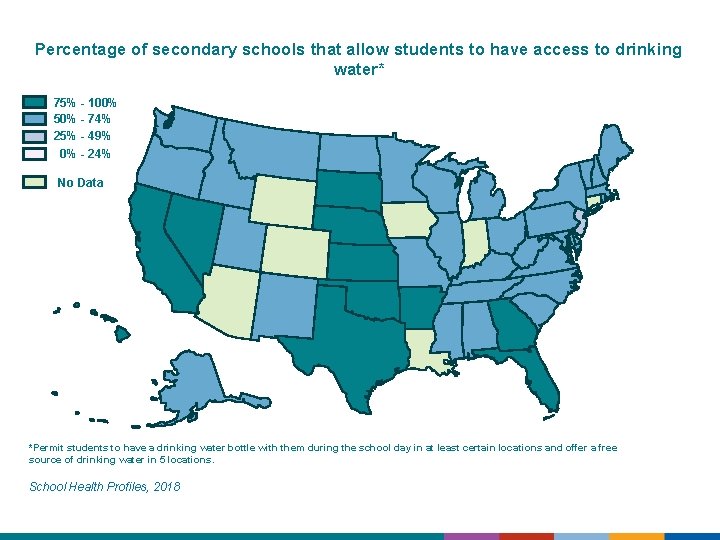
Percentage of secondary schools that allow students to have access to drinking water* 75% - 100% 50% - 74% 25% - 49% 0% - 24% No Data *Permit students to have a drinking water bottle with them during the school day in at least certain locations and offer a free source of drinking water in 5 locations. School Health Profiles, 2018
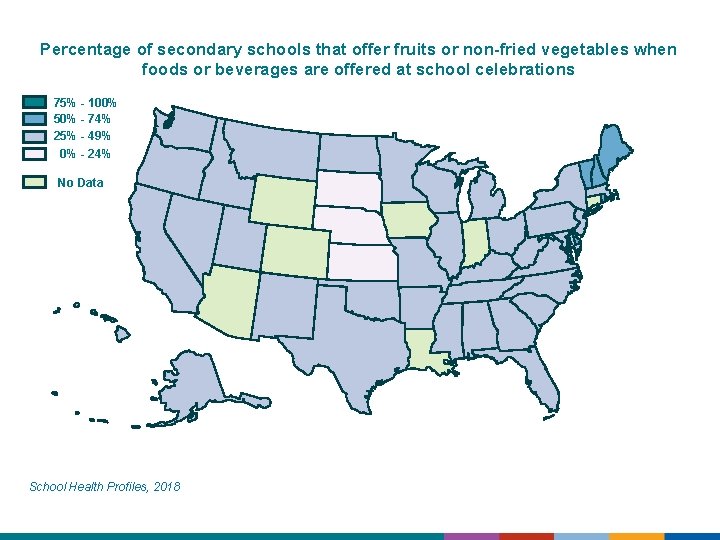
Percentage of secondary schools that offer fruits or non-fried vegetables when foods or beverages are offered at school celebrations 75% - 100% 50% - 74% 25% - 49% 0% - 24% No Data School Health Profiles, 2018
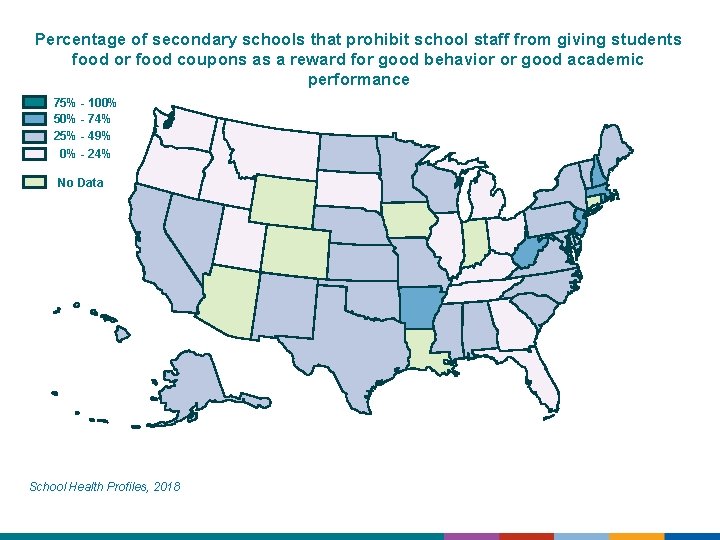
Percentage of secondary schools that prohibit school staff from giving students food or food coupons as a reward for good behavior or good academic performance 75% - 100% 50% - 74% 25% - 49% 0% - 24% No Data School Health Profiles, 2018
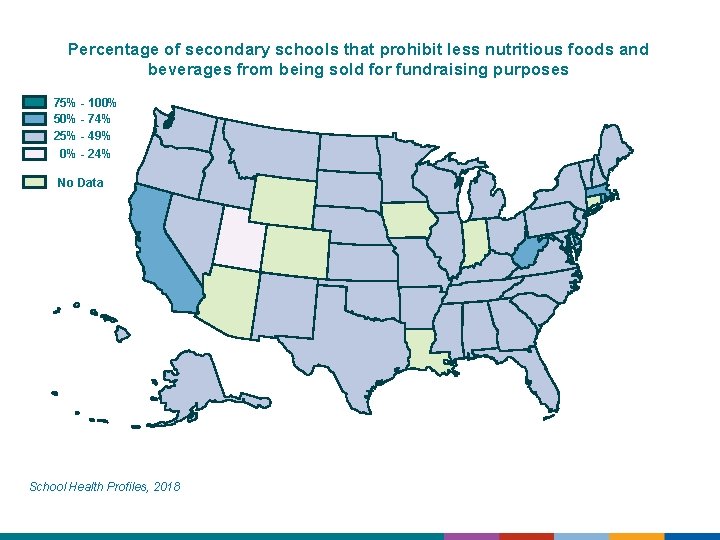
Percentage of secondary schools that prohibit less nutritious foods and beverages from being sold for fundraising purposes 75% - 100% 50% - 74% 25% - 49% 0% - 24% No Data School Health Profiles, 2018
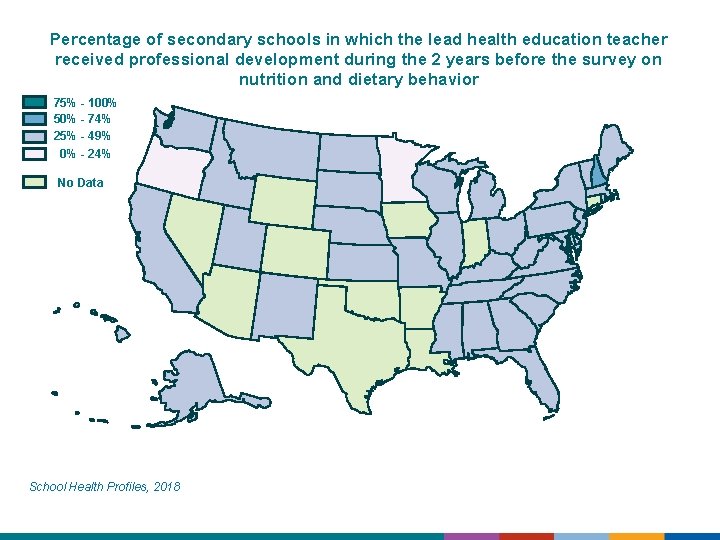
Percentage of secondary schools in which the lead health education teacher received professional development during the 2 years before the survey on nutrition and dietary behavior 75% - 100% 50% - 74% 25% - 49% 0% - 24% No Data School Health Profiles, 2018
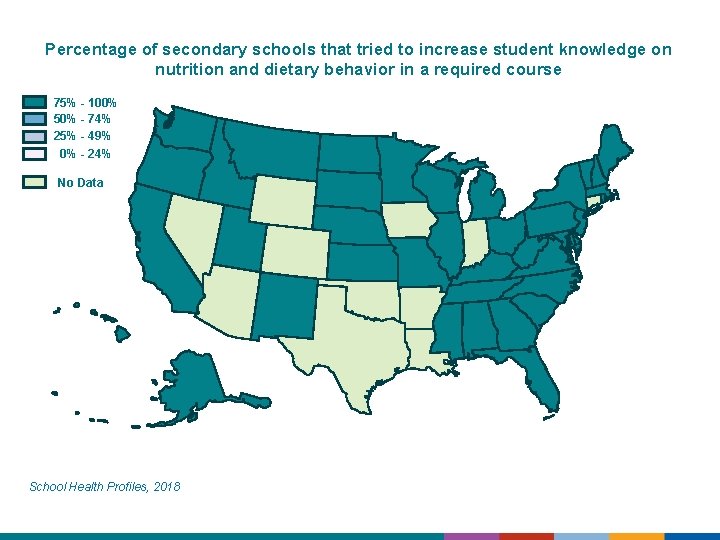
Percentage of secondary schools that tried to increase student knowledge on nutrition and dietary behavior in a required course 75% - 100% 50% - 74% 25% - 49% 0% - 24% No Data School Health Profiles, 2018
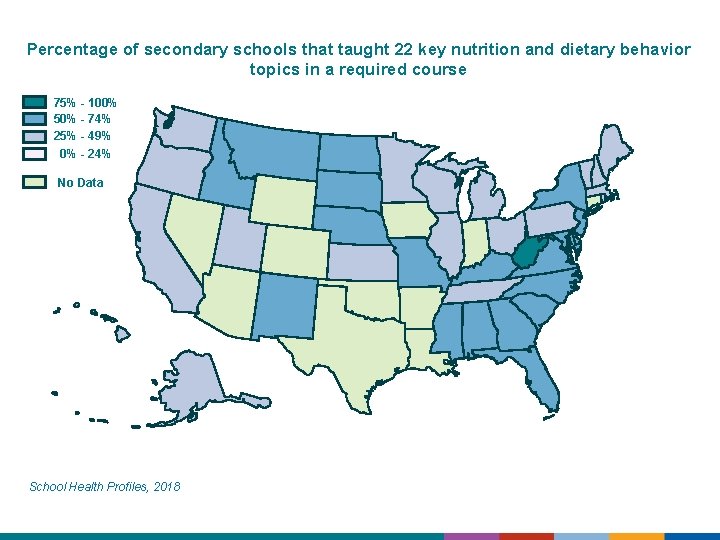
Percentage of secondary schools that taught 22 key nutrition and dietary behavior topics in a required course 75% - 100% 50% - 74% 25% - 49% 0% - 24% No Data School Health Profiles, 2018
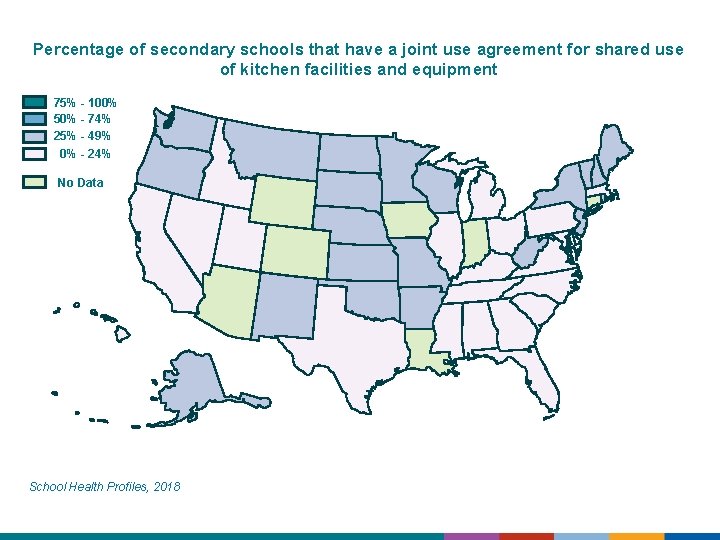
Percentage of secondary schools that have a joint use agreement for shared use of kitchen facilities and equipment 75% - 100% 50% - 74% 25% - 49% 0% - 24% No Data School Health Profiles, 2018