Nutrition Monitoring and Surveillance Some Definitions Joint Nutrition


")


 • CDC, National Center for Chronic Disease Prevention")
, preventive")


 • CDC, National Center for Chronic Disease Prevention")


 • USDA • 1994 -1996 •")


 • CDC, National Center for Health Statistics")
; • annual beginning in 1999 • after")


 • • USDA, Agricultural Research Service Periodically from")


")


- Slides: 87
Nutrition Monitoring and Surveillance
Some Definitions Joint Nutrition Monitoring Evaluation Committee, 1986 Expert Panel on Nutrition Monitoring, 1989
Nutrition Monitoring • Assessment of dietary or nutrition status at intermittent times with the aim of detecting changes in the dietary or nutritional status of a population
Nutrition Surveillance • Continuous assessment of nutritional status for the purpose of detecting changes in trend or distribution in order to initiate corrective measures
Dietary Status • The condition of a population’s or an individual’s intake of foods and food components, especially nutrients.
Nutrition Assessment • Measurement of indicators of dietary status and nutrition related health status to identify the possible occurrence, nature, and extent of impaired nutritional status.
Nutrition Monitoring in the United States
Chronology
Goals of NNMS • Provide foundations for improvement of nutritional status and quality and healthfulness of food supply • Collect, analyze, and disseminate timely data on nutrition and dietary status, quality of food supply, food consumption patterns, consumer knowledge and attitudes
NNMS Goals, cont. . . • ID high risk groups and geographic areas and trends • Establish national baseline data and develop standards for monitoring • Provide data for evaluating implications of changes in agricultural policy
National Nutrition Monitoring System • Jointly administered by USDA and DHHS • 22 federal agencies involved • Over 70 surveys and surveillance activities • Ten year comprehensive plan for Nutrition Monitoring and Related Research sent to congress in 1993
NNMS - Some Agencies • USDA – Food and Nutrition Service – Food Safety and Inspection Service – Agricultural Research Service – Economic Research Service – Extension Service – Cooperative State Research Service
• Department of Health and Human Services – National Center for Health Statistics – CDC-National Center for Chronic Disease Prevention and Health Promotion – Food and Drug Administration – Heath Resources and Services Administration – Indian Health Services – National Institutes of Health – Substance Abuse and Mental Health Services Administration
• Others: – Department of Defense – Department of Education – Agency for International Development – Department of Veterans Affairs – Census Bureau – Bureau of Labor Statistics – National Marine Fisheries Service
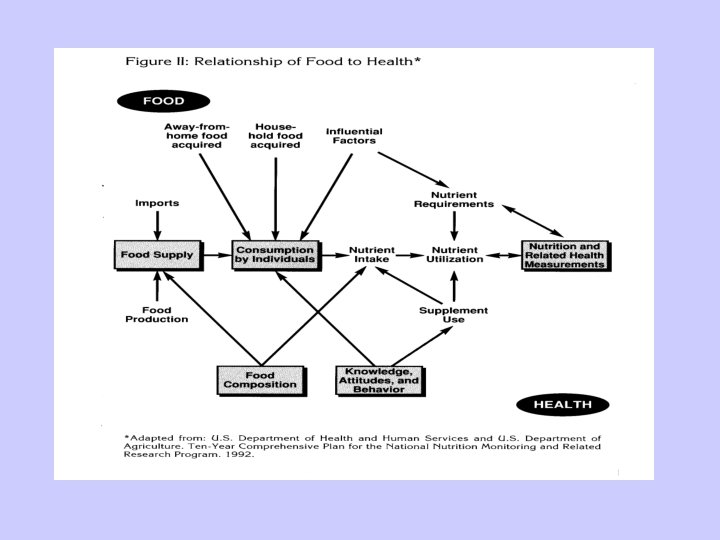
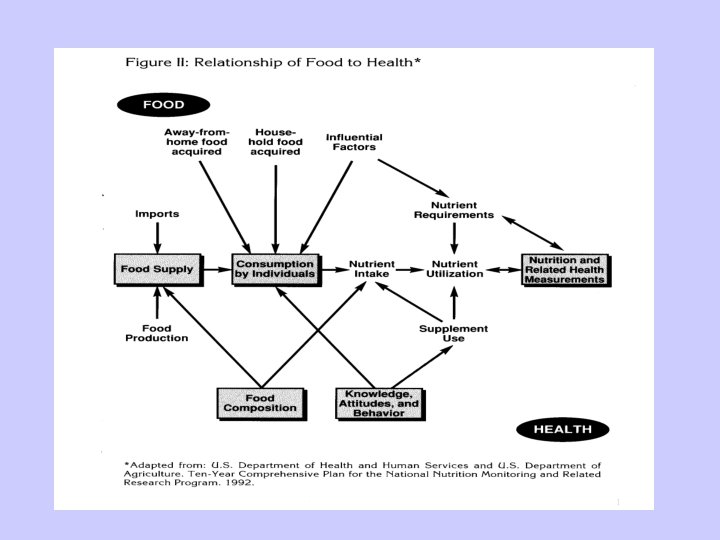
5 Areas of NNMS • Nutrition and related health measurements • Food and nutrient composition • Knowledge, attitudes, and behavior • Food composition and nutrient databases • Food Supply Determinations
Nutrition and Related Health Measurements • National Health and Nutrition Examination Surveys (I-V, and continuous) • National Health Interview Survey • National Hospital Discharge Survey • Pediatric Nutrition Surveillance System
Food and Nutrient Composition • Nationwide Food Consumption Survey • Continuing Survey of Food Intakes by Individuals
Knowledge, Attitudes, and Behavior • Behavioral Risk Factor Surveillance System • Youth Risk Behavior Survey • Diet and Health Knowledge Survey
Food Composition and Nutrient Data Bases • National Nutrient Data Bank (NNDB)
Food Supply Determinations • US Food and Nutrition Supply Series
Third Report on Nutrition Monitoring in the United States - December 1995
• Increase in rates of overweight and sedentary lifestyle • Increase in proportion of adults with desirable serum total cholesterol • Hypertension remains major public health problem - especially in non-Hispanic blacks • 9 -13% of low income households experience food insecurity • Rates of femoral osteoporosis in females > 50 years old: – 21% in non-Hispanic whites – 10% in non-Hispanic blacks – 16% in Mexican Americans
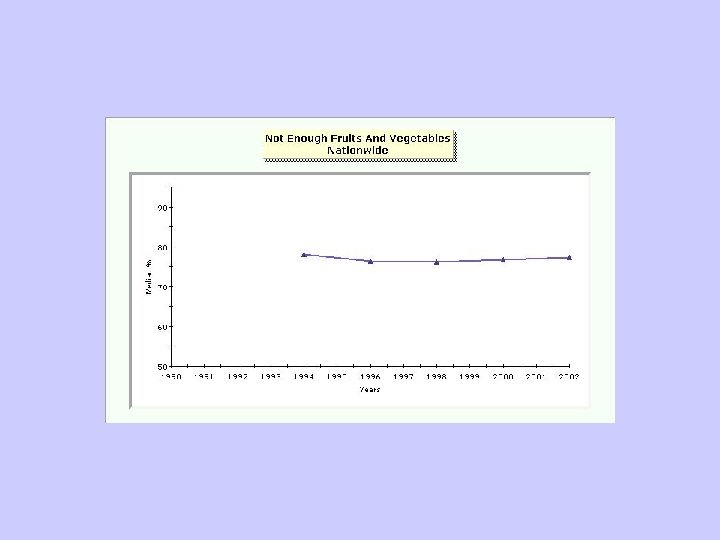
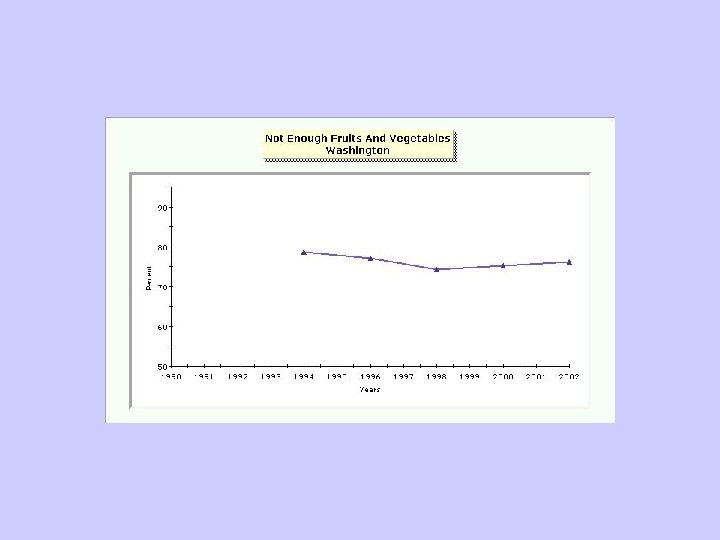
• Intakes of % of diet from total fat, saturated fatty acids, and cholesterol have decreased, but remain above recommended levels for large proportion of the population • Mean calcium intakes are below recommendations - especially in adolescents, adult females, elderly, and non-Hispanic black males • Median iron intakes below recommendations for children 1 -2, female adolescents, females 20 -59 • Average daily intake of fruits and vegetables is about 4 servings
Nutrition Monitoring in the United States The Directory of Federal and State Nutrition Monitoring and Related Research Activities 2000 An Inventory of Resources
Major Surveys with Nutrition Content
Behavioral Risk Factor Surveillance System (BRFSS) • CDC, National Center for Chronic Disease Prevention and Health Promotion (NCCDPHP) • Annually since 1984 (not all states at first) • Telephone interview • Data collection is conducted separately by each State. Sample design uses State-level, random-digit-dialed probability samples of the adult (aged 18 years and over) population. • State-specific sample sizes ranged from 1, 499 to 6, 005
BRFSS - Questions • Behavioral risk factors (for example, alcohol and tobacco use), preventive health measures, HIV/AIDS, health status, limitation of activity, and health care access and utilization • Core of questions asked in all States • Standardized optional questions on selected topics administered at the State’s discretion • Rotating core of questions asked every other year in all States • State-added questions developed to address Statespecific needs
BRFSS - Data • National • State • Smaller units when local agencies pay for additional surveys • Data system homepage: http: //www. cdc. gov/nccdphp/brfss
BRFSS - Nutrition • • • Self reported height and weight Trying to loose weight? 6 fruit and vegetable intake questions Activity Food security
Youth Risk Behavior Surveillance System (YRBSS) • CDC, National Center for Chronic Disease Prevention and Health Promotion (NCCDPHP) • School based, grades 9 -12 • National survey is done in 150 schools, states and local districts conduct their own surveys • Other components: national alternative school survey, middle school surveys in selected States, and the National College Health Risk Behavior Survey • Anonymous self-administered questionnaires • Biennial (odd-numbered years) • 1999 national survey, N= 15, 349
YRBS - Data • Gender, age, grade, race/ethnicity, urbanicity of school • National and 4 census regions • By state for 41 states in 1999 • 16 large metropolitan school districts • http: //www. cdc. gov/nccdphp/dash/yrbs/ov. htm
YRBS - Categories • • • injury tobacco use alcohol and other drug use sexual behavior diet and nutrition physical activity
YRBS - Nutrition • • • Self reported weight and height Dieting behaviors Eating disorder behaviors Fruit and vegetable intake Fat intake
Seattle YRBS 1993 1999 Percentage of students who were trying to 34. 4 38. 3 lose weight Percentage of students who exercised or participated in physical activities for at least 20 minutes that made them sweat and breathe hard on three or more of the past seven days 64. 4 64. 1
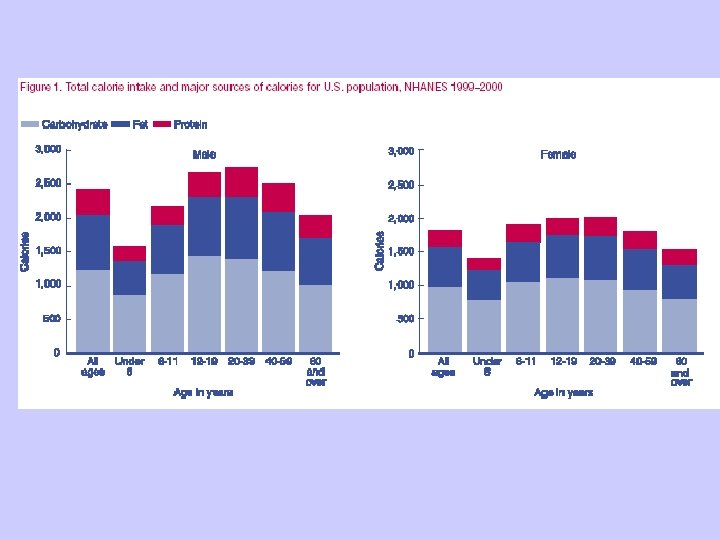
Continuing Survey of Food Intake by Individuals (CSFII) • USDA • 1994 -1996 • in-person interviews • 24 -hour dietary recall: 2 nonconsecutive days of food intake data collected 3 -10 days apart • 2 weeks later, one adult from each household asked questions about knowledge and attitudes toward dietary guidance, health, and use of food labels.
CFSII - Sample • Nationally representative stratified multistage area probability sample of U. S. noninstitutionalized civilian population, all ages. • Oversampling of low-income households • For 1994– 96, sample size for 1 -day dietary data was 16, 103; for 2 -day dietary data, it was 15, 303.
CFSII - Data • kinds and amounts of foods consumed • sources of foods • time, name of each eating occasion • food expenditures, shopping practices • pregnancy, lactation, nursing status, • height and weight • income, poverty status, household size, • participation in Food Stamp and WIC programs
CFSII - Data Availability • National; four U. S. Census Bureau regions; Standard Metropolitan Statistical Areas • http: //www. barc. usda. gov/bhnrc/foodsurvey/home. htm
CFSII - Nutrition • food intakes in grams of 71 USDA-defined food groups and subgroups • nutrient intakes of 28 nutrients and food components • nutrient intakes expressed as percentages of the 1989 Recommended Dietary Allowance • Pyramid servings from 30 food groups
Cleveland et al. Dietary Intake of Whole Grains. J Am Coll Nutr. 2002.
Enns et al. Family Economics and Nutrition Review, 1997.
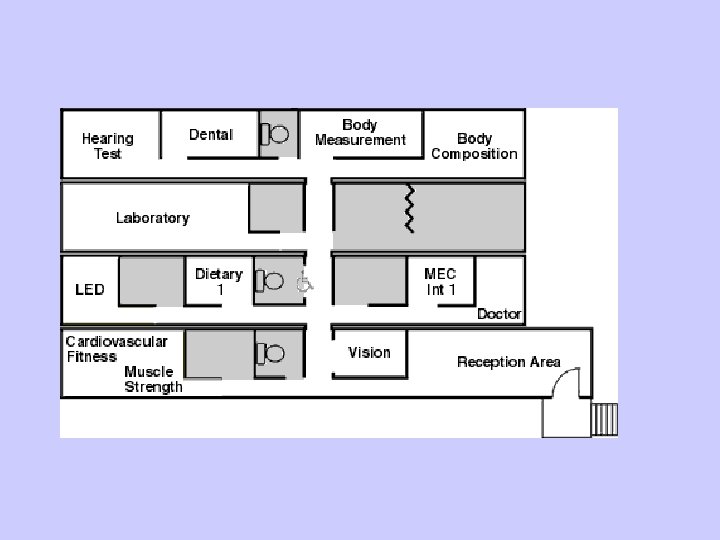
National Health and Nutrition Examination Survey (NHANES) • CDC, National Center for Health Statistics (NCHS) • In-person interview in household and mobile examination center • stratified multistage probability sample, nationally representative of the U. S. civilian noninstitutionalized population • Approximately 5, 000 people are examined at 15 locations each year • All ages beginning in 1999
NHANES - Continuous • Periodic (1960– 94); • annual beginning in 1999 • after 1999 annual sample size will be too small to provide reliable estimates for many measures and for most subgroups. Most analyses will require 3 years of data for reliable estimates.
http: //www. cdc. gov/nchs/about/major/nhanes/mectour. htm
NHANES - Content • Chronic disease prevalence and conditions (including undiagnosed conditions • immunization status • infectious disease prevalence • health insurance • measures of environmental exposures • hearing • vision • mental health
NHANES - Content • anemia • diabetes • cardiovascular disease • osteoporosis • obesity • oral health • physical fitness
NHANES - New in 1999 • • cardiorespiratory fitness physical functioning lower extremity disease full body DXA for body fat as well as bone density • tuberculosis
NHANES - Data • National; four U. S. Census Bureau regions • Demographics: Gender, age, education, race/ethnicity, place of birth, income, occupation, and industry • http: //www. cdc. gov/nchs/nhanes. htm
NHANES - Nutrition • • Food Security Dietary supplements Weight history Dietary Recall - one 24 hour
NHANES III Anthropometric Procedures Video • • • Body weight Standing height Sitting height Upper leg length Recumbent length Upper arm length Knee height Arm circumference Waist circumference • • Buttocks circumference Thigh circumference Head circumference Skinfolds (including thighs, triceps, subscapular, and suprailiac) • Wrist breadth • Elbow breadth
NHANES-CFSII Integration • Staged integration of two surveys underway • 2001 a year of testing, 2002 full integration • Goals: continuous data collection, linkage of diet and health data, 2 days of dietary data collection (second day by phone 3 to 10 days after initial exam) • DHKS not part of integrated efforts at this time, but under consideration
Diet and Health Knowledge Survey (DHKS) • • USDA, Agricultural Research Service Periodically from 1989 to 1996 In conjunction with CSFII Sample size per year – ~1300 from 1989 through 1991 – ~2000 per year 1994 -1996 • telephone follow up conducted with one adult in each household 2 -3 weeks after CFSII
DHKS - Content • Designed to assess relationships between knowledge and attitudes about dietary guidance and food safety, food choice decisions and nutrient intakes • Variables can be linked to CFSII variables for individuals.
DHKS - Questions • • Self perceived intake levels awareness of diet/health relationships use of food labels perceived importance of following dietary guidance for specific nutrients and food components • beliefs about food safety • Knowledge about food sources of nutrients
DHKS - Descriptive Variables • Individual: gender, age, ethnicity, education, employment status, height and weight • Household: income, size, cash assets, region, urbanization, tenancy, participation in food stamps and WIC
DHKS - URL www. barc. usda. gov/bhnrc/foodsurvey/csfii 94. htm
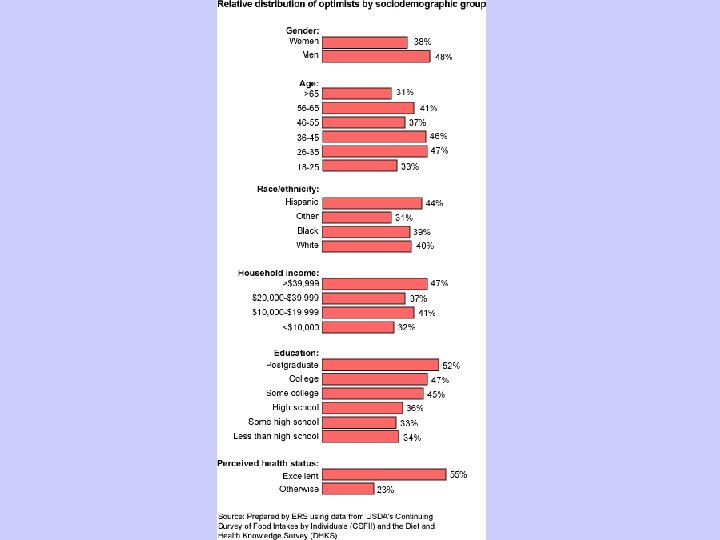
Optimists: rate diet quality as better than actually is Pessimists: rate diet quality as worse than it is http: //www. ers. usda. gov/briefing/Diet. And. Health/healthfuldiet. htm
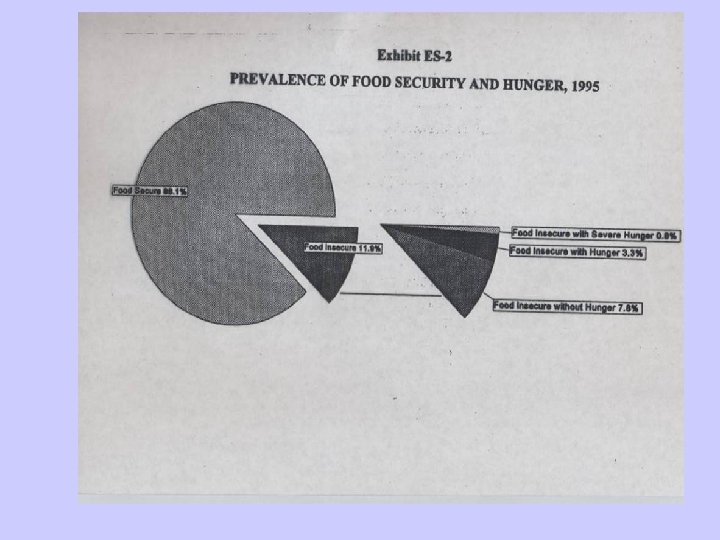
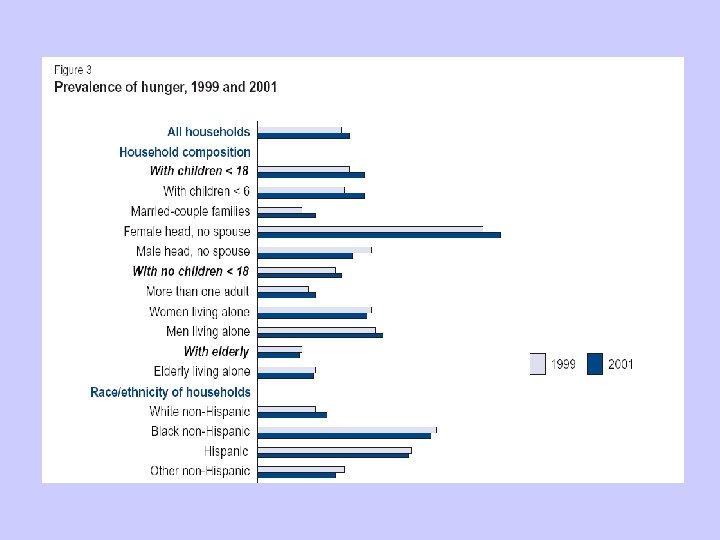
Household Food Security in the United States, 2001 Food Assistance and Nutrition Research Report #29 Economic Research Service U. S. Department of Agriculture November 2002
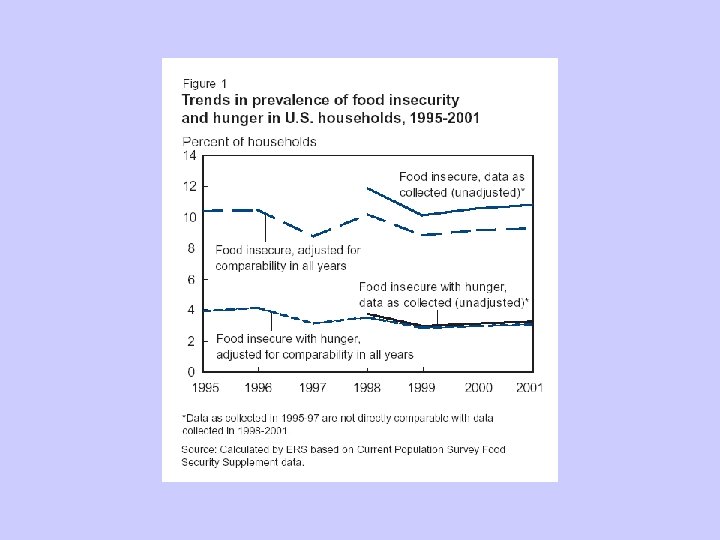
• 89. 3 percent of U. S. households were food secure throughout the entire calendar year 2001. • 10. 7 percent of U. S. households were food insecure at some time during the year. • In 3. 3 percent of households people were hungry at times during the year because they couldn’t afford enough food. • Rates of food insecurity and hunger in the U. S. increased during the 2 -year period 1999 -2001.
Nutrition Security • The provision of an environment that encourages and motivates society to make food choices consistent with short and long term good health.
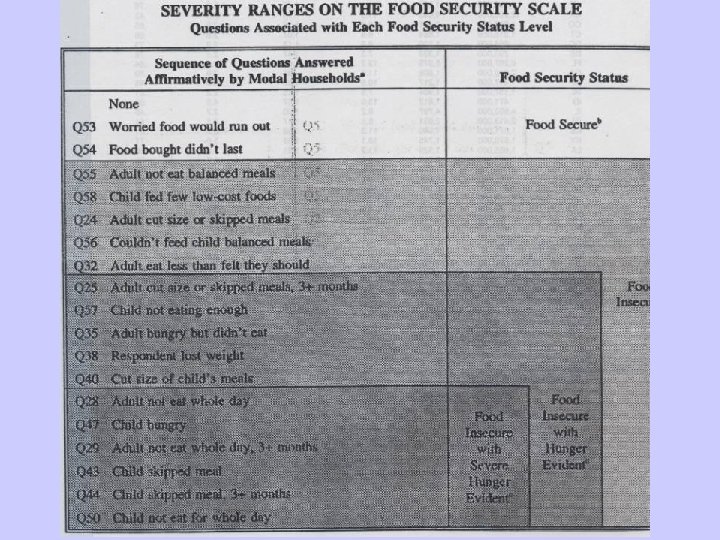
Food Security • Assess by all people at all times to sufficient food for an active and healthy life. Food security includes at a minimum: the ready availability of nutritionally adequate and safe foods, and an assured ability to acquire acceptable foods in socially acceptable ways.
Food Insecurity • a household had limited or uncertain availability of food, or limited or uncertain ability to acquire acceptable foods in socially acceptable ways (i. e. , without resorting to emergency food supplies, scavenging, stealing, or other unusual coping strategies).
Hunger • The uneasy or painful sensation caused by a lack of food. • Involuntary hunger that results from not being able to afford enough food • The recurrent and involuntary lack of access to food • May produce malnutrition over time.
1990 History of the Food Security Measurement Project 1992 NMRR Act recommends a standardized mechanism for defining and obtaining data on the prevalence of food insecurity USDA staff review existing research 1994 USDA and DHHS sponsor conference on Food Security Measurement and Research 1995 Current Population Survey of US Census Bureau includes Food Security Measurement scale Annual Surveys, ERS assumes leadership, others encouraged to use FSMS 1996 present
Washington State, 1999 -2001 • Food Insecure without hunger – 12. 5% • Food Insecure with hunger – 4. 6
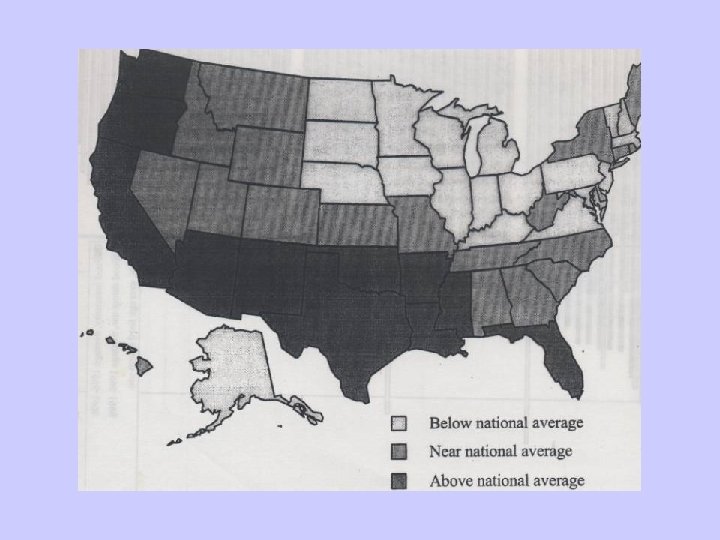
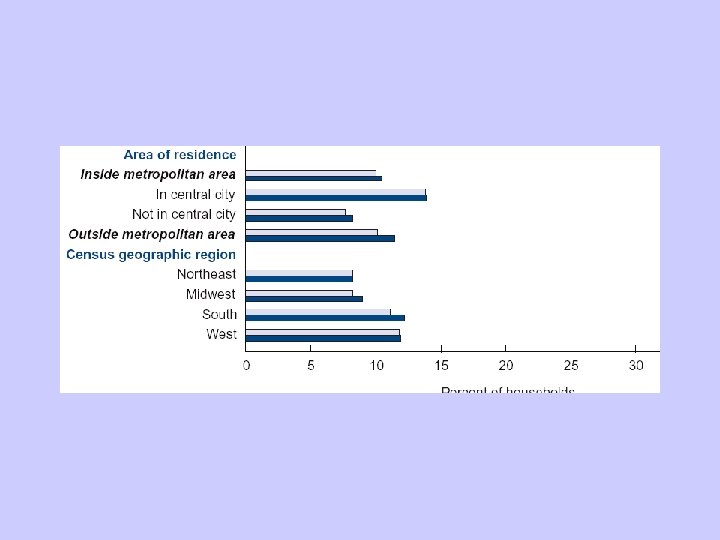
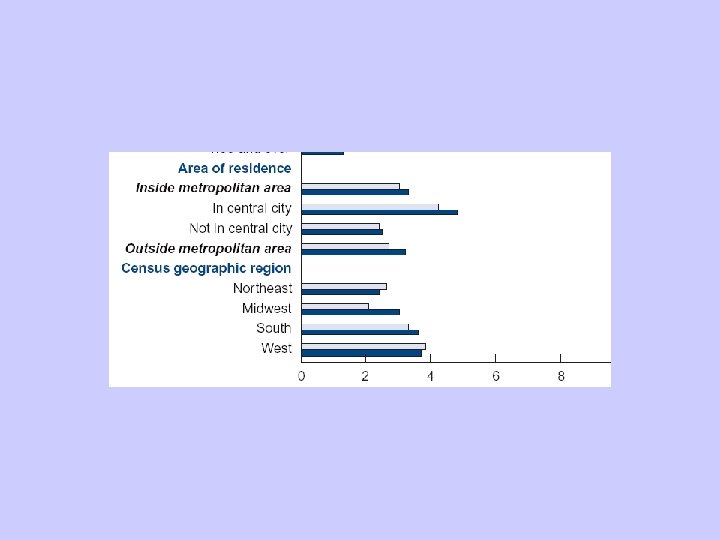
Prevalence • The West and South Census Regions registered somewhat higher prevalences than did the Northeast and Midwest. • Food insecurity and hunger were more prevalent in central cities and in nonmetropolitan areas than in suburban areas.
Update with 2003 data
2003 National Results • Food Insecurity = 11. 2% – (increased from 11. 1%) • Food Insecurity with hunger = 3. 5% – No change from 2002
Food Insecurity with Hunger
Food Insecure Numbers in Washington Year Numbers of Households 2002 290, 000 2003 275, 000
Why did Washington’s rates improve? • Increased participation in federal programs • Between 2001 and 2004 there was a 59% increase in food stamp participation. • Improving economy?
Other National Findings • 70% of food insecure families had visited a food pantry within the past year. • Only 18. 3% of families with incomes below 130% had participated in food stamps in the past month.