
Nutrition lecture 10 Nutrition in childhood teen years



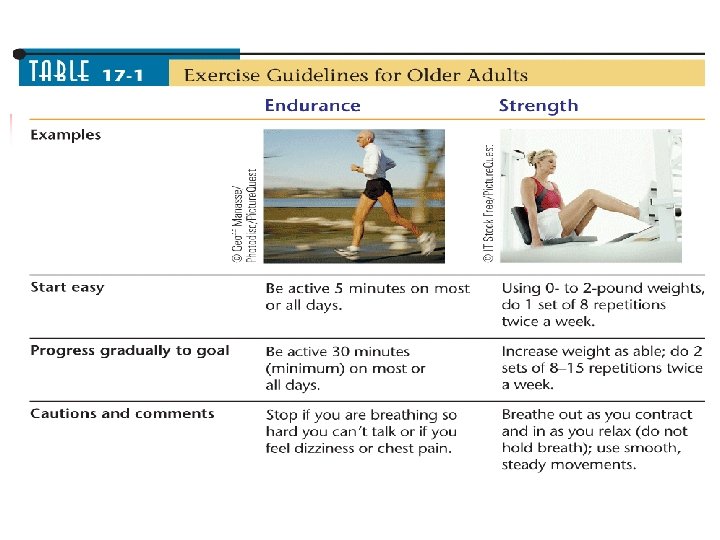
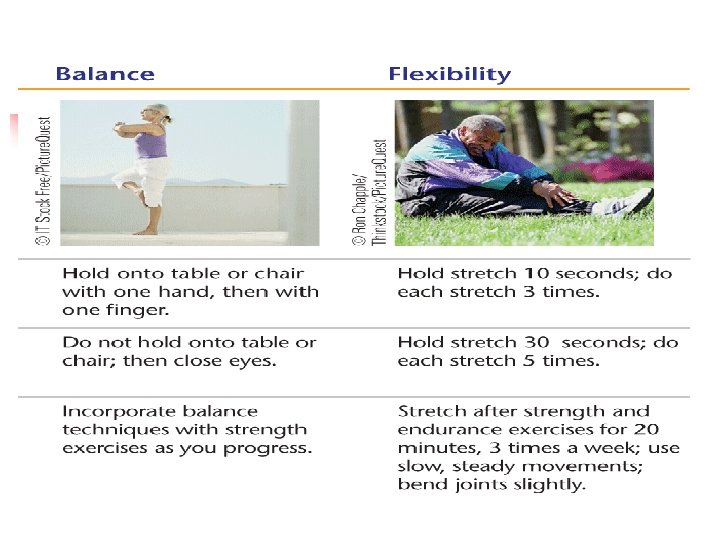
- Slides: 75
Nutrition lecture 10 Nutrition in childhood, teen years and older adult
Childhood n n n By 1 year of age toddler should be eating same foods as family but in much smaller quantities Between age 1 to 2 years, growth slows down. Child will eat less when growth is slowed. Child’s energy intake varies from meal to meal. Their total daily intake remains constant. - may eat well less at one meal, then more at the next.
Growth and nutrient needs of young children Energy needs increase with age: n 1 yr old about 1000 calories/day. n Total energy needs increase slightly with age, but energy needs per kilogram of body weight actually decline gradually.
Carbohydrate and Fiber n n n Carbohydrate recommendations are based on glucose use by the brain. After 1 year, glucose use remains fairly constant and is within adult range. Children’s fiber intakes should at least equal their “ age plus 5 grams. ”
Fat and Fatty Acids n n Children who eat low-fat diets, have low intakes of some vitamins and minerals. DRI Committee recommends a fat intake of 30 -40% of energy for 1 -3 years of age and 25 -35% for 4 -18 years of age.
Protein n n Total protein needs increase slightly with age. The estimation of protein needs considers the requirements for maintaining nitrogen balance, the quality of protein consumed and the added needs of growth.
Vitamins and Minerals n n n The requirements increase with age. Iron deficiency anemia is the most prevalent nutrient deficiency in Canadian children especially in toddlers 1 -2 years of age. Don’t need supplements.
Hunger And Malnutrition In Children n n When hunger is chronic, children become malnourished and suffer growth retardation. Even when hunger is temporary (misses 1 meal), behavior and academic performance are affected.
Child nourishment programs Research supports that children who do not eat breakfast: n Have poorer concentration n Shorter attention spans n Achieve lower test scores n Are tardy or absent more frequently than well fed peers.
Child nourishment programs n n 20% of children attend school without breakfast and only 30% consume adequate servings from all four food groups. Child nourishment programs can help meet children’s nutrient needs.
Iron deficiency and behavior n n Iron carries oxygen in the blood, transports oxygen within the cells – which use it in energy metabolism. Iron makes neurotransmitters – those that regulate the ability to pay attention which is crucial to learning.
Nutrients and Health: Lead n n n Lead poisoning causes iron-deficiency anemia. Lead is chemically similar to minerals like iron, calcium and zinc. It displaces these nutrients at their points of action, but then is unable to perform their functions.
Diet and Hyperactivity n n n Inattentive and impulsive behavior that is more frequent and severe than is typical of others a similar age. Hyperactivity or attention deficit /hyperactivity disorder (ADHD) occurs in about 5 – 10 % of children. Chronic inability to pay attention, along with overly active behaviour and poor impulse control.
Food Allergy n n n About 8% of children have food allergy. (Adults about 2%) Allergy occurs when a whole food protein or other large molecules enters the tissue. The immune system reacts to protein by releasing antibodies and histamine.
Symptoms of Food Allergy n n n n The most common symptom of a food-allergy reaction is hives. Other symptoms can include one or more of the following: tingling in the mouth swelling in the tongue and throat difficulty breathing abdominal cramps vomiting diarrhea eczema
Food Allergy n n n Strict elimination of offending food. Include other foods that offer the same nutrients as the omitted foods. Allergic reactions to food may be immediate or delayed. The antigen interacts immediately with the immune system but timing of symptoms varies from minutes to 24 hours after consumption of antigen.
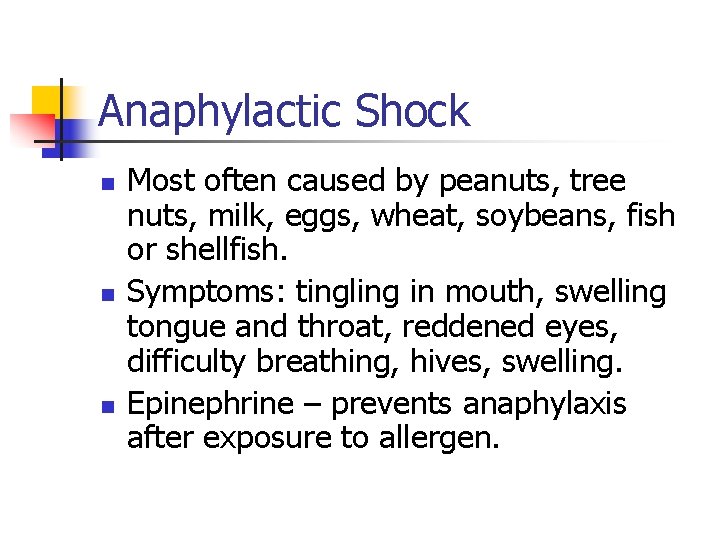
Anaphylactic Shock n n n Most often caused by peanuts, tree nuts, milk, eggs, wheat, soybeans, fish or shellfish. Symptoms: tingling in mouth, swelling tongue and throat, reddened eyes, difficulty breathing, hives, swelling. Epinephrine – prevents anaphylaxis after exposure to allergen.
Food Allergy Quiz n The eight most common foods that cause food allergies are milk, eggs, _____, wheat, _____, shellfish, tree nuts, and peanuts. n Food allergies occur when the body thinks a food is: a) bitter b) harmful c) purple n The most common symptom of a food allergy reaction is: a) your big toe turning yellow b) hiccups c) hives n The only way to avoid a reaction is to (Circle one) : eat / NOT eat the food that contains the allergen you are allergic to.
Food Allergy Quiz n n n Someone who has a reaction when he eats walnuts, pecans, and cashews is allergic to _____ (2 words) Someone who broke out in hives, had trouble breathing, and had to use her Epi. Pen® the time she ate New England Clam Chowder and fried shrimp is probably allergic to: a) fish b) the color blue c) shellfish Most of the people who have food allergies are: a) adults b) children c) basketball fans
Resources n n http: //www. foodallergy. org/ http: //www. calgaryallergy. ca/aaia/index. htm
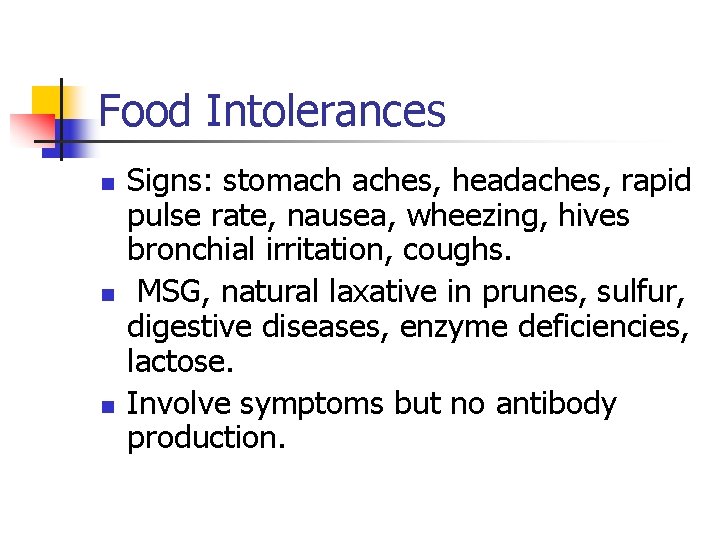
Food Intolerances n n n Signs: stomach aches, headaches, rapid pulse rate, nausea, wheezing, hives bronchial irritation, coughs. MSG, natural laxative in prunes, sulfur, digestive diseases, enzyme deficiencies, lactose. Involve symptoms but no antibody production.
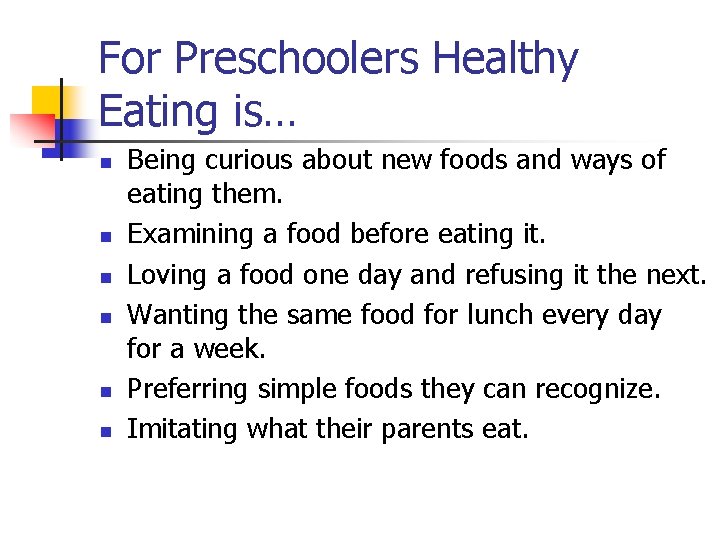
For Preschoolers Healthy Eating is… n n n Being curious about new foods and ways of eating them. Examining a food before eating it. Loving a food one day and refusing it the next. Wanting the same food for lunch every day for a week. Preferring simple foods they can recognize. Imitating what their parents eat.
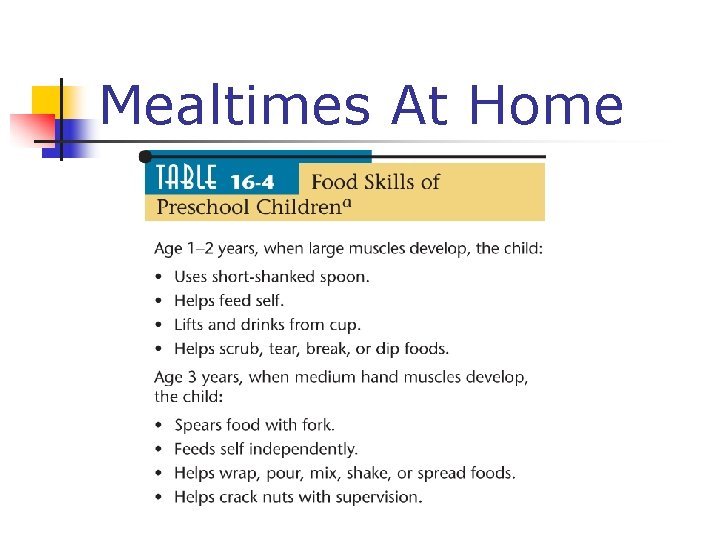
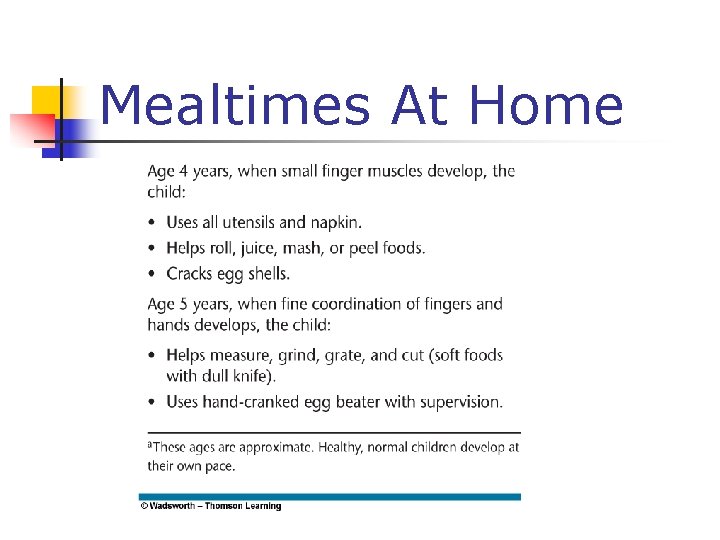
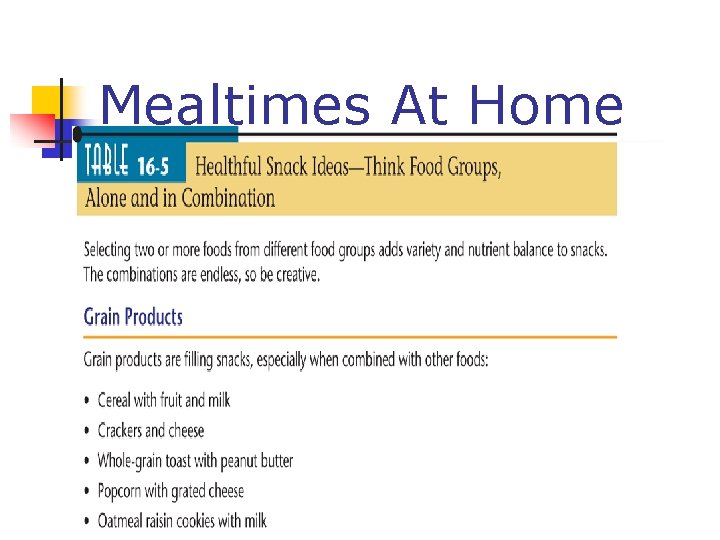
Mealtimes At Home
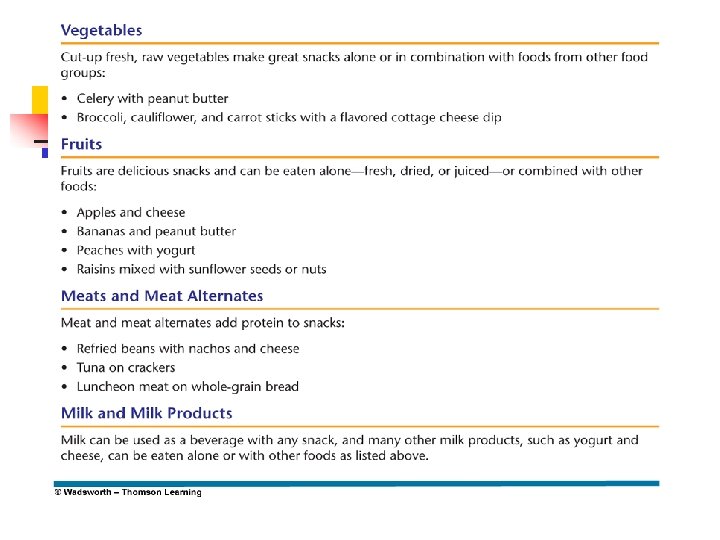
Mealtimes At Home
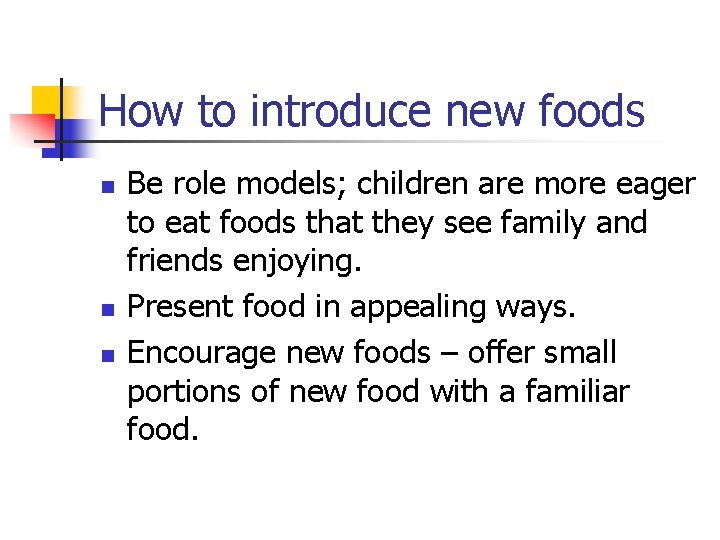
How to introduce new foods n n n Be role models; children are more eager to eat foods that they see family and friends enjoying. Present food in appealing ways. Encourage new foods – offer small portions of new food with a familiar food.
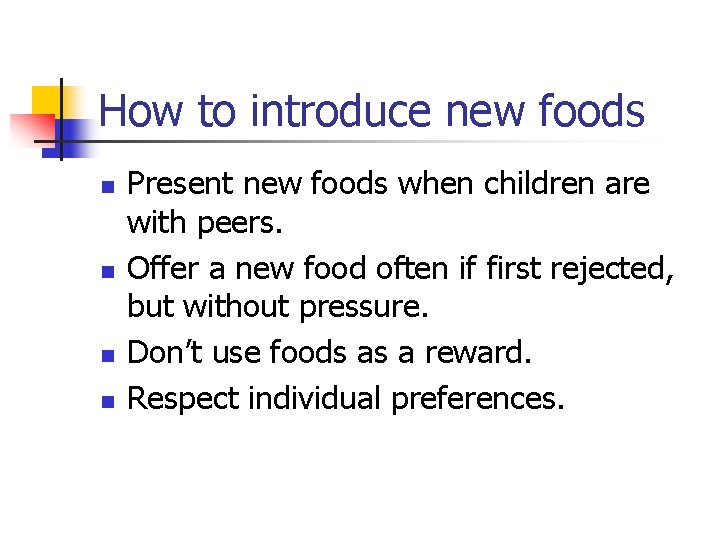
How to introduce new foods n n Present new foods when children are with peers. Offer a new food often if first rejected, but without pressure. Don’t use foods as a reward. Respect individual preferences.
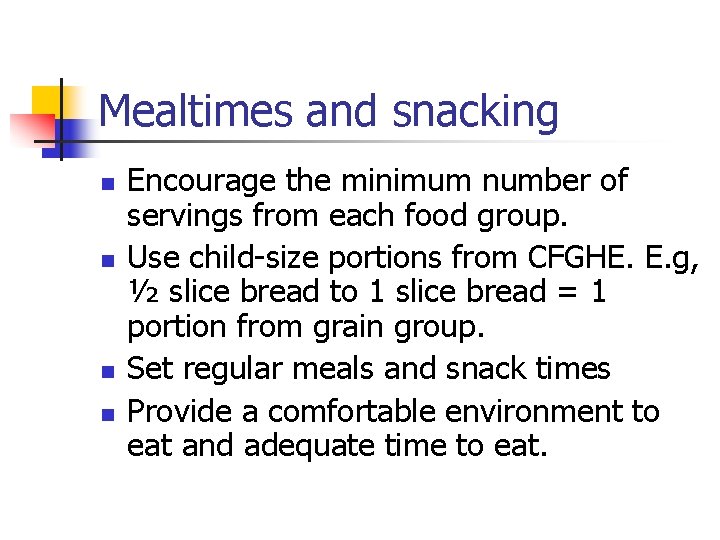
Mealtimes and snacking n n Encourage the minimum number of servings from each food group. Use child-size portions from CFGHE. E. g, ½ slice bread to 1 slice bread = 1 portion from grain group. Set regular meals and snack times Provide a comfortable environment to eat and adequate time to eat.
Mealtimes At Home
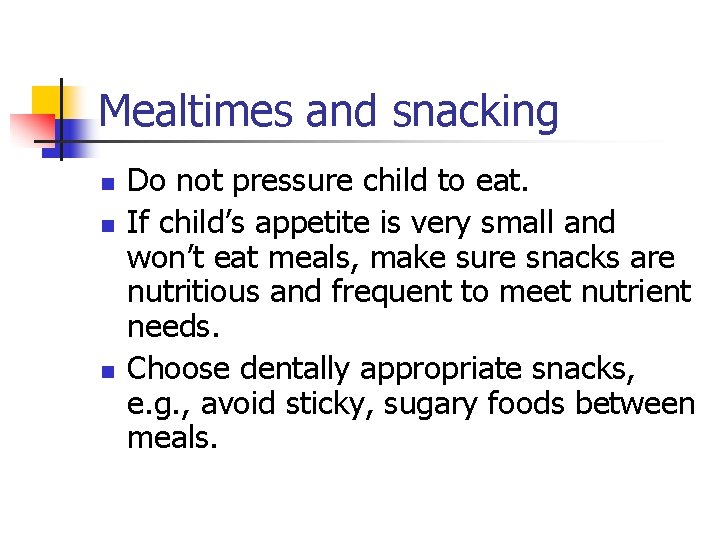
Mealtimes and snacking n n n Do not pressure child to eat. If child’s appetite is very small and won’t eat meals, make sure snacks are nutritious and frequent to meet nutrient needs. Choose dentally appropriate snacks, e. g. , avoid sticky, sugary foods between meals.
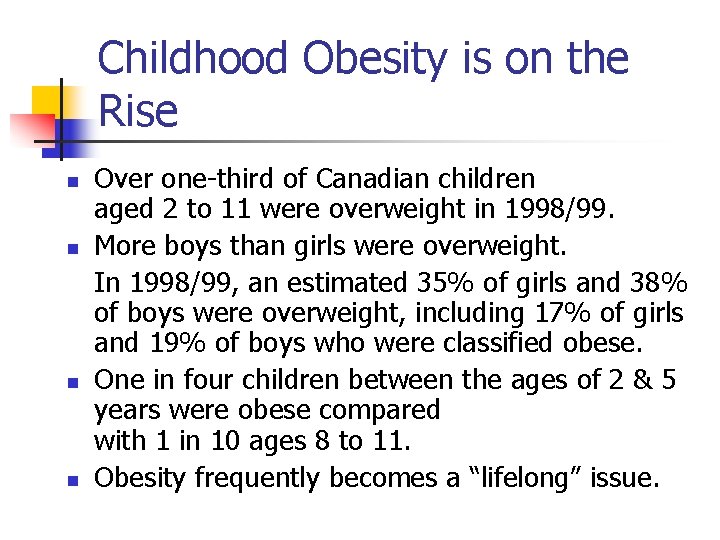
Childhood Obesity is on the Rise n n Over one-third of Canadian children aged 2 to 11 were overweight in 1998/99. More boys than girls were overweight. In 1998/99, an estimated 35% of girls and 38% of boys were overweight, including 17% of girls and 19% of boys who were classified obese. One in four children between the ages of 2 & 5 years were obese compared with 1 in 10 ages 8 to 11. Obesity frequently becomes a “lifelong” issue.
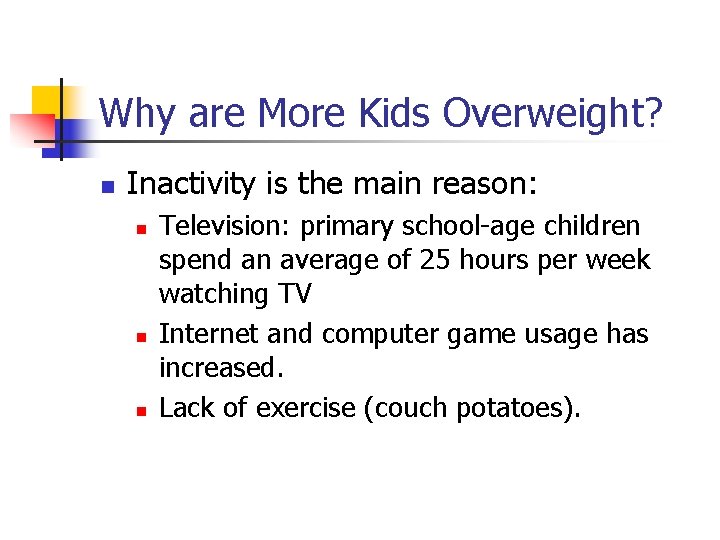
Why are More Kids Overweight? n Inactivity is the main reason: n n n Television: primary school-age children spend an average of 25 hours per week watching TV Internet and computer game usage has increased. Lack of exercise (couch potatoes).
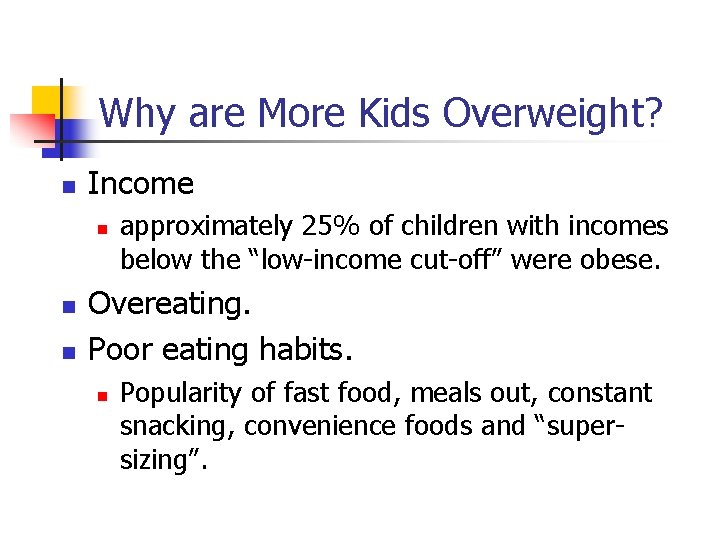
Why are More Kids Overweight? n Income n n n approximately 25% of children with incomes below the “low-income cut-off” were obese. Overeating. Poor eating habits. n Popularity of fast food, meals out, constant snacking, convenience foods and “supersizing”.
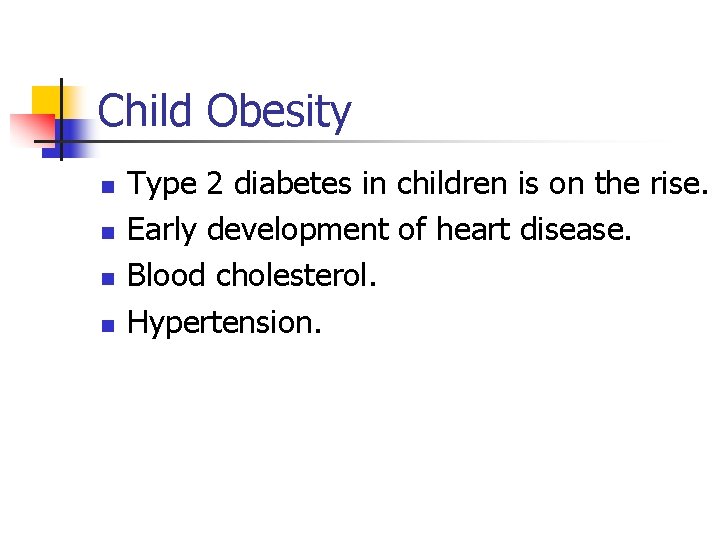
Child Obesity n n Type 2 diabetes in children is on the rise. Early development of heart disease. Blood cholesterol. Hypertension.
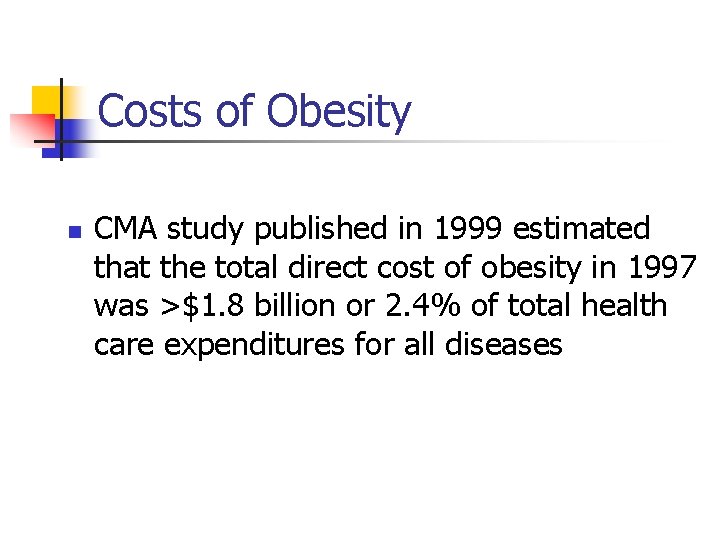
Costs of Obesity n CMA study published in 1999 estimated that the total direct cost of obesity in 1997 was >$1. 8 billion or 2. 4% of total health care expenditures for all diseases
Are Children Measuring Up? n n n “Early identification of health problems by monitoring growth is critical to the future health of infants and children. Growth monitoring is important to identify growth failure, the rise in childhood obesity and associated short and long term health problems. Growth charts alone should not be used to make a diagnosis.
Advantages of BMI-for-Age n n Provides a reference for adolescents that was not previously available. Consistent with adult index so it can be used continuously from 2 years of age to adulthood. Tracks childhood overweight into adulthood. BMI-for-age during pubescence is related to lipid levels & high blood pressure in middle age.
BMI-for-Age Cutoffs Ø Ø Ø The 95 th percentile Overweight 85 th – 95 th percentile Risk of overweight 5 th percentile Underweight
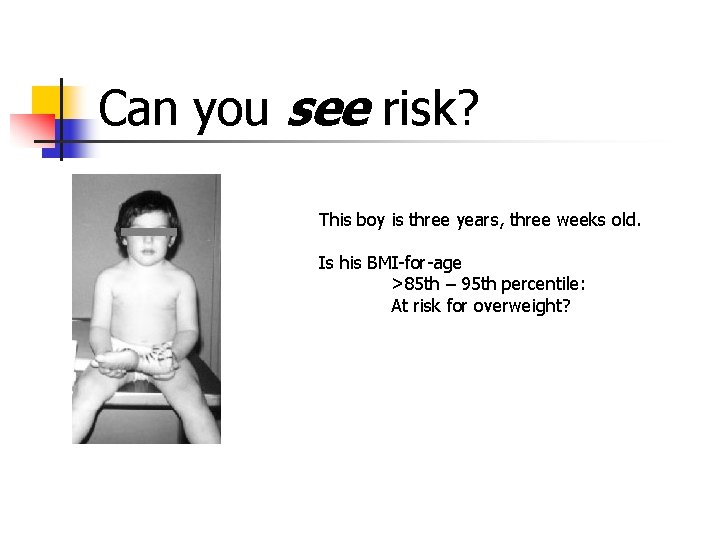
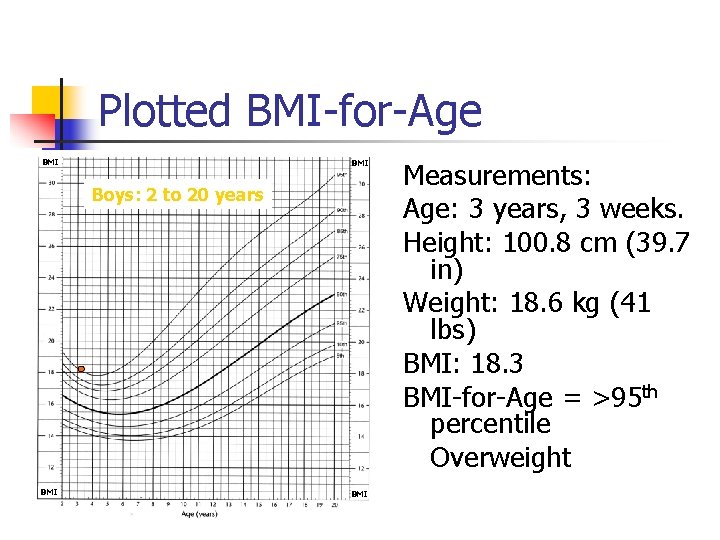
Can you see risk? This boy is three years, three weeks old. Is his BMI-for-age >85 th – 95 th percentile: At risk for overweight?
Plotted BMI-for-Age BMI Boys: 2 to 20 years BMI Measurements: Age: 3 years, 3 weeks. Height: 100. 8 cm (39. 7 in) Weight: 18. 6 kg (41 lbs) BMI: 18. 3 BMI-for-Age = >95 th percentile Overweight
CDC Website n http: //www. cdc. gov/growthcharts/ Download growth charts. For tools related to the growth charts. For additional training materials related to the growth charts.
Treatment PREVENTION is the preferred approach because once a child has become obese treatment is difficult and the condition often becomes a lifelong problem. n Family (child, parents, siblings) n Schools n Health Professionals n Government n Industry n Media
Treatment – Behavioral Therapy n n Most behavioral treatments for pediatric obesity have concentrated on diet, physical activity and behavior change. For Example: children should be taught to recognize and avoid situations which lead them to eat inappropriately.
Treatment – Lifestyle/Activity n n n Reduction in Sedentary Behavior. Limit TV watching, video game playing and computer use time. Offer a variety of activities. Parents must be a role model. Become more active. Create an environment that fosters physical activity.
Dietary Treatment n n n n Dietary Modification –identifies ways to change habits. Identify current patterns (eating and activity records). Behavioural patterns are identified. Supermarket tours for the household grocery shopper. Avoid dieting as can affect growth. Encourage healthy eating pattern based on CFGHE Hold weight steady and allow child to “grow” into weight
Factors Predicting Success n n n Frequent intervention visits. Including parents in the dietary treatment program. Strong social support of dietary intervention from others involved in preparing food. Regular exercise prescription including social support. Weight control must be recognized as a lifelong effort.
Child Obesity in children is being recognized as a major health concern. The issue of child obesity is very challenging since it may also be accompanied by immediate conditions that require medical attention at diagnosis time. Even though we would like children to take responsibility for their own healthy lifestyle, we Must realize that they are not able to do so without a structure in place to support them.
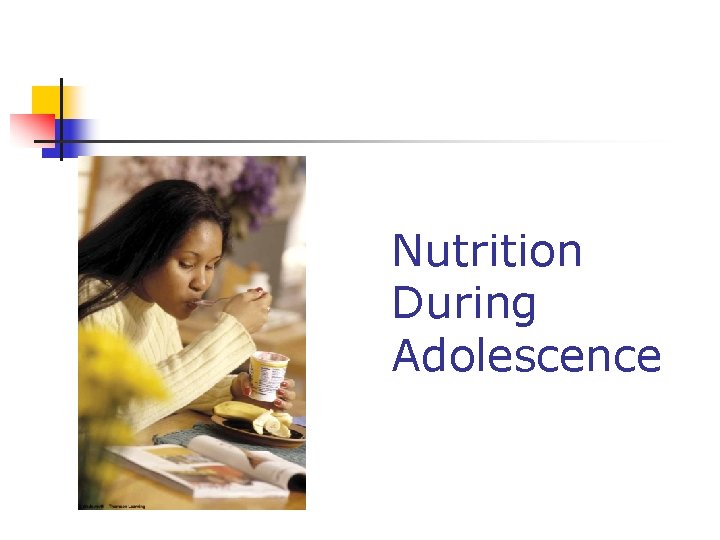
Nutrition During Adolescence
Teen Years, Nutrient needs n n n Rapid growth – high need for energy and nutrients. Nutrient needs vary by gender, body size and activity, eg, boys may need 4000 calories per day, girls 2000. Vitamins: RDA and A. I. for most vitamins and minerals increase during adolescence.
Growth n n n Females: growth spurt begins at age 10 or 11. Males: growth spurt begins at 12 or 13. Growth spurt lasts about two and a half years. Females: fat assumes a larger percentage of total body weight. Males: lean body mass (muscle and bone) increases more than females.
Nutrient needs continued n n Iron needs increase for females with menstruation and for males with increase of lean body mass. Iron needs remain high into adulthood for females but return to preadolescent values for males in early adulthood. Adolescence is crucial time for bone development and requirement for calcium reaches its peak during these years. High calcium needs, 1300 mg per day for development of bone for growth needs and for maximum bone density later in life.
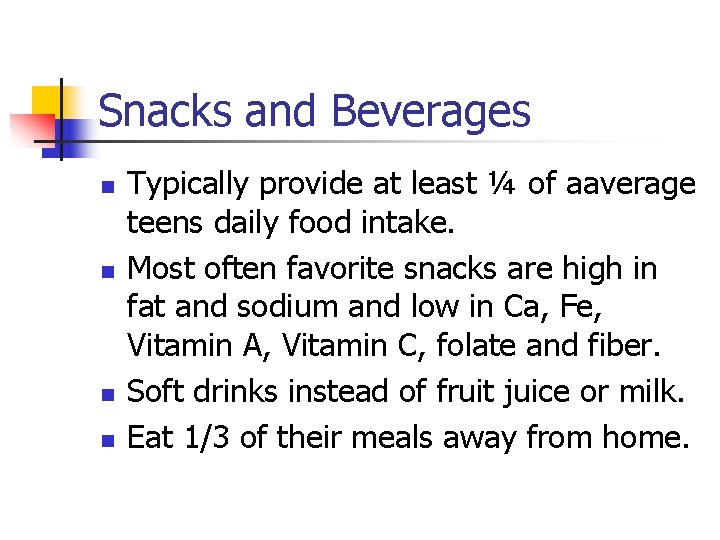
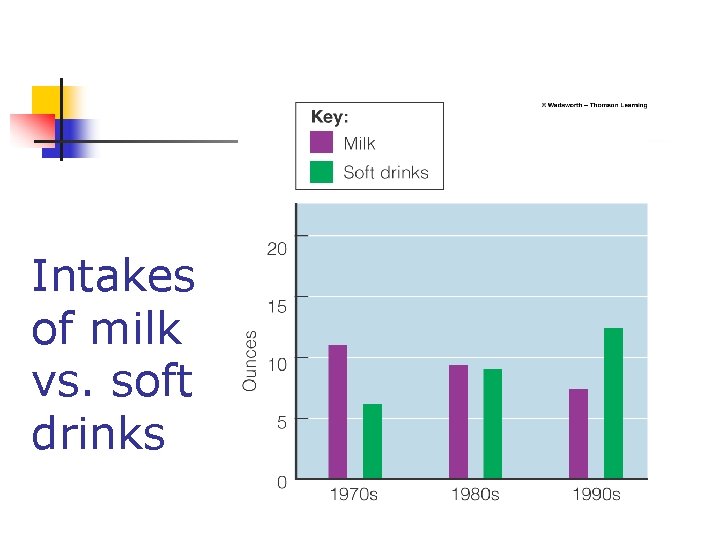
Snacks and Beverages n n Typically provide at least ¼ of aaverage teens daily food intake. Most often favorite snacks are high in fat and sodium and low in Ca, Fe, Vitamin A, Vitamin C, folate and fiber. Soft drinks instead of fruit juice or milk. Eat 1/3 of their meals away from home.
Intakes of milk vs. soft drinks
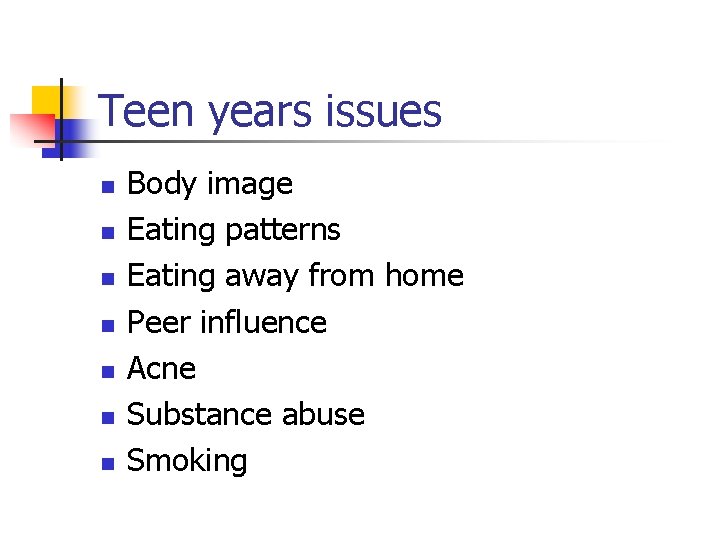
Teen years issues n n n n Body image Eating patterns Eating away from home Peer influence Acne Substance abuse Smoking
Nutrition for the Older Adult
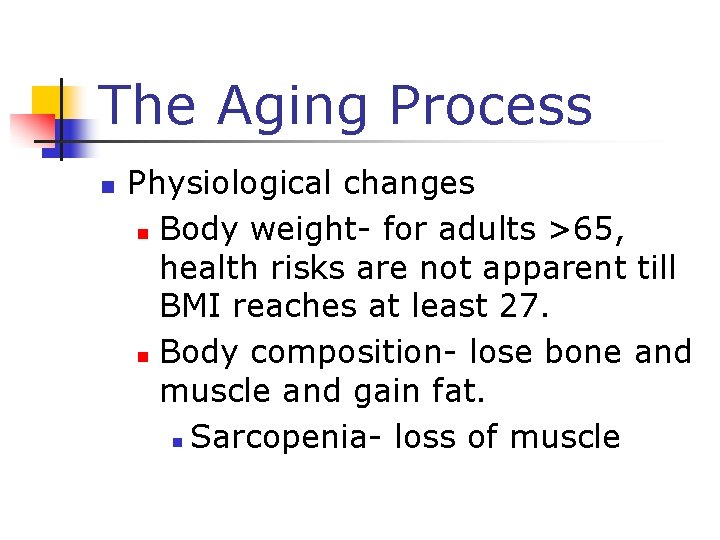
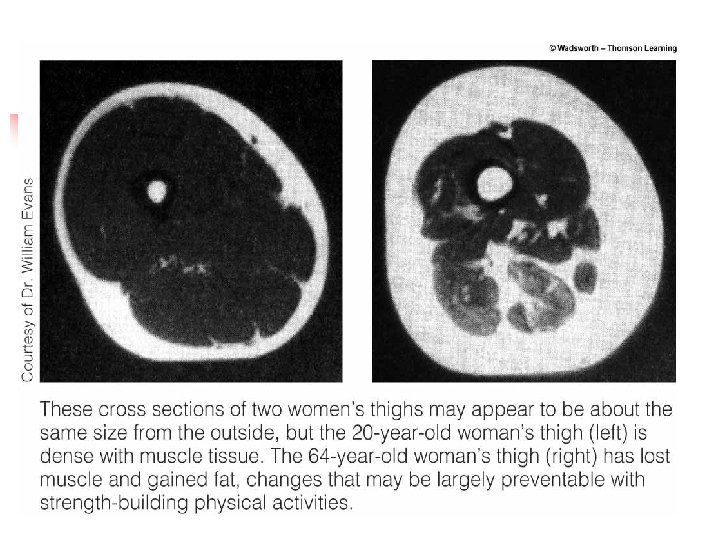
The Aging Process n Physiological changes n Body weight- for adults >65, health risks are not apparent till BMI reaches at least 27. n Body composition- lose bone and muscle and gain fat. n Sarcopenia- loss of muscle
The Aging Process n Physiological changes n Immune system – declining function and is also compromised by nutrient deficiencies. n GI tract – intestinal wall loses strength and elasticity and GI hormone secretions change. n Dysphagia – difficulty in swallowing.
The Aging Process n Physiological changes n Tooth loss –regular dental care over lifetime protects against tooth loss and gum disease. n Sensory loss and other physical problems – failing eyesight makes driving to grocery store difficult, too hard to read labels and count money.
The Aging Process n Other changes n Psychological changes – depression causes loss of ability to perform simple physical tasks. n Economic changes – poverty. n Social changes- malnutrition is common in hospitals and nursing homes.
Energy And Nutrient Needs of Older Adults n n n Water: many don’t feel thirsty or notice mouth dryness. Dehydration is a risk: more susceptible to urinary tract infections, pneumonia, pressure ulcer and confusion and disorientation. Need to drink at least 6 glasses of water a day.
Energy And Nutrient Needs of Older Adults n Energy and energy nutrients n Protein – obtained from low calorie sources of high quality protein. n Carbohydrate and fiber – need enough Cho to protect protein from being used as energy source. n Fat – intakes should be moderate.
Energy And Nutrient Needs of Older Adults n Vitamins and minerals n Vitamin B 12 – 50% have atrophic gastritis. n Vitamin D – milk is the significant source. n Calcium – low intakes. n Iron – Fe deficiency anemia is less common in older adults but can occur if food intake is low.
Nutrient supplements n n n ½ of all women >65 take some type of dietary supplement whereas 1/5 men do. May need Vitamin D, Calcium or Vitamin B 12. Food is best source of nutrients.
Nutrition-Related Concerns Of Older Adults n n n Cataracts and macular degeneration – oxidative stress plays a significant role in development of cataracts – the antioxidant nutrients may help minimize the damage. Overweight appears to be associated with cataracts – role not yet identified. Macular degeneration – deterioration of the macular region of the retina.
Nutrition-Related Concerns Of Older Adults n Arthritis n Osteoarthritis – most common. Painful deterioration of the cartilage in the joint. n Rheumatoid arthritis – possible links to diet through the immune system. n Treatment – may relieve discomfort and improve mobility but does not cure condition.
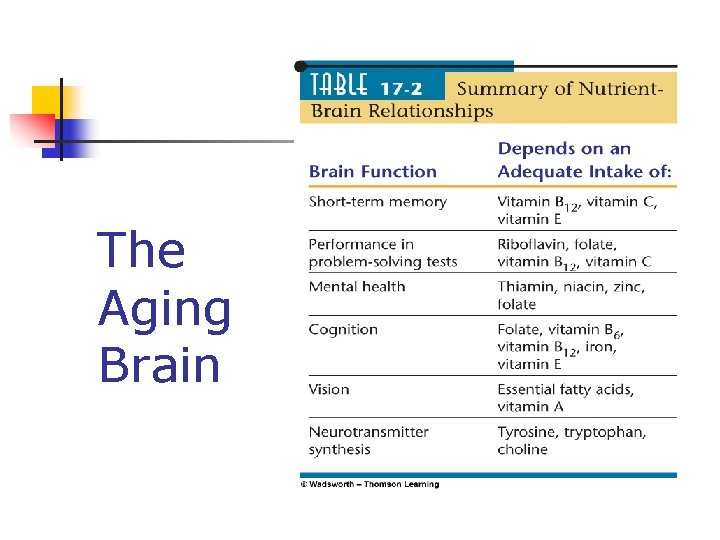
The Aging Brain
Alzheimer’s disease n n Nerve cells in the brains of people with AD show evidence of free-radical attach – damage to DNA, cell membranes and proteins. Also show evidence of minerals that trigger free-radical attacks – Fe, Copper, Zinc, and Aluminum.
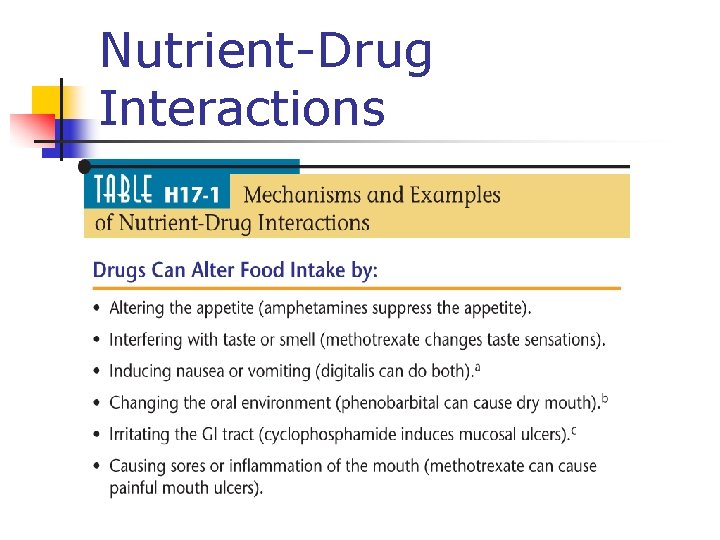
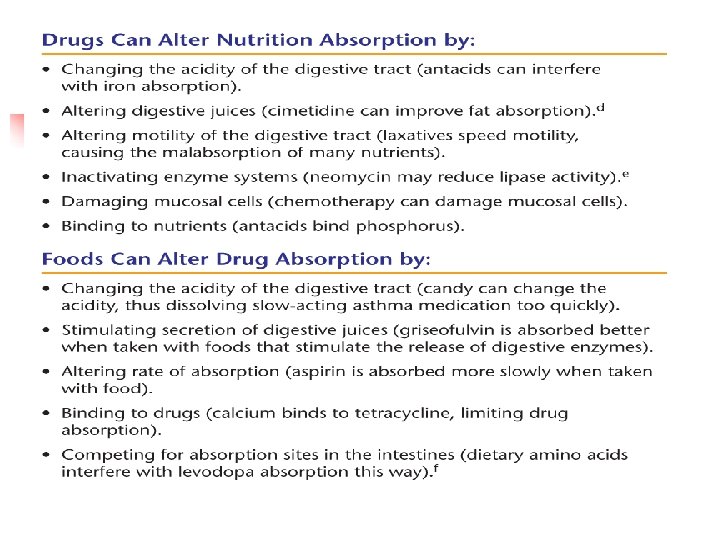
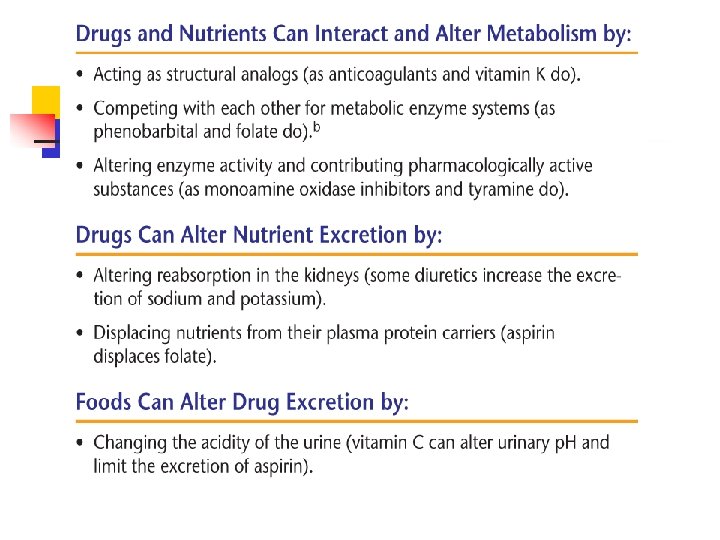
Nutrient-Drug Interactions
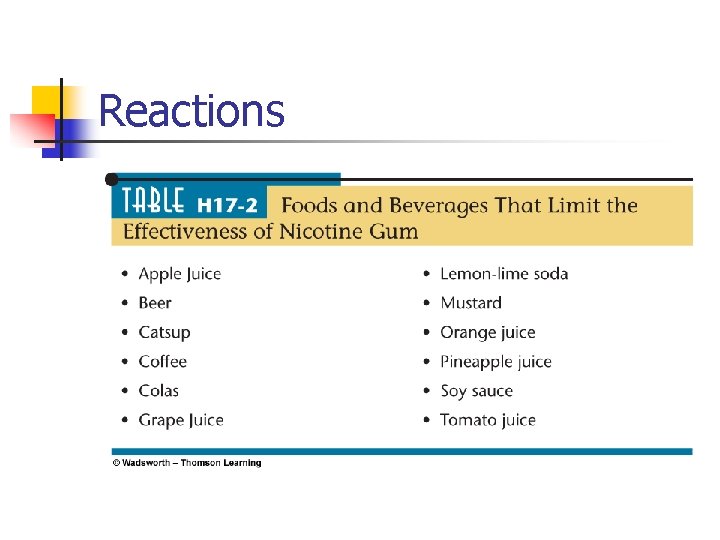
Reactions
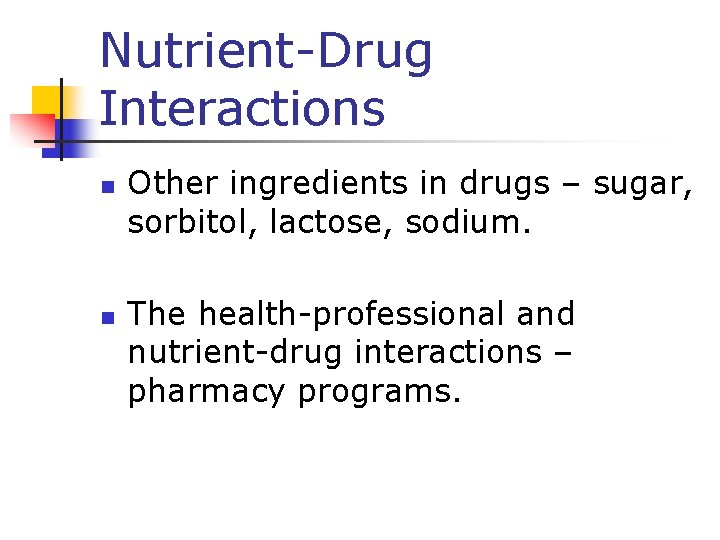
Nutrient-Drug Interactions n n Other ingredients in drugs – sugar, sorbitol, lactose, sodium. The health-professional and nutrient-drug interactions – pharmacy programs.