NUTRITION CHAPTER 7 9 Are you a breakfast

NUTRITION CHAPTER 7 -9

Are you a breakfast eater or a breakfast skipper? Improved concentration and performance in the classroom and on the athletic field More strength and endurance to engage in physical activity Better hand-eye coordination

Are you a Mc. Donald’s BIG MAC sandwich or a salad? BIG MAC calories = 550 (meal = 1030) Salad calories = 140

Are you a chip snacker or a fruit and veggie snacker? 10 chips = 105 calories on average * Empty Calories (Fat Calories) * NOT just 10!!! Fruits = 50 calories on average Vegetables = 30 calories on average * Vitamins and Minerals

Are you a soda drinker or a milk drinker? Soda = 110 calories Skim Milk = 85 calories 2% Milk = 120 calories * Stronger Bones * Reduces Osteoporosis and tooth decay Chocolate Milk = 150 calories * Good recovery drink

Benefits of Nutrition. Definitions. Nutrients – are substances in food that the body requires for proper growth, maintenance, and functioning. Malnutrition – result of serious under nutrition. Under nutrition – too little food energy or too few nutrients promote growth. Over nutrition – consuming too much food energy or excessive amounts of nutrients. Too few vegetables and too much meat. High intake of salt, fats and added sugars.

6 Classes of NUTRIENTS. Carbohydrates. Sugar and starches supply 4 calories per gram. Fiber does not supply calories. Protein. Builds body tissue and supplies energy. 4 calories per gram. Fats. Energy source for the body. 9 calories per gram.

6 Classes of NUTRIENTS. Vitamins. Required for growth and proper functioning of the body. Minerals. Required for growth and functioning. Calcium and iron. Water. Teen females – 10 cups of fluid a day. Teen males – 14 cups of fluid a day. 20% comes from the food.

My Plate = 5 food groups

Protein Go lean on protein: 5 ½ cups • • • Choose low fat or lean meats and poultry. Bake it, broil it, or grill it. Vary your choices: • Fish • Beans • Peas • Nuts • Seeds

Grains Make half your grains whole • Eat 6 ounces of: Whole grain bread • Cereal • Crackers • Rice • Pasta • Look for the “whole” before the grain name on the ingredients. •

Vegetables Vary your veggies: 2 ½ cups • Eat more dark green vegetables. • • • Eat more orange vegetables. • • Broccoli Spinach Beta Carotene Eat more dry beans and peas. • • • Black beans. Kidney beans Pinto Beans.

Fruits Focus on fruits: 2 Cups • Eat a variety of fruit. • • • Apples Cantaloupe Bananas Choose fresh, frozen, canned, or dry fruit. • • Go easy of fruit juices. • Look for 100% fruit.

Dairy Get your calcium rich foods • • • 3 cups of Dairy a day. Go low fat or fat free. Choose lactosefree products or other calcium sources. • • • Kale leaves Caned fish Soy beans

Controlling Calories – measure energy value of food. 2, 200 for ACTIVE teen females. 3, 200 for ACTIVE teen males.

Carbohydrates. Converts into blood sugar glucose. Starch – main ENERGY source. Provides Stored Foods steady supply of glucose in the body is called Glycogen. – cereals, grains, potatoes, breads, etc. Sugars Glucose - blood sugar or the body’s fuel. Fructose – natural sugar in fruits and honey. Sucrose – table sugar. Lactose – sugar in milk.

Carbohydrates. Fiber is a carb, but is not digestible by the human being. Helps maintain the health of the digestive tract. Reduces blood cholesterol and the risk of heart disease. Helps control diabetes. Helps control body fat Chew longer and fill up sooner on fewer calories. Food with skin on has more fiber. Potatoes Apples Peanut butter Pickles
. Stored")
Fats. Fuel for the body. Reserve supply of energy (after glucose is used). Stored in a layer of cells beneath the skin, in many pads of the abdomen. Insulates the body and protects it from cold temperatures.

Know your fats. SATURATED Linked to heart and artery disease. Trans fat – Processed fat. Linked to cancer. Cholesterol – fat made by the body. Ex. Bacon, butter, cheeses, lunchmeats, UNSATURATED Less associated with heart and artery disease. Polyunsaturated – fish oil Ex. Avocados, nuts, seeds, oils, peanut butter, etc.
")
Proteins. They do the cell’s work. Protein breaks down into: Amino Acids (building blocks) – your body can make. Essential Amino acids – must be eaten in foods. Chicken, milk, etc. fish, pork, beans, tofu, cheese, eggs, soy

Vitamins. Two classes of Vitamins. Fat – soluble. Able to dissolve in fat and tend to remain in the body. Can be dangerous if a person takes supplements of them. Water – soluble. Able to travel in the body’s watery fluids and leave the body readily in the urine. Need to eat foods that provide water – soluble vitamins to replace those that leave the body.

Vitamins. Fat-soluble. Vitamin A – helps with vision. Beta-carotene – orange vegetable pigment. Vitamin D – Promotes growth and healthy bones. Vitamin E – Antioxidant Vitamin K – helps with blood clotting.

Minerals. Proper body functioning. Calcium. Needed to form and maintain strong bones. Stored in bones and teeth. Osteoporosis – disease of gradual bone loss. Iron. Carries oxygen in red blood cells. Anemia cells. – reduced number or size of the red blood

Minerals. Electrolytes. Help maintain the proper balance of fluids in the body. Sodium, chloride and potassium serve as electrolytes. Nerve to nerve communication, heartbeats, and contraction of muscles are regulated by electrolytes.

Water. Carries materials in the body. 60 % of our body’s weight is water. Carries oxygen, nutrients, and waste from place to place in the body. Creates an environment in which tissues must live.

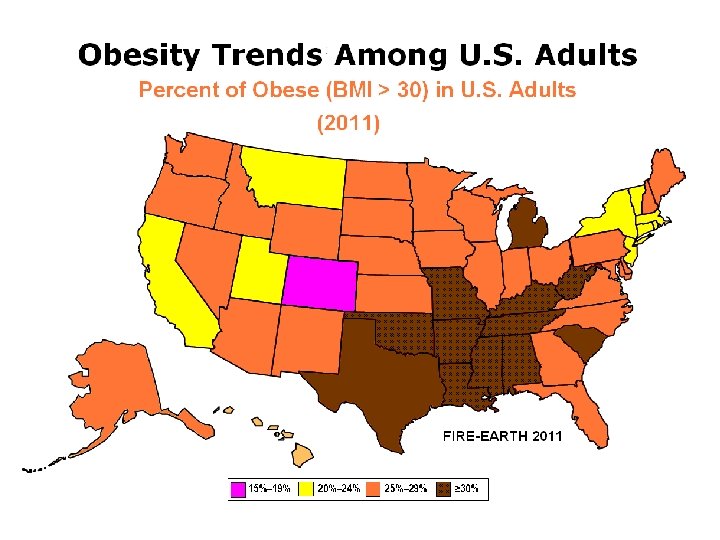
Obesity Trends* Among U. S. Adults BRFSS, 1990, 1999, 2008, 2010, 2011 (*BMI 30, or about 30 lbs. overweight for 5’ 4” person) 1999 1990 2008 2010 2011 No Data 29% <10% ≥ 30% 10%– 14% 15%– 19% 20%– 24% 25%–

Obesity Trends* Among U. S. Adults BRFSS, 1985 (*BMI ≥ 30, or ~ 30 lbs. overweight for 5’ 4” person) No Data <10% 10%– 14%

Obesity Trends* Among U. S. Adults BRFSS, 1986 (*BMI ≥ 30, or ~ 30 lbs. overweight for 5’ 4” person) No Data <10% 10%– 14%

Obesity Trends* Among U. S. Adults BRFSS, 1987 (*BMI ≥ 30, or ~ 30 lbs. overweight for 5’ 4” person) No Data <10% 10%– 14%

Obesity Trends* Among U. S. Adults BRFSS, 1988 (*BMI ≥ 30, or ~ 30 lbs. overweight for 5’ 4” person) No Data <10% 10%– 14%

Obesity Trends* Among U. S. Adults BRFSS, 1989 (*BMI ≥ 30, or ~ 30 lbs. overweight for 5’ 4” person) No Data <10% 10%– 14%

Obesity Trends* Among U. S. Adults BRFSS, 1990 (*BMI ≥ 30, or ~ 30 lbs. overweight for 5’ 4” person) No Data <10% 10%– 14%

Obesity Trends* Among U. S. Adults BRFSS, 1991 (*BMI ≥ 30, or ~ 30 lbs. overweight for 5’ 4” person) No Data <10% 10%– 14% 15%– 19%

Obesity Trends* Among U. S. Adults BRFSS, 1992 (*BMI ≥ 30, or ~ 30 lbs. overweight for 5’ 4” person) No Data <10% 10%– 14% 15%– 19%

Obesity Trends* Among U. S. Adults BRFSS, 1993 (*BMI ≥ 30, or ~ 30 lbs. overweight for 5’ 4” person) No Data <10% 10%– 14% 15%– 19%

Obesity Trends* Among U. S. Adults BRFSS, 1994 (*BMI ≥ 30, or ~ 30 lbs. overweight for 5’ 4” person) No Data <10% 10%– 14% 15%– 19%

Obesity Trends* Among U. S. Adults BRFSS, 1995 (*BMI ≥ 30, or ~ 30 lbs. overweight for 5’ 4” person) No Data <10% 10%– 14% 15%– 19%

Obesity Trends* Among U. S. Adults BRFSS, 1996 (*BMI ≥ 30, or ~ 30 lbs. overweight for 5’ 4” person) No Data <10% 10%– 14% 15%– 19%

Obesity Trends* Among U. S. Adults BRFSS, 1997 (*BMI ≥ 30, or ~ 30 lbs. overweight for 5’ 4” person) No Data <10% 10%– 14% 15%– 19% ≥ 20%

Obesity Trends* Among U. S. Adults BRFSS, 1998 (*BMI ≥ 30, or ~ 30 lbs. overweight for 5’ 4” person) No Data <10% 10%– 14% 15%– 19% ≥ 20%

Obesity Trends* Among U. S. Adults BRFSS, 1999 (*BMI ≥ 30, or ~ 30 lbs. overweight for 5’ 4” person) No Data <10% 10%– 14% 15%– 19% ≥ 20%

Obesity Trends* Among U. S. Adults BRFSS, 2000 (*BMI ≥ 30, or ~ 30 lbs. overweight for 5’ 4” person) No Data <10% 10%– 14% 15%– 19% ≥ 20%

Obesity Trends* Among U. S. Adults BRFSS, 2001 (*BMI ≥ 30, or ~ 30 lbs. overweight for 5’ 4” person) No Data <10% 10%– 14% 15%– 19% 20%– 24% ≥ 25%

Obesity Trends* Among U. S. Adults BRFSS, 2002 (*BMI ≥ 30, or ~ 30 lbs. overweight for 5’ 4” person) No Data <10% 10%– 14% 15%– 19% 20%– 24% ≥ 25%

Obesity Trends* Among U. S. Adults BRFSS, 2003 (*BMI ≥ 30, or ~ 30 lbs. overweight for 5’ 4” person) No Data <10% 10%– 14% 15%– 19% 20%– 24% ≥ 25%

Obesity Trends* Among U. S. Adults BRFSS, 2004 (*BMI ≥ 30, or ~ 30 lbs. overweight for 5’ 4” person) No Data <10% 10%– 14% 15%– 19% 20%– 24% ≥ 25%

Obesity Trends* Among U. S. Adults BRFSS, 2005 (*BMI ≥ 30, or ~ 30 lbs. overweight for 5’ 4” person) No Data <10% 29% ≥ 30% 10%– 14% 15%– 19% 20%– 24% 25%–

Obesity Trends* Among U. S. Adults BRFSS, 2006 (*BMI ≥ 30, or ~ 30 lbs. overweight for 5’ 4” person) No Data <10% 29% ≥ 30% 10%– 14% 15%– 19% 20%– 24% 25%–

Obesity Trends* Among U. S. Adults BRFSS, 2007 (*BMI ≥ 30, or ~ 30 lbs. overweight for 5’ 4” person) No Data <10% 29% ≥ 30% 10%– 14% 15%– 19% 20%– 24% 25%–

Obesity Trends* Among U. S. Adults BRFSS, 2008 (*BMI ≥ 30, or ~ 30 lbs. overweight for 5’ 4” person) No Data <10% 29% ≥ 30% 10%– 14% 15%– 19% 20%– 24% 25%–

Obesity Trends* Among U. S. Adults BRFSS, 2009 (*BMI ≥ 30, or ~ 30 lbs. overweight for 5’ 4” person)

Obesity Trends* Among U. S. Adults BRFSS, 2010 (*BMI ≥ 30, or ~ 30 lbs. overweight for 5’ 4” person) No Data ≥ 30% <10% 10%– 14% 15%– 19% 20%– 24% 25%– 29%

Obesity Trends Among U. S Adults 2013
 Micronesia Cook Islands Tonga USA (#9) Egypt (#14)")
Who’s the FATTEST? Nauru (94. 5%) Micronesia Cook Islands Tonga USA (#9) Egypt (#14) Mexico (#19)

Obesity in Pennsylvania 20 th fattest State 30. 2% Obese / 66. 5% Overweight By the year 2030 57% of Pennsylvanians will be obese.

Obesity Cost $190 billion in Health Care cost for Overweight/Obese related illnesses alone. By 2030, $550 billion will be spent. Type II Diabetes Coronary Heart Disease and Stroke Hypertension (high blood pressure) Arthritis Obesity-related Cancer
 - is a number calculated from a person's")
BMI – Body Mass Index (BMI) - is a number calculated from a person's weight and height. BMI provides a reliable indicator of body fatness for most people and is used to screen for weight categories that may lead to health problems.

Energy Balance The balance between food energy taken in and energy spent determines how much fat a person’s body stores in its fat tissues or how much it uses from storage. More simply: Energy in – Energy out = Change in fat.

ENERGY IN – calories you put in your body. For each 3, 500 calories you eat over the amount you spend, you store 1 lb of body fat. Gain 1 lb The reverse is also true: for every 3, 500 calories you spend beyond those you eat, you will use up 1 lb of body tissue as fuel. Lose 1 lb

ENERGY OUT – body spends energy Two major ways your body spends energy/calories Basal energy – energy used to support chemical activities of the cell and to sustain life. Heart beat, breathing, body temperature, etc. 1, 200 -1, 400 calories used for basal processes Physical activities – movement of the body under the command of the conscious mind. Number and size of muscles Total weight of body Length of exercise Effort/intensity level

Food Labels Pay attention to the serving size, especially how many servings there are in the food package. The number of servings you consume determines the number of calories you actually eat (your portion amount). Recommend 5% or less Get more of these (vitamins, calcium, and iron) 2 servings = 500 calories Limit these nutrients (fats, cholesterol, and sodium) 1 cup = 1 serving, but there are 2 servings in box Recommend 20% or higher Footnotes are Daily Values based of a 2, 000 or 2, 500 daily calorie intake

Continued Food Labels
- Slides: 63