Nutrition Assessment Role of Laboratory Data Liz Hudson

Nutrition Assessment: Role of Laboratory Data Liz Hudson MPH, RD September, 21 st 2016

Laboratory Assessment and Nutrition Care Process • Objective measure: diagnose diseases, support nutrition diagnoses, monitor medication effectiveness, and evaluate NCP interventions – Many things are involved with interpretation • • • Age Pt condition Medical condition Hydration Status Fasting status • Interpretation with regard to nutrition can be tricky, but is essential for the nutrition expert
 is a medical model")
Biomarkers: Next big thing or buzzword? • “Precision medicine: (PM) is a medical model that proposes the customization of healthcare, with medical decisions, practices, and/or products being tailored to the individual patient. ” wikipedia https: //en. wikipedia. org/wiki/Precision_medicine • Biomarkers: often not that easy to interpret – Not necessarily a better measure of what you are doing than just asking the person

Definition of Specimen Types • Whole blood: Used when entire content of blood is to be evaluated – no elements are removed • Serum: The fluid obtained from blood after the blood has been clotted and then centrifuged to remove the clot and blood cells • Plasma: liquid component of blood (water, blood proteins, inorganic electrolytes, clotting factors) • Erythrocytes: red blood cells • Leukocytes: white blood cells • Other tissues: scrapings and biopsy samples • Urine: random samples or timed collections • Feces: random samples or timed collections • Less common: saliva, nails, hair, sweat, breath tests

Interpretation of Routine Medical Laboratory Tests • Clinical chemistry panels – Basic Metabolic Panel – Comprehensive Metabolic Panel • • • Complete Blood Count Urinanalysis Hydration Status Serum Proteins Vitamin D

Clinical Chemistry Panels • Basic Metabolic Panel – – – – Glucose Calcium Sodium Potassium CO 2 (bicarbonate) Chloride BUN (blood urea nitrogen) Creatinine • Comprehensive Metabolic Panel – – – – Glucose Calcium Sodium Potassium CO 2 (bicarbonate) Chloride BUN (blood urea nitrogen) Creatinine Albumin Total Protein ALP ALT AST Bilirubin

Examples
: 136 to 144 m. Eq/L – Hyponatremia:")
Considerations regarding interpretation: Electrolytes • Sodium (Na): 136 to 144 m. Eq/L – Hyponatremia: most common electrolyte abnormality in hospitalized patients • Usually caused by excessive hypotonic IV fluid intake and/or gastrointestinal losses of sodium-rich fluids (gastric suctioning, diarrhea, high ileostomy output) • High serum glucose concentrations increase plasma osmolality to cause fluid shift from intracellular space to plasma – resulting in hyponatremia – Hypernatremia: commonly the result of impaired water intake or relative water deficit

Considerations regarding interpretation: Electrolytes • Potassium: 3. 5 -5 m. Eq/L (minimally affected by diet) • Hypokalemia: decreases can be seen in excessive GI losses (diarrhea), intracellular shift during refeeding, medications (loop and thiazide diuretics increase K+ losses) • Hyperkalemia: decreased kidney function, medications (potassium-sparing diuretics, cyclosporine, tacrolimus)

Considerations regarding interpretation: Electrolytes • Acid base disorders are usually caused by the patient’s underlying diseases and clinical condition(s) • Chloride: 100 -110 m. Eq/L – Hyperchloremic acidosis: may result from large and rapid infusion of normal saline fluids or significant bicarbonate losses from intestines or kidneys (can cause chloride retention) • Bicarbonate or total Co 2: 21 -30 m. Eq/L – Metabolic alkalosis (increase in bicarbonate): prolonged vomiting, high gastric fluid suctioning, potassium wasting diuretic use
: 7 -20 mg/d. L –")
Considerations regarding interpretation: Electrolytes • Blood Urea Nitrogen (BUN): 7 -20 mg/d. L – Increased in kidney disease, dehydration, excessive protein catabolism – Decreased in liver failure, negative nitrogen balance, pregnancy (2 nd or 3 rd trimester) • Creatinine: 0. 6 -1. 2 mg/d. L – Increased in: poor kidney function – Decreased in: malnutrition

Considerations regarding interpretation: Electrolytes • Calcium: 8. 6 -10 mg/d. L. Serum levels related to many factors – Hypocalcemia: 45% of serum calcium is bound to serum albumin. A one gram decrease in serum albumin results in ~. 8 mg decrease in serum calcium • Corrected calcium: measured serum calcium + 0. 8 (4 -serum albumin) • Ionized calcium (free calcium) is better measure of calcium status when albumin levels are low – Hypercalcemia: rarely caused by excess calcium intake • Common causes: malignancies, hyperparathyroidism, immobilization

Corrected Calcium • Serum Calcium = 8. 1 • Serum Albumin = 3. 0 • Corrected Calcium = 8. 1 + 0. 8 (4. 0 -3. 0) = 8. 9
 • Serum phos")
Considerations regarding interpretation: phosphorus (normal: 2. 7 -4. 5 mg/d. L) • Serum phos a poor reflection of body stores because <1% is in ECF • Bones serve as a reservoir • Hypophosphatemia: <2. 7 mg/d. L • Impaired absorption (diarrhea, Vitamin D deficiency, impaired metabolism) • Medications: phosphate binding antacids, sucralfate, insulin, corticosteroids) • Alcoholism, especially during withdrawal • Intracellular shifts such as in refeeding syndrome • Increased losses: hyperparathyroidism, DKA recovery, hypomagnesemia

Hyperphosphatemia • >4. 5 mg/d. L • Decreased renal excretion: acute or chronic renal failure; hypoparathyroidism – Sign of excessive dietary intake in patients on hemodialysis • Increased cellular release: tissue necrosis, tumor lysis syndrome • Increased exogenous phosphorus load or absorption, phosphorus containing laxatives or enemas, vitamin D excess
 • Magnesium homeostasis is maintained by")
Magnesium (normal: 1. 3 -2. 5 m. Eq/L) • Magnesium homeostasis is maintained by the intestines, bone and the kidneys. • Hypermagnesemia: decreased kidney function cause magnesium accumulation • Hypomagnesemia: common causes include diarrhea, high ileostomy fluid losses, medications (loop and thiazide diuretics, immunosuppressants) – Adequate correction of hypomagnesemia essential for correction of hypokalemia
 • • Red blood cells Hemoglobin concentration")
Clinical Chemistry Panels: Complete Blood Count (CBC) • • Red blood cells Hemoglobin concentration Hematocrit Mean cell volume (MCV) Mean cell hemoglobin (MCH) Mean cell hemoglobin concentration (MCHC) White blood cell count (WBC) Differential: indicates percentages of different kinds of WBC

Example of CBC

Laboratory Data to assess for nutritional anemias • Classification of Anemia need to distinguish • Iron deficiency anemia – Microcytic anemia: most often association with true iron deficiency • Important discriminating features are a low serum ferritin concentration, an increased total iron binding capacity (transferrin), and low serum iron concentration – Macrocyctic anemia: generally due to deficient utilization of folate or B 12 by the blood cells • Pernicious anemia: not enough red blood cells due to lack of B 12 • Megaloblastic anemia: folate deficiency • Anemia of chronic disease: (normocystic) does not respond to iron supplementation

Tests for Iron Deficiency Anemias • Hemoglobin and hematocrit: below normal in all nutritional anemias. – Not sensitive for iron, vitamin B 12, or folate deficiencies – Are sensitive to hydration status • Serum Ferritin: Primary intracellular Fe-storage, serum levels parallel iron stores – Increases during inflammatory response even when iron stores are not adequate – Not useful in anemia of chronic disease • Serum Iron: reflects recent iron intake, very insensitive index of total iron stores • Total Iron Binding Capacity (TIBC): – Increases when iron stores are depleted • Transferrin Saturation: decreased when iron stores depleted; low vitamin B 6 and low transferrin saturation seen in aplastic anemia

Tests for Macrocytic Anemias from B vitamin Deficiencies • Folate and B 12 tests are not sensitive or specific to actual levels • Mean corpuscular volume or mean cell volume (MCV) is the average volume of red cells. – Decreased in iron deficiency – Increased in setting of vitamin B 12 or folate deficiency


Urinanalysis • Screening or diagnostic tool to detect substances or cellular material in the urine associated with different metabolic and kidney disorders • Often involves visual examination, dipstick test, and microscopic examination
: Abnormal p. H levels may indicate a kidney")
Urinanalysis • • Acidity (p. H): Abnormal p. H levels may indicate a kidney or urinary tract disorder. Concentration. A measure of concentration, or specific gravity, shows how concentrated particles are in your urine. Higher than normal concentration often is a result of not drinking enough fluids. Protein: larger amounts may indicate a kidney problem. Sugar: Any detection of sugar on this test usually calls for follow-up testing for diabetes. Ketones: Positive in poorly controlled DM, fever, anorexia, starvation Bilirubin: product of red blood cell breakdown. Bilirubin in urine may indicate liver damage or disease. Evidence of infection: If either nitrites or leukocyte esterase — a product of white blood cells — is detected in your urine, it may be a sign of a urinary tract infection Blood: it may be a sign of kidney damage, infection, kidney or bladder stones, kidney or bladder cancer, or blood disorders

Types of Assays • Static assays: measures the actual level of the nutrient in the specimen (serum iron, white blood cell ascorbic acid) – Do not reflect the amount of that substance stored in the body – Highly influenced by recent dietary intake • Functional Assays: measure a biochemical or physiological activity that depends on the nutrient of interest (serum ferritin, TIBC) – Functional assays are not always specific to the nutrient (many biologic and physiologic functions involved)

Assessment of Hydration Status: two main fluid compartments • Total body water: fluid that occupies the intracellular and extracellular spaces • Intracellular fluid compartment: fluid within the cells of the body (~2/3) • Extracellular fluid compartment: Body’s internal environment and the cell’s external environment (~1/3) – 2 parts: interstitial fluid and plasma • Interstitial fluid: fluid in the spaces between cells • Plasma: fluid portion of the blood


Assessment of hydration status • The distribution of body water varies under different circumstances usually remains fairly constant • Water consumed during the day (food, drink) is balanced by water lost (urination, perspiration, feces, respiration)

General Principles of disorders of water balance • Disorders of water balance and sodium balance are common, but the pathophysiology is frequently misunderstood • Example: plasma sodium concentration is regulated by changes in water intake and excretion, not by changes in sodium balance.

General Principles of disorders of water balance • hyponatremia is primarily due to the intake of water that cannot be excreted (too much water or overhydration) • hypernatremia is primarily due to the loss of water that has not been replaced • hypovolemia represents the loss of sodium and water • edema is primarily due to sodium and water retention

Hydration Status • Dehydration is defined as a reduction in TBW below the normal level without a proportional reduction in sodium and potassium, resulting in a rise in the plasma sodium concentration • Hyponatremia (too much water) • Hypernatremia (too little water) • Hypovolemia (too little sodium, the main extracellular solute) • Edema (too much sodium with associated water retention)

Hypovolemia • In a variety of clinical disorders, fluid losses reduce extracellular fluid volume, potentially compromising tissue perfusion • Volume depletion results from loss of sodium and water from the following anatomic sites: – Gastrointestinal losses, including vomiting, diarrhea, bleeding, and external drainage – Renal losses, including the effects of diuretics, osmotic diuresis, salt-wasting nephropathies, and hypoaldosteronism – Skin losses, including sweat, burns, and other dermatological conditions – Third-space sequestration, including intestinal obstruction, crush injury, fracture, and acute pancreatitis
 • Edema is defined as a palpable swelling produced by expansion of")
Edema (hypervolemia) • Edema is defined as a palpable swelling produced by expansion of the interstitial fluid volume. A variety of clinical conditions are associated with the development of edema – heart failure – Cirrhosis – nephrotic syndrome

Edema • An increase in interstitial fluid volume that could lead to edema does not occur in normal subjects because of the tight balance of hemodynamic forces along the capillary wall and the function of the lymphatic vessels. For generalized edema to occur, two factors must be present: – An alteration in capillary hemodynamics that favors the movement of fluid from the vascular space into the interstitium – The retention of dietary or intravenously administered sodium and water by the kidneys

Laboratory Values and Hydration: BUN Lab Test Hypovolemia Hypervolemia Other factors influencing result BUN Increases Decreases Low: inadequate dietary protein, severe liver Normal: failure 10 -20 High: pre-renal failure; mg/dl excessive protein intake, GI bleeding, catabolic state; glucocorticoid therapy Creatinine will also rise in severe hypovolemia Adapted from Charney and Malone. ADA Pocket Guide to Nutrition Assessment, 2004.

Laboratory Values and Hydration Status Lab Test Hypovolemia Hyper- Other factors influencing volemia result Serum albumin Low: acute phase response, liver failure Serum sodium Can be high, normal, or low , normal or Serum sodium generally reflects fluid status and not sodium balance Adapted from Charney and Malone. ADA Pocket Guide to Nutrition Assessment, 2004.

Serum Proteins as Markers of Nutritional Status • Albumin, prealbumin, transferrin, and retinol binding protein synthesized in the liver and integrate protein synthesis and degradation over longer periods of time • Traditionally used as part of the nutritional assessment, even part of our malnutrition diagnostic criteria (prealbumin) • These levels are not indicative of patient’s protein status and thus are not appropriate to use to as an indicator of nutritional status • https: //www. pathology. med. umich. edu/handbook/

Albumin Majority of the body’s albumin is distributed between the vascular and interstitial spaces • more than 50% is located extravascularly (outside of the blood vessels) Very little of the body’s albumin pool is • protein intake has very little effect on comprised of newly total albumin on a daily basis synthesized albumin Many factors affect serum albumin levels • Hydration status being a major factor

Albumin: Negative Acute Phase Protein • Increased in: – – Dehydration Marasmus Blood transfusions Exogenous albumin • Decreased in: – – – – – Fluid overload/ascites Hepatic failure CHF Protein losing states Nephrotic syndrome Inflammation/infection/me tabolic stress Burns/trauma/post-op Kwashiokor Cancer Corticosteroid use

Prealbumin Like albumin visceral protein and a negative acute phase reactant Initially thought to be a better marker of nutritional status compared to albumin due to shorter half-life • More indicative of current nutritional status? Levels are often normal in chronically malnourished patients, including in the setting of anorexia nervosa Levels are often decreased in well-nourished persons who have undergone a recent stress or trauma (s/p surgery)
 • Corticosteroid")
Factors Affecting Prealbumin Increased in: • Renal failure (degraded by the kidney) • Corticosteroid use • Oral Contraceptives Decreased in: • Post-operative • Liver disease • Infection/Stress/inflammation • What positive acute phase reactant might be checked in conjunction with PAB? • Dialysis • Significant hyperglycemia • Zinc deficiency

Studies • There have been many randomized, interventional and prospective studies that have demonstrated a poor relationship between serum protein levels and nutritional status • Decreased protein energy intake has not been consistent with decreased serum protein, same is true for increase protein-energy intake • Patients with anorexia nervosa, in whom malnutrition is indisputable, have normal levels of serum proteins • Well nourished individuals s/p stress/trauma/infection will often have low levels of serum protein

Take-home message Serum protein markers are not specific or sensitive indicators of nutritional status Greatly influenced by the inflammatory response Levels are often maintained in a chronic malnourished state, and decreased in well-nourished individuals who have experienced a recent stress or trauma
 The best laboratory indicator of vitamin")
Vitamin D • 25 HD (25 -Hydroxyvitamin D) The best laboratory indicator of vitamin D • Vitamin D deficiency: < 20 ng/m. L • Vitamin D insufficiency: < 30 ng/m. L • Vitamin D toxicity: > 150 ng/m. L • Optimal serum 25 HD levels: 30 – 80 ng/m. L

What is fueling this demand for vitamin D testing? Vitamin D deficiency is a worldwide epidemic! • Most recent NHANES analyzed data only 23% of US adolescents and adults had serum levels >30 ng/m. L • The mean concentration of vitamin D across the world is ~20 ng/dl deficient • More variation within countries than between countries Persistent headlines linking a multitude of benefits with adequate vitamin D 1. 2. Looker AC, Johnson CL, Lacher DA, et al. Vitamin D status: United States 2001– 2006. NCHS data brief, no 59. Hyattsville, MD: National Center for Health Statistics. 2011. Bouillon R. Lancet. 2010 Jul 17; 376(9736): 148 -9. doi: 10. 1016/S 0140 -6736(10)60635 -6. Epub 2010 Jun 10

Research behind the health claims Strong research showing consistent benefits of vitamin D supplementation is lacking Vitamin D as an exposure – is difficult to control (comparing groups becomes difficult) Many studies are observational in design • Does high dose vitamin D make people healthier – or do healthier people do the sorts of things that raise their vitamin D?

What’s in a level? • What came first – disease or deficiency

Consensus is…. . there is no consensus Adults who do not have regular effective sun exposure year round should consume at least 600 to 800 international units (units) of vitamin D 3 (cholecalciferol) daily High risk groups may require more

IOM Conclusion • “Scientific evidence indicates that calcium and vitamin D play key roles in bone health. The current evidence, however, does not support other benefits for vitamin D or calcium intake. More targeted research should continue. Higher levels have not been shown to confer greater benefits, and in fact, they have been linked to other health problems, challenging the concept that ‘more is better’. ” • The evidence supporting a benefit of vitamin D on extraskeletal outcomes was inconsistent, inconclusive as to causality, and insufficient, and therefore could not serve as a basis for dietary reference intake development 1. 2. Dietary Reference Intakes for Calcium and Vitamin D. Institute of Medicine Report Brief. November 2010. Dawson-Hughes, B. Vitamin D deficiency in adults: Definition, clinical manifestations, and treatment. Up. To. Date. May 02, 2016.
D concentration of 20 ng/m. L")
Vitamin D The IOM concluded that a serum 25(OH)D concentration of 20 ng/m. L (50 nmol/L) is sufficient for most individuals • Most people have adequate amounts of vitamin D in the blood supplied by their diets and natural sources like the sun, for most people taking extra calcium and vitamin D is not warranted What does this mean for health practitioners who don’t deal with most people? 1. Dietary Reference Intakes for Calcium and Vitamin D. Institute of Medicine Report Brief. November 2010.

Is this precision medicine? • Vitamin D deficiency: < 20 ng/m. L • Vitamin D insufficiency: < 30 ng/m. L • Vitamin D toxicity: > 150 ng/m. L • Optimal serum 25 HD levels: 30 – 80 ng/m. L Sandra Bouma RD, MS S: SharedRestrictedNutrition Services ClinicalResources and ReferencesTreating Vitamin D insufficiency - both. doc 5/10/2016

Consult the Dietitian! • Combining lab value data and a comprehensive nutrition assessment can help guide appropriate next steps • Need to take into account – sun exposure • Sunscreen use – Dietary intake of foods rich in vitamin D or fortified with vitamin D • Cold water fish intake • Fortified dairy and other – Replace then maintain – May not need as much as we think

Dietary Sources of Vitamin D Nutrient Profile Cow’s Milk Calories per 8 oz 150 Protein (grams) per 8 oz Fat (grams) per 8 oz Soy Milk (Original) Soy Milk (vanilla) Almond Milk (chocolate) Rice Milk Coconut (vanilla) Milk Oat Milk Hemp Milk 110 100 60 80 120 130 80 130 70 8 8 6 1 1 1 0 4 3 8 4. 5 3. 5 2. 5 3 2. 5 5 Calcium (mg) per 8 oz 300 450 450 450 300 Vitamin D (IU) per 8 oz ~100 -125 120 100 100 100 120

Other Considerations: screening • Skin pigmentation – (97% of African Americans in the US are considered deficient) • Obese • Hospitalized or Institutionalized persons • Limited effective sun exposure due to protective clothing or consistent use of sun screens • Osteoporosis • Malabsorptive condition – Such as including inflammatory bowel disease and celiac disease

Take Home Message What does it really mean to be “deficient” or “insufficient” with regard to vitamin D status? • Do we know? Is it different for everyone? Proceed with caution and look at the entire clinical picture

Energy Expenditure: Predictive Equations • Objectives: • Compare/contrast predictive equations used to calculate energy requirements • Discuss the strengths and limitations of various predictive equations used in clinical practice • Describe the role of indirect calorimetry (IC) in assessing energy expenditure
 Resting metabolic rate (RMR)")
Review of Terminology • • • Basal metabolic rate (BMR) Resting metabolic rate (RMR) Resting energy expenditure (REE) Estimated energy expenditure (EEE) Total energy expenditure (TEE)

Predictive Equations • So many choices….
")
Harris-Benedict Equation • Basal energy expenditure – Men: BEE= 66. 47 + 13. 75(W) + 5(H) – 6. 75(A) – Women: BEE = 655. 09+9. 56(W)+1. 85(H)– 4. 68(A) • Activity factors • Stress/injury factors W=weight in kg; H=height in cm; A=age in years
 + 6.")
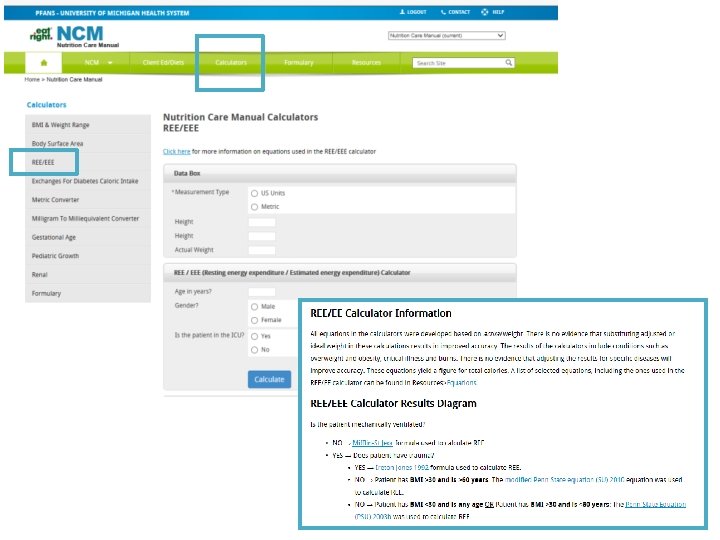
Mifflin-St. Jeor Equation • Resting metabolic rate – Men: RMR = 10(W) + 6. 25(H) – 5(A) + 5 – Women: RMR = 10(W) + 6. 25(H) – 5(A) -161 • Activity factors • Stress/injury factors • TEE = REE x AF (study or population-specific activity factor) W=actual weight in kg; H=height in cm; A=age in years

• • • Activity factors Comatose: 1. 1 Confined to bed: 1. 2 Out of bed: 1. 3 Normal activities of daily living (ADLs): 1. 5 • • Injury factors Surgery: Minor: 1. 0– 1. 2 Major: 1. 1– 1. 3 Skeletal trauma: 1. 1– 1. 6 Head trauma: 1. 6– 1. 8 Infection: – Mild: 1. 0– 1. 2 – Moderate: 1. 2– 1. 4 – Severe: 1. 4– 1. 8 • Burns (% body surface area [BSA]): – <20% BSA: 1. 2– 1. 5 – 20%– 40% BSA: 1. 5– 1. 8 – >40% BSA: 1. 8– 2. 0
 15 -18 kcal/kg (obese/overweight) 22 -25 kcal/kg")
Simplistic Weight-Based Equations 11 -14 kcal/kg (obesity) 15 -18 kcal/kg (obese/overweight) 22 -25 kcal/kg (normal, healthy weight) 25 -30 kcal/kg (underweight, or have increased needs) • 30 -35 kcal/kg (underweight, higher degree of increased needs, hematologic malignancy) • 40+ kcal/kg (increased needs, weight gain) • •
 – 6.")
Critical Illness—Non-obese: Swinamer equation • Resting energy expenditure – REE = 945(BSA) – 6. 4(Age) + 108(Tmax) + 24(RR) + 817(VT)– 4349 BSA=body surface area in m 2; A=age in years; Tmax=degrees Celsius; RR=respiratory rate in breaths/min; VT=tidal volume in liters

Critical Illness— obese and Non-obese: Penn State Equation • Resting metabolic rate – 2003 a (non-obese) • RMR = BMR(0. 85) + VE(33) + Tmax(175) – 6433 – 2003 b (obese) • RMR = BMR(0. 96) + VE(31) + Tmax(167) – 6212 BMR calculated using the HBE or MSJ equation; VE=minute ventilation in liters per minute; Tmax=degrees Celsius
 • Estimated energy expenditure – Ventilator-dependent")
Critical Illness— Mechanically Ventilated, Obese: Ireton-Jones Equation (1992) • Estimated energy expenditure – Ventilator-dependent patients: • EEE = 1925 + 5(W) – 10(A) + 281(S) + 292(T) + 851(B) – Obese patients: • EEE = 1444 + 606(S) + 9(Q=W) – 12(A) + 400(V) A=age in years; W=actual weight in kg; V=ventilated (0=absent, 1=present); S=sex (0=female, 1=male); T=trauma (0=absent, 1=present)

Indirect Calorimetry IC measures the volume of inspired oxygen and expired carbon dioxide to determine VO 2 and VCO 2 to calculate resting energy expenditure (REE) and respiratory quotient (RQ).

Indications for IC • Inability to accurately estimate energy requirements • Inadequate clinical response to nutrition therapy

Inability to Accurately Estimate Energy Requirements • • Trauma SIRS/fever MODS ARDS COPD Paralysis Altered body composition: – Underweight – Obesity – Alterations in fluid balance • Wounds • Paralytics • Sedation

Inadequate Clinical Response to Nutrition Therapy • Malnutrition despite “adequate” nutrition support • Poor wound healing • Failure to wean from mechanical ventilation – Underfeeding vs. overfeeding

• Review table in NCM
- Slides: 72