
Nutrients and Microbial Communities in Extreme Environments Christie

Nutrients and Microbial Communities in Extreme Environments Christie Sabin Mentors: Amisha Poret-Peterson Ariel Anbar University of Arizona April 21, 2012

OUTLINE 1. Introduction 2. Methods 3. Results 4. Summary 5. Future Work
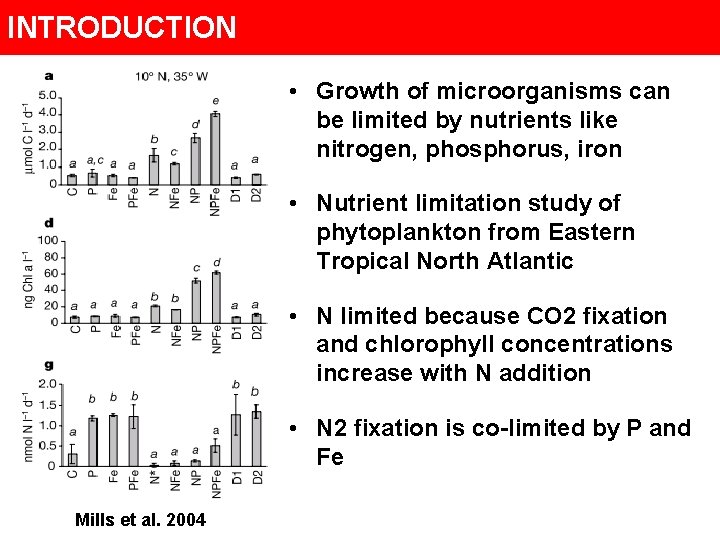
INTRODUCTION • Growth of microorganisms can be limited by nutrients like nitrogen, phosphorus, iron • Nutrient limitation study of phytoplankton from Eastern Tropical North Atlantic • N limited because CO 2 fixation and chlorophyll concentrations increase with N addition • N 2 fixation is co-limited by P and Fe Mills et al. 2004
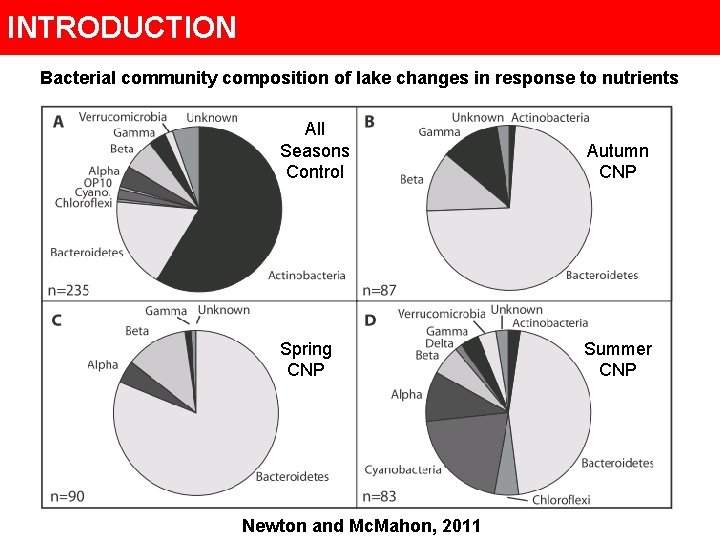
INTRODUCTION Bacterial community composition of lake changes in response to nutrients All Seasons Control Autumn CNP Spring CNP Summer CNP Newton and Mc. Mahon, 2011
INTRODUCTION Objective of this project is to profile hot spring microbial communities before and after addition of nitrogen, phosphorus, and iron using T-RFLP analysis (Terminal Restriction Fragment Length Polymorphism) quantitative PCR (q. PCR) analysis of 16 S r. RNA genes and
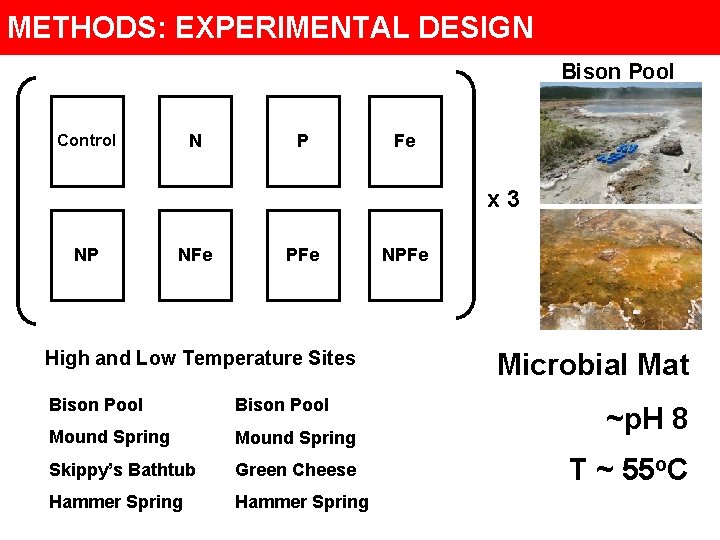
METHODS: EXPERIMENTAL DESIGN Bison Pool Control N P Fe x 3 NP NFe PFe High and Low Temperature Sites Bison Pool Mound Spring Skippy’s Bathtub Green Cheese Hammer Spring NPFe Microbial Mat ~p. H 8 T ~ 55 o. C
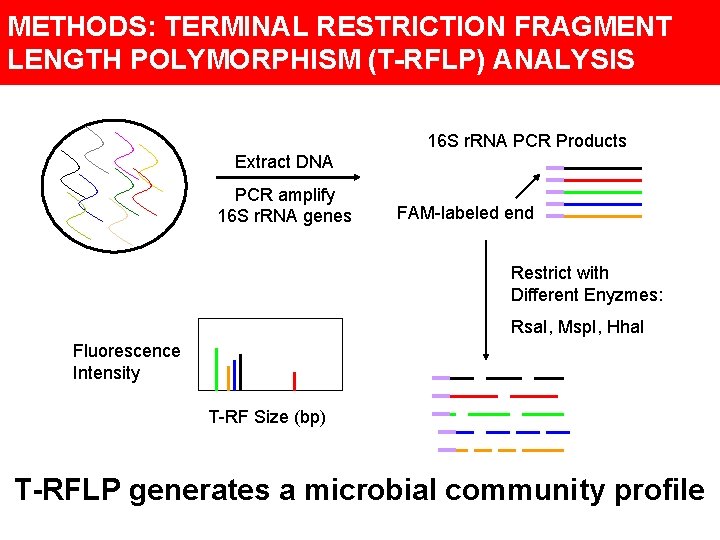
METHODS: TERMINAL RESTRICTION FRAGMENT LENGTH POLYMORPHISM (T-RFLP) ANALYSIS 16 S r. RNA PCR Products Extract DNA PCR amplify 16 S r. RNA genes FAM-labeled end Restrict with Different Enyzmes: Rsa. I, Msp. I, Hha. I Fluorescence Intensity T-RF Size (bp) T-RFLP generates a microbial community profile
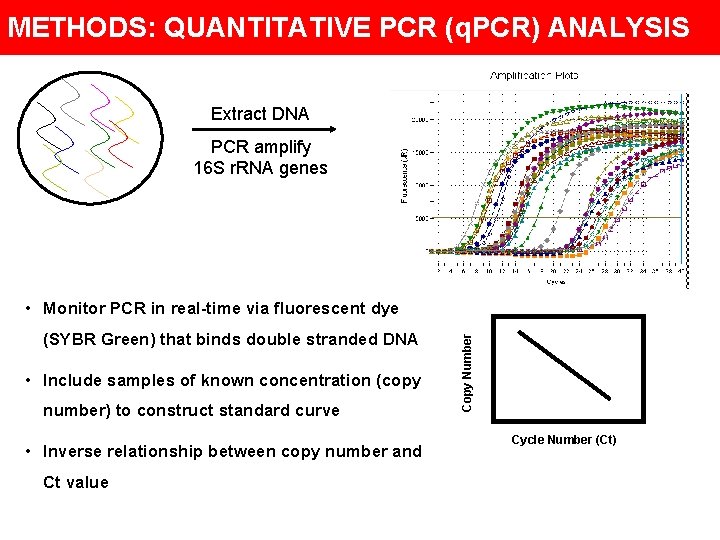
METHODS: QUANTITATIVE PCR (q. PCR) ANALYSIS Extract DNA PCR amplify 16 S r. RNA genes (SYBR Green) that binds double stranded DNA • Include samples of known concentration (copy number) to construct standard curve • Inverse relationship between copy number and Ct value Copy Number • Monitor PCR in real-time via fluorescent dye Cycle Number (Ct)
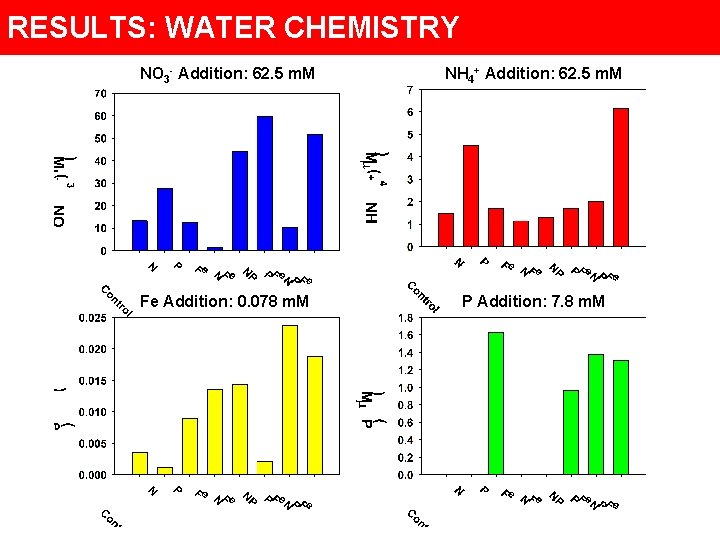
RESULTS: WATER CHEMISTRY NO 3 - Addition: 62. 5 m. M NH 4+ Addition: 62. 5 m. M Fe Addition: 0. 078 m. M P Addition: 7. 8 m. M
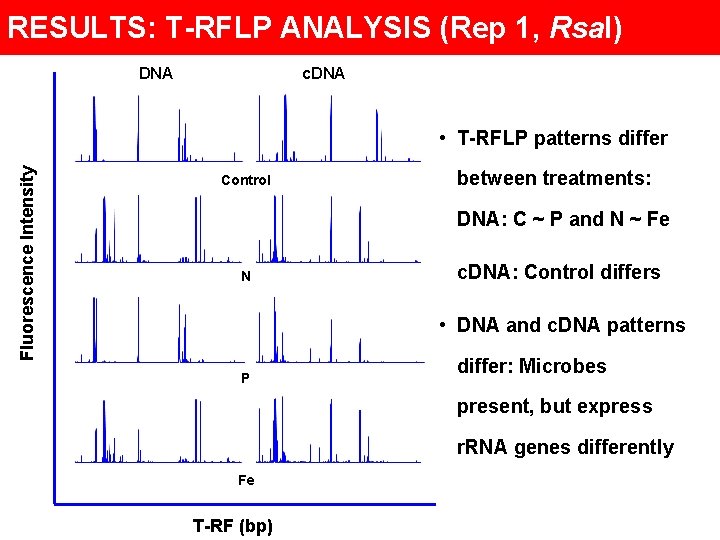
RESULTS: T-RFLP ANALYSIS (Rep 1, Rsa. I) DNA c. DNA Fluorescence Intensity • T-RFLP patterns differ Control between treatments: DNA: C ~ P and N ~ Fe N c. DNA: Control differs • DNA and c. DNA patterns P differ: Microbes present, but express r. RNA genes differently Fe T-RF (bp)
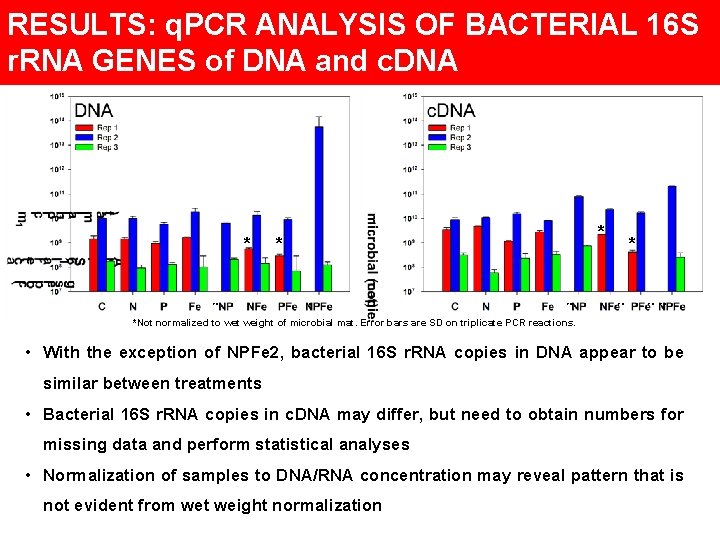
RESULTS: q. PCR ANALYSIS OF BACTERIAL 16 S r. RNA GENES of DNA and c. DNA * n. d. * * n. d. *Not normalized to wet weight of microbial mat. Error bars are SD on triplicate PCR reactions. • With the exception of NPFe 2, bacterial 16 S r. RNA copies in DNA appear to be similar between treatments • Bacterial 16 S r. RNA copies in c. DNA may differ, but need to obtain numbers for missing data and perform statistical analyses • Normalization of samples to DNA/RNA concentration may reveal pattern that is not evident from wet weight normalization
FUTURE WORK • Obtain missing data (DNA/RNA extraction, c. DNA synthesis, PCRs, T-RFLP and q. PCR analyses) • Repeat steps using archaeal primers • Analyze all DNA and c. DNA bacterial 16 S r. RNA TRFLPs and q. PCR data • In depth analysis of T-RFLPs, 16 S r. RNA gene copy number, and water chemistry to assess extent of microbial community composition changes in response to nutrient addition

ACKNOWLEDGEMENTS • Marcia Kyle • Amisha Poret-Peterson • Jessica Corman • Zuri Martinez • James Elser • Ariel Anbar • Alisa Glukhova
- Slides: 13