Nutrient Inventory and Storage and Handling Planner Training
 John W. Worley")


 u Manure shipped off farm u.")
 u Slurry Systems")

")
 – Reduce Land Application")


 – – When built, Who")


")


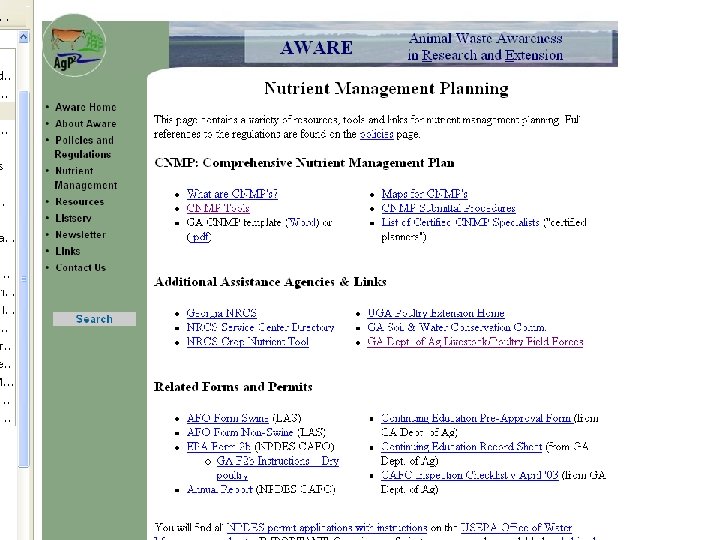
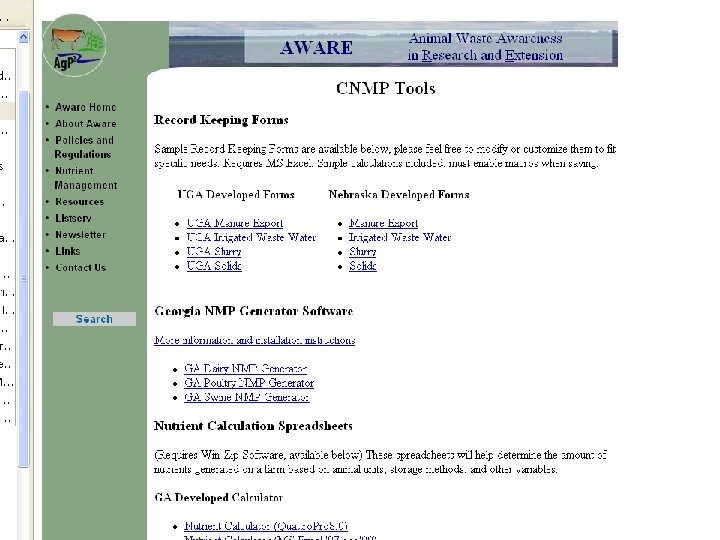
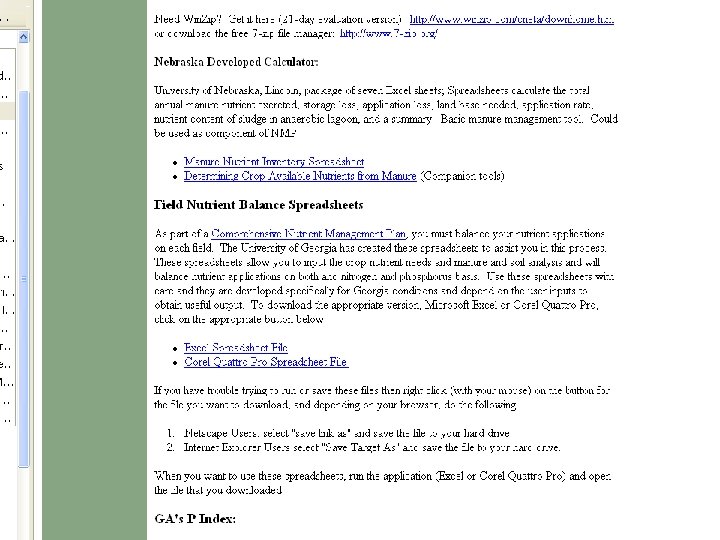
 u Software has been developed to aid in development of CNMP")


- Slides: 50
Nutrient Inventory and Storage and Handling (Planner Training) John W. Worley
Times Have Changed!
Or Have They? George Washington’s Compost Facility
Goal u Balance Imports with Exports
ARE INPUTS & OUTPUTS IN BALANCE Water In Water Out 1 gal. Farm Pond 1 gal.
ARE INPUTS & OUTPUTS IN BALANCE Water In Water Out 2 gal. Farm Pond 1 gal.
ARE INPUTS & OUTPUTS IN BALANCE Water In Water Out 2 gal. Farm Pond 1 gal.
ARE INPUTS & OUTPUTS IN BALANCE Water In Water Out 1 gal. 2 gal. Farm Pond 1 gal.
Water In Plugging the Leaks… Temporary Solution to Imbalance 2 gal. Sand Bags Farm Pond Water Out 1 gal.
Strategies to Reduce Waste u More closely balance feed nutrients to animal needs – Nitrogen comes from feed protein – Phosphorus comes from ingredients + mineral supplements – Phytate phosphorus is unavailable to animals, but is excreted with manure u Reduce feed wastage – Pelleted Feeds – Wet-Dry feeders – Properly adjust feeders u Recycle – Use manure nutrients to produce feed on the farm
N, P, K Imports u Feed u Animals u Commercial Fertilizer u Manure from other farms u Legumes
N, P, K Exports u Animal Products (Milk) u Manure shipped off farm u. Storage Losses
Storage Systems u Liquid Systems (Lagoons) u Slurry Systems
Storage Systems u “Dry Systems”
Storage Systems u Combination Systems (Solids Separators)
Goals u Lagoons – Reduce Waste Stream (Volatilize Organic Matter) – Reduce Land Application Area (Vol. Nitrogen) – Reduce Odor Emissions u Slurry Storage – Maximize Nutrient Utilization – Minimize Storage Volume (minimize water added)
Goals u Dry Systems – Make manure more transportable – Reduce odors u Solids Separators – Reduce size requirements for liquid storage and treatment – Allow transport of some of waste to remote sites or off farm
Disadvantages u Lagoons – Large Volume in storage structure – Reduces N/P ratio – Sludge must be periodically removed u Slurry Storage – Requires more acres for application (based on N) – Odors are greater (if not covered)
Disadvantages u Dry Systems – Often more manual labor required – Swine: Non-homogeneous u Solids Separators – Requires more management – Requires two types of equipment – Cost of construction and operation
Earthen Basin Design u Lagoon u Slurry Storage
Effects on Nutrient Management u Lagoon – Volatilizes nitrogen – Phosphorus settles in sludge layer – 90 -95% of phosphorus must eventually be accounted for if P based NMP u Slurry Storage – Less nitrogen volatilized – Phosphorus must be accounted for each year u Dry Systems – Can be less flexible concerning time of application
% of Original Nitrogen Available after Storage
CNMP Should Include: u Description of Overall System – Number and type of buildings – Flush, Pull-plug, etc – For partial confinement - % Time in confinement
CNMP Should Include: u Lagoon Design Information (as available) – – When built, Who designed it Total Capacity (ft 3) Pumpable (Storage) Capacity (ft 3) Surface Water Diversion u Operating Information – Maximum Fill Level – Pump-down level
Lagoon Design Info: Stop-Pumping Level Depth Max-Fill Level Pumpable Volume Total Volume Rise Run Inside Slope = Run/Rise
CNMP Should Include: u For Slurry Storage – Design Storage Time – Capacity (# of animals, etc. ) u Capacity of Dry storage if applicable u Closure Plan for Liquid or Slurry Storage Structures u Provision for Record Keeping (Monthly Inspection Checklist)
Estimation of Nutrients in Manure u Standard “Book Value” Estimates u Imports minus Exports u Manure analysis and application records
Estimation of Nutrients in Manure u Standard Estimates (lb / year / animal, etc) – Table 1, Table 3 a, b, c – Table 4 (Storage Losses), Table 5 (sludge)
Estimation of Nutrients in Manure u Imports minus exports – Table 2 a, b, c, Table 7 – Table 4 (Storage Losses), Table 5 (sludge)
Estimation of Nutrients in Manure u Manure analysis and application records – Table 6 a, b
Summary (Nutrient Inventory) u Software has been developed to aid in development of CNMP including the estimation of nutrient inventories – see AWARE web site for download
Summary u Lagoons – Reduce nitrogen, organic matter, and odors if properly managed – Must be started and operated according to the design to maintain lagoon health v Sludge must be removed periodically v Do not empty below treatment level
Summary u Slurry – – Storage Maximizes nutrient retention More balanced with plant needs Should be cleaned out at least annually Encourage cover to reduce odors u Proper management including regular inspections and record keeping are essential
Summary u Overall Farm Nutrient Balance – Nutrients brought onto farm in feed, fertilizer, animals, legumes – Exported in animals and animal products, manure, losses
Summary u 3 methods of estimating inventory – Standard values (lb/animal/day; lb/lb of animal/year; etc. ) - - simple to use, but tend to be out of date and values vary greatly by farm. Leaner animals produce more N, less P – Inputs - Outputs - - more complicated, but more accurate if records available – Nutrient analysis and Records of Quantities Pumped - - most accurate if adequate records are available v (Does not account for sludge storage unless sludge is sampled or agitation is used before sampling)
Summary u All methods except analysis and records must estimate storage losses u Storage losses can vary greatly with management differences. Generally represent the greatest difference in manure nutrient content between farms, especially N u Your system may be somewhere between systems described in published lists
Questions? Resources: AWARE Web site: http: //www. agp 2. org/ Then click on “Animal Waste Management” John W. Worley (jworley@engr. uga. edu)