Numerical Descriptive Measures Chapter 3 Group data Vs


 = Population Variation S 2 = Sample Standard Deviation: The value")
 are")


 are")


- Slides: 21
Numerical Descriptive Measures Chapter 3
Group data Vs. Ungrouped data
Ungrouped data §
Ungrouped data Median can be defined as the middle value in a set or distribution. - When the uneven series of values are arranged in ascending or descending order of magnitude, the value of the middle item in the series is known as the median. See ex; 3 -4, pg 84 * However, the set or distribution (values) has even values that case average of middle two values is called median. See ex; 3 -5, pg 84 ** The median is preferred over mean as a measure of central tendency because it is not influenced by outlier.
§ Mode: The mode is defined the value that most frequently occurs in the given data; i. e. the number whose frequency is more than others, is called the mode. - It is usually denoted by "Z“. - Data set with only one value occurring highest frequency is called Unimodal. - Two values that occurred same highest frequency is called Biomodal and more than two is called Multimodal modes. - Example: 3 -7, 3 -8, 3 -9, in pg 86 Major limitations of Mode is that a data set may not have mode. Advantage of Mode is; it can be calculated for both Qualitative and quantitative data, whereas mean and median only calculate quantitative data. Example , 3 -10
Relationship among Mean, Median & Mode Mean , Median & Mode
Time for exercise
Measures of Dispersion / Variability for Ungrouped Data q The mean, median & mode do not reveal a complete or sufficient description of data. - We also need a measure that can deliver some information about the variation among data values. The measures that help us learn about the spread of a data set are called the measures of dispersion. * Measures of central tendency and dispersion taken together give a better picture of a data set than the measures of central tendency alone. Following section will discuss three measures of dispersion/ variation: 1. Range 2. Variance and 3. Standard deviation.
Range: Range is the difference between the largest and smallest observations or value in the data set. Range = Largest value - Smallest value See example 3 -11 in pg 92 Limitation of Range: ü The range, like the mean, has the disadvantage of being influenced by outliers. ü Excepts largest and lowest values, all other values in a data set are ignored when calculating the range.
Variation: ( ) = Population Variation S 2 = Sample Standard Deviation: The value of variation and Standard deviation are never Negative. Variation
The short-cut formulas for calculating the variance and standard deviation (for ungrouped data) are given next. See Example 3 -12 & 3 -13 in pg 94
Population Parameters and Sample Statistics Ø Numerical measure such as the mean, median, mode, range, variance, or standard deviation calculated for a population data set is called a population parameter, or simply a parameter. Ø A summary measure calculated for a sample data set is called a sample statistic, or simply a statistic. v Thus, µ and σ are population parameters, and x and s are sample statistics.
Time for Practice
Mean of Grouped Data Mean for population data: See Example 3 -14 & 3 -15 Mean for sample data: In Page 99, 100
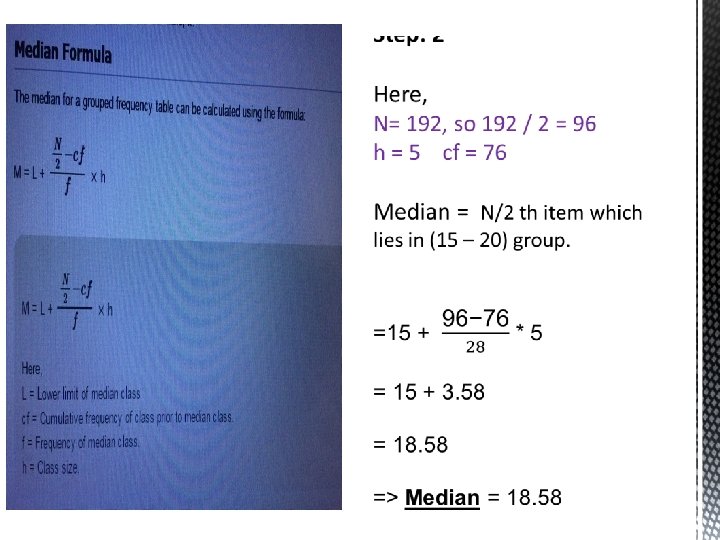
Question Size f 0 -5 20 Answer Step: 1 Class interval 24 0 -5 32 5 - 10 28 10 - 15 5 - 10 10 - 15 15 - 20 20 - 25 25 - 30 30 - 35 35 - 40 40 - 45 Grouped data 20 16 34 10 f 20 24 32 C. f 20 44 76 cf 28 f 104 20 124 25 - 30 16 140 30 - 35 34 174 10 184 8 192 15 - 20 20 - 25 35 - 40 8 40 - 45
Variance and Standard Deviation for Grouped data = Population Variation S 2 = Sample Variation Population Standard Deviation Sample Standard Deviation
The short-cut formulas for calculating the variance and standard deviation (for Grouped data) are given next. See Example 3 -16, 3 -17 In pg 101 n 102
Time for Practice