
Number of ASs Observations n n ASs grew
Number of AS’s
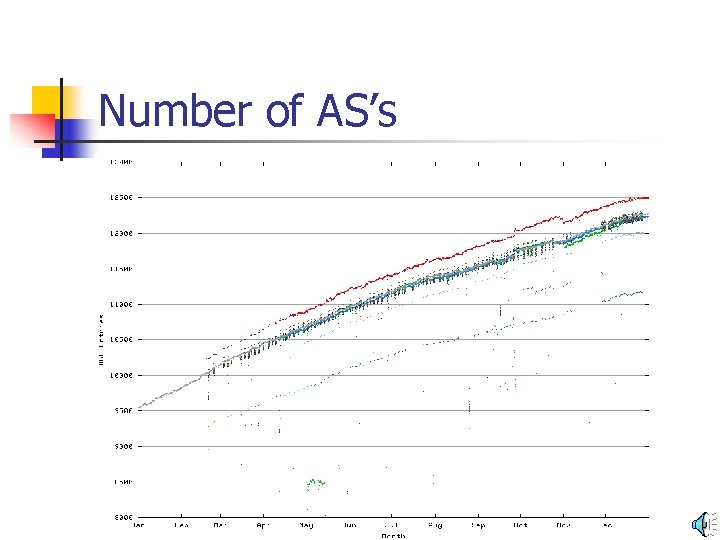
Observations n n AS’s grew by 25% over the year Note span of visible AS’s (11, 200 – 12, 500) n n Not every AS is visible to all other AS’s But there is a more distinct ‘cluster’ of values
What Happened… n n The Internet continued to grow in 2001 The routing space appeared to be better managed in 2001 n n Less routing “noise” Better adherence to hierarchical aggregation in the routed address space
Per-Prefix views n n n Some 60% of the routing table are /24 or smaller “Better” management of the routing space would see the relative numbers of small-sized prefixes declining And we have observed this in 2001…. .
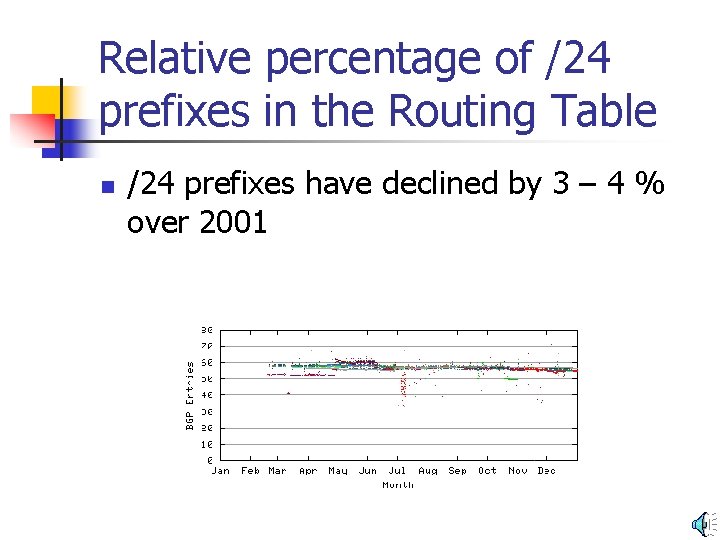
Relative percentage of /24 prefixes in the Routing Table n /24 prefixes have declined by 3 – 4 % over 2001
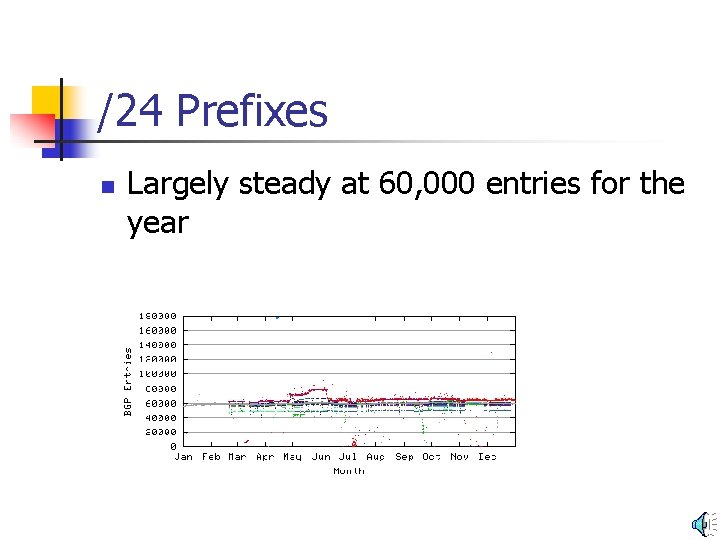
/24 Prefixes n Largely steady at 60, 000 entries for the year

/20 Prefixes n n Grew from 4200 entries to 6100 entries (45% growth) Even growth throughout the year

Comparison of Prefix Groups /18 /19 /20 /24 /25 /26

Changes in the Routing Table n n n No major table growth from small prefixes (/24 and smaller) Table growth occurred using RIR allocation prefix sizes (/18 through /20) Growth in /18 - /20 prefix numbers even through the year

A “Root” Table Entry n n Is not part of an enclosing aggregate May contain any number of more specific entries n n n irrespective of AS Path of the specific Is the minimal spanning set of entries using a strict view of address / routing hierarchies Provides a view of the “best case” of the hierarchical model

Number of BGP “Roots” in 2001
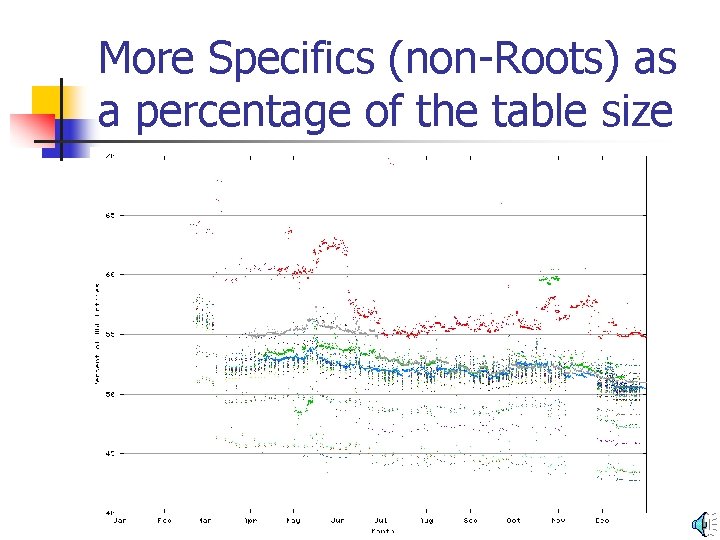
More Specifics (non-Roots) as a percentage of the table size

Whats Happening n n More specific entries in the routing table are declining in relative terms Possibly due to: n n n increasing amount of prefix-length route filtering Increasing peer pressure to conform to RIRallocated prefixes Better understanding in the operator community of how to manage the routing space
- Slides: 13