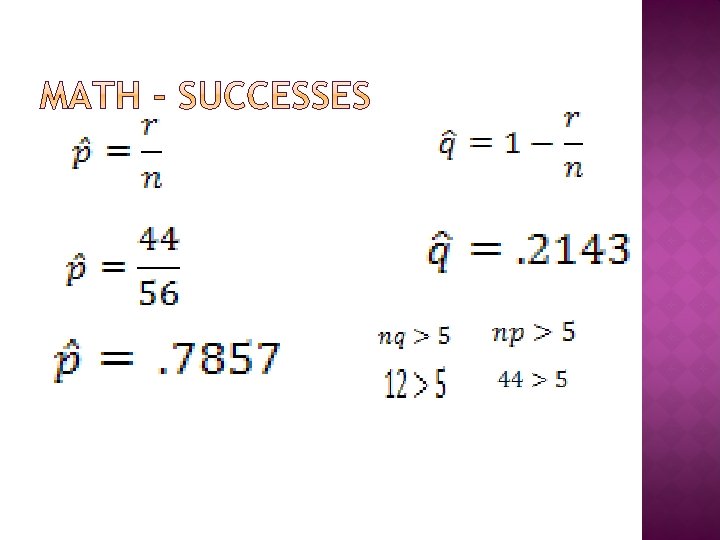
Null Hypothesis p0 Alternate Hypothesis p0 Our null


 175 165 155")
 1 0 -1")

 195 185 175 Height")
 2 1 0")
 160 155 150")
 160 155 150")


 200 195 190 185")
 2 3")

 170 160 150 1")


. Blind testing – students that")

- Slides: 25
Null Hypothesis p=0 Alternate Hypothesis p>0
Our null hypothesis claims that the people who overestimate are equal to those who know or underestimate their height. The alternate hypothesis claims that a majority of people (more than 50%) overestimate their height.
We obtained a class list of sophomores, juniors and seniors and numbered the girls and boys separately for each class. Then we used a random number generator on a calculator to select ten boys and ten girls from each class. We generated more than ten numbers, in case there any repeats or people unwilling to volunteer in the study. Then we found each of the randomly selected students and asked them to volunteer in our study. We asked the height of each participant and then measured them using the scale in the nurse’s office.
Sophmore Class Comparison of Estimated and Actual Heights 195 185 (cm) 175 165 155 145 10 11 19 1 2 3 4 51 26 3 7 4 85 96 710 8 119 12 13 121413 1514 15 16 16 17 171818 19 Estimated Height 167, 6 163, 8 182, 9174174, 6 154, 9 180, 3 157, 5 172, 7 163, 8 182, 9 157, 5 171, 5 163, 8 157, 5 165, 1 0 0 182, 8 Actual Height 165, 7 160, 7 182, 2 173, 4 172, 1 156, 8 179, 1 154, 9 170, 8 163, 8 178, 4 156, 2 170, 2 162, 9 158, 1 163, 2 0 0 180, 3
Difference In Estimated and Actual Height 5 4 3 2 (cm) 1 0 -1 -2 1 2 3 4 5 6 7 8 9 10 11 12 13 14 15 16 17 18 19 Difference 1, 90000001 3, 10000002 0, 700000017 0, 599999994 -1, 90000001 2, 51, 20000002 2, 59999999 1, 89999998 01, 30000001 4, 51, 30000001 0, 900000006 -0, 599999994 1, 90000001 0 0 2, 5
Accuracy of Estimated Height Accurate 5% Excluded 15% Under 10% Over 70%
Junior Class Comparison of Estimated and Actual Heights in (cm) 195 185 175 Height (cm) 165 155 145 135 125 6 711 8 129 10 13 14 20 1 2 3 4 5 6 1 72 38 4 9 5 10 13 111412 15 16 151716 17 18 181919 20 Estimated Height (cm) 193160168, 9 174, 6 175, 3 159, 3 190, 5 175, 2 175, 3 167, 6 187, 9 158, 1 162, 5 175, 3 159, 3 151, 8167163, 8 Actual Height (cm) 190, 5161167 173, 4 173, 9 158, 1 190, 5 175, 2 172, 1 164, 4 186, 6 154, 9 164, 5 174, 6 169, 5 158, 1 148, 6 165, 1 161, 9
Difference in Estimated and Actual Height 6 5 4 3 (cm) 2 1 0 1 2 3 4 5 6 7 8 9 10 11 12 13 14 15 16 17 18 19 20 -1 -2 Difference in Height 1 2 3 4 5 6 7 8 9 10 11 12 13 14 15 16 17 18 19 20 2, 5 1, 90000001 -1 1, 19999999 1, 40000001 1, 20000000000002 03, 19999999 1, 30000001 3, 19999999 0, 700000017 -25, 80000001 1, 20000002 3, 20000002 1, 90000000000001
Difference Between Estimated and Actual Height; 180 175 170 165 (cm) 160 155 150 145 140 1 2 3 4 Estimated Height (cm) 1 160 2 168, 9 Actual Height (cm) 161 167 5 3 6 7 8 9 10 11 4 159, 3 5 175, 2 6 158, 1 7 162, 5 8 159, 3 9 151, 8 10 167 11 163, 8 158, 1 175, 2 154, 9 164, 5 158, 1 148, 6 165, 1 161, 9
Difference Between Estimated and Actual Height; 180 175 170 165 (cm) 160 155 150 145 140 1 2 3 4 Estimated Height (cm) 1 160 2 168, 9 Actual Height (cm) 161 167 5 3 6 7 8 9 10 11 4 159, 3 5 175, 2 6 158, 1 7 162, 5 8 159, 3 9 151, 8 10 167 11 163, 8 158, 1 175, 2 154, 9 164, 5 158, 1 148, 6 165, 1 161, 9
Estimation Accuracy Accurate 11% Under 11% Over 79%
Male Estimate Accuracy Female Estimate Accuracy Accurate Under 10% 0% Accurate 11% Under 22% Over 90% Over 67%
Senior Class Comparison of Estimated and Actual Heights in (cm) 200 195 190 185 180 (cm) 175 170 165 160 155 150 1 2 3 4 5 6 7 8 9 10 11 12 13 14 15 16 17 18 19 20 Estimated Height (cm) 167, 6161, 9175, 3177, 8162, 5185, 4175, 3174, 6182, 8156, 2154, 3185, 4154, 9157, 4193172, 7177, 8180, 9172, 7154, 9 Actual Height (cm) 165, 7159, 4171, 5175, 9161, 2180, 9170, 8174, 6182, 2156, 8153, 7179, 7161, 9160, 6193172, 4177, 1169, 5154, 5
Difference in Estimated and Actual Height 6 4 2 0 1 (cm) 2 3 4 5 6 7 8 9 10 11 12 13 14 15 16 17 18 19 20 21 -2 -4 -6 -8 1 2 3 4 5 6 7 8 9 10 11 12 13 14 15 16 17 18 19 20 21 Height Difference 1, 90000001 (cm) 3, 80000001 2, 5 1, 90000001 1, 30000001 4, 5 0, 600000023 -0, 600000023 0 0, 600000023 5, 70000002 -3, 19999999 -7 0, 299999984 0, 700000017 0 3, 80000001 3, 19999999 0, 400000006 1, 245
Estimation Accuracy Accurate 10% Under 15% Over 75%
Difference Between Estimated and Actual Height; Females 190 180 (cm) 170 160 150 1 2 3 4 5 6 7 8 9 10 Estimated Height (cm) 167, 6 161, 9 162, 5 175, 3 182, 8 156, 2 154, 9 157, 4 177, 8 154, 9 Actual Height (cm) 165, 7 159, 4 161, 2 170, 8 182, 2 156, 8 161, 9 160, 6 177, 1 154, 5 Difference Between Estimated and Actual Height; Males 200 0 1 2 3 4 5 6 7 8 9 10 (cm) Estimated Height (cm) 1 167, 6 2 161, 9 3 162, 5 4 175, 3 5 182, 8 6 156, 2 7 154, 9 8 157, 4 9 177, 8 10 154, 9 Actual Height (cm) 165, 7 159, 4 161, 2 170, 8 182, 2 156, 8 161, 9 160, 6 177, 1 154, 5 Estimated Height (cm) 175, 3 177, 8 185, 4 174, 6 154, 3 185, 4 193 172, 7 180, 9 172, 7 Actual Height (cm) 171, 5 175, 9 180, 9 174, 6 153, 7 179, 7 193 172, 4 177, 1 169, 5
Male Estimate Accuracy Female Estimate Accuracy Accurate 10% Under 40% Accurate 10% Over 50% Under 40% Over 50%
Because our hypothesis is a right-tailed test, the probability of this data coming from this normal curve is approximately 0%.
E= E=. 1415
We used 1% level of significance; the probability of our data collected was 0% with a margin of error of. 1415 with a 99% confidence level. Therefore we reject the null hypothesis and accept the alternate: more than 50% of people overestimate their height.
If we were to do this project over, we would change our sampling procedure (allot more time for sampling, allow for a larger sample size). q Check the precision of the scale used. q Get rid of Dan Walts q Cultural bias-there wasn’t enough ethnic diversity to extrapolate results for the entire world population. q Geographic bias-All test results came from VVS High School. To better check the validity of the test we should have expanded our sample to include other High School students. q
Use a consistent measurement (take measurements in centimeters). Blind testing – students that were sampled later in the process may have found out what the test was about from other students. Time taken – some studies indicate you are taller in the morning than the afternoon, could this affect the data. Assure that people are standing properly to take accurate measurements.
Works Cited Rufo, F. , Vecchi, E. , Vinciguerra, M. G. , Miranda, G. , & Danubio, M. E. (2007, April 8). Comparison of self-reported and measured height and weight: implications among young adults. Retrieved December 2009, from Science. Direct: http: //www. sciencedirect. com/science? _ob =Article. URL&_udi=B 73 DX-4 NFH 0 DH 1&_user=10&_rdoc=1&_fmt=&_orig=search&_sort=d&_doca nchor=&view=c&_search. Str. Id=1139755974&_rerun. Origin=g oogle&_acct=C 000050221&_version=1&_url. Version=0&_use rid=10&md 5=ddb 0 f 5203 b 1 c 29 f 3 c 3