
Nuffield FreeStanding Mathematics Activity Sports injuries Rudolf Stricker

- Slides: 6
Nuffield Free-Standing Mathematics Activity Sports injuries © Rudolf Stricker © Nuffield Foundation 2012
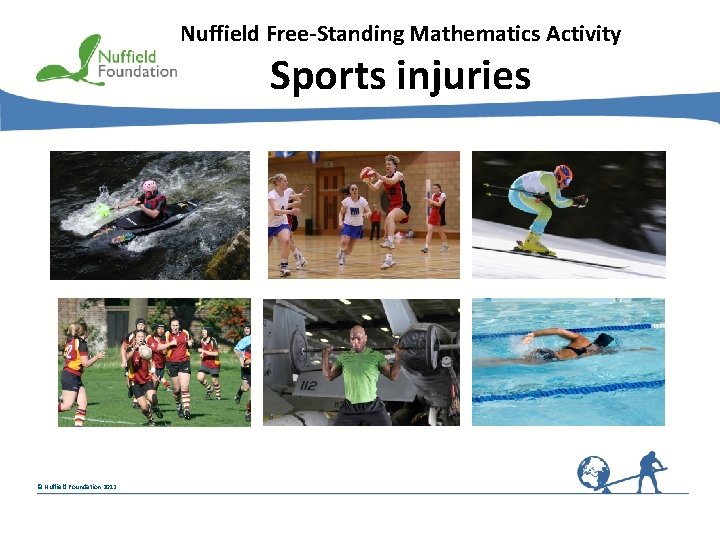
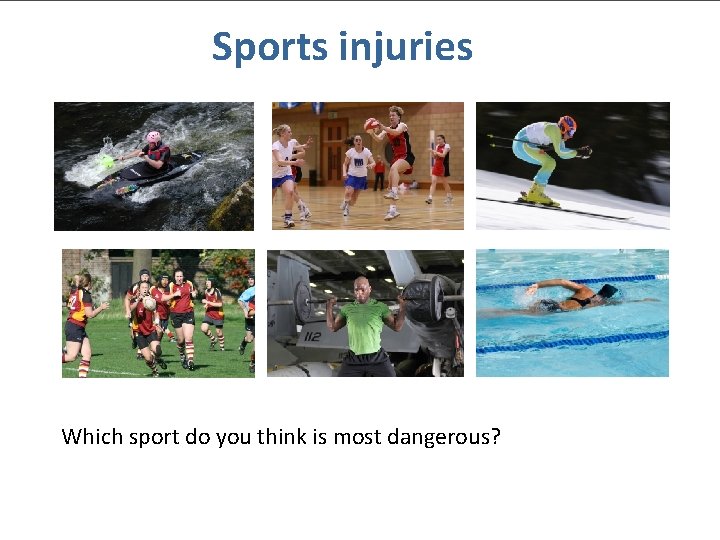
Sports injuries Which sport do you think is most dangerous? © Nuffield Foundation 2010
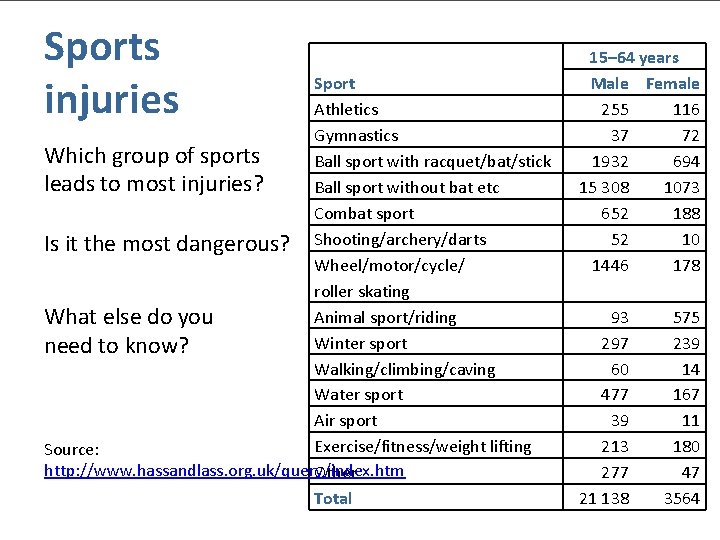
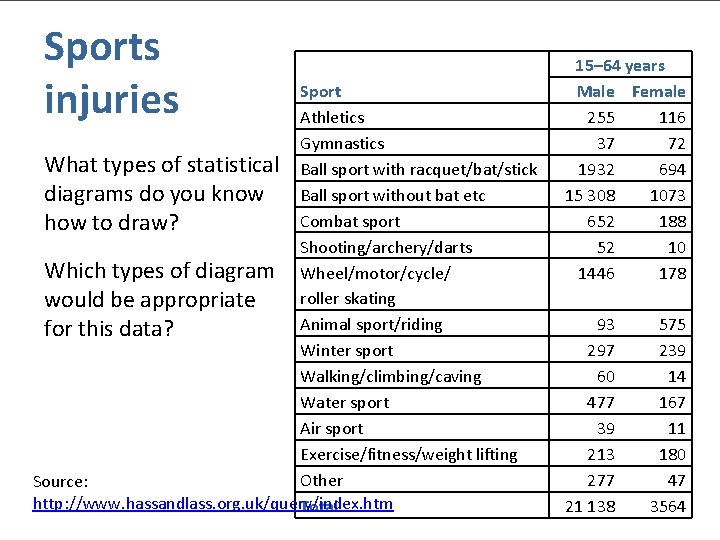
Sports injuries Sport Athletics Gymnastics Which group of sports Ball sport with racquet/bat/stick leads to most injuries? Ball sport without bat etc Combat sport Is it the most dangerous? Shooting/archery/darts Wheel/motor/cycle/ roller skating Animal sport/riding What else do you Winter sport need to know? Walking/climbing/caving Water sport Air sport Exercise/fitness/weight lifting Source: http: //www. hassandlass. org. uk/query/index. htm Other Total © Nuffield Foundation 2010 15– 64 years Male Female 255 116 37 72 1932 694 15 308 1073 652 188 52 10 1446 178 93 297 60 477 39 213 277 21 138 575 239 14 167 11 180 47 3564
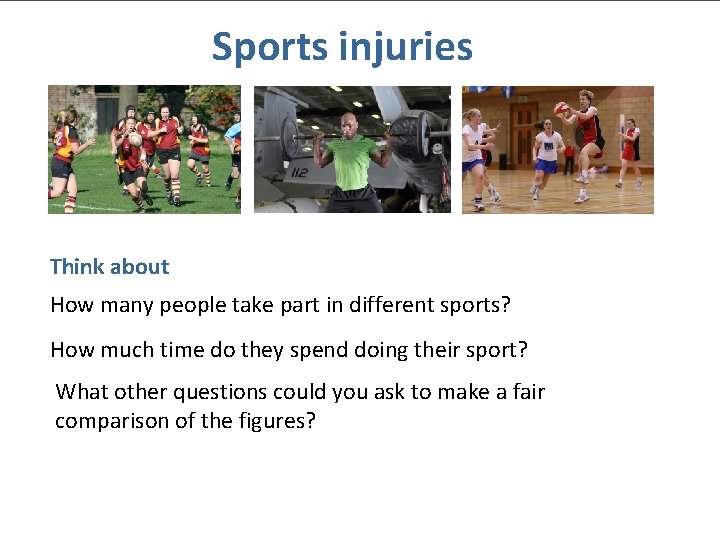
Sports injuries Think about How many people take part in different sports? How much time do they spend doing their sport? What other questions could you ask to make a fair comparison of the figures? © Nuffield Foundation 2010
Sports injuries Sport Athletics Gymnastics What types of statistical Ball sport with racquet/bat/stick diagrams do you know Ball sport without bat etc Combat sport how to draw? Shooting/archery/darts Which types of diagram Wheel/motor/cycle/ roller skating would be appropriate Animal sport/riding for this data? Winter sport Walking/climbing/caving Water sport Air sport Exercise/fitness/weight lifting Other Source: http: //www. hassandlass. org. uk/query/index. htm Total © Nuffield Foundation 2010 15– 64 years Male Female 255 116 37 72 1932 694 15 308 1073 652 188 52 10 1446 178 93 297 60 477 39 213 277 21 138 575 239 14 167 11 180 47 3564
At the end of the activity • Compare your work with that of other students. Do some types of statistical diagrams show things more clearly than others? • What were your main problems in producing diagrams? © Nuffield Foundation 2012