NUCLEAR MAGNETIC RESONANCE NUCLEAR SPIN STATES HYDROGEN NUCLEUS


 Frequency(MHz) g(radians/Tesla) 1 H 99.")
 the")


 Oscillator Transmitter absorption signal")

 METHOD THE OLDER, CLASSICAL METHOD The magnetic field is “scanned” from")
 METHOD FAST THE NEWER COMPUTER-BASED METHOD LOW NOISE Most protons")


 n 1 n 2 n 3 n 1,")


 FOR SELECTED TYPES OF PROTONS R-CH 3 R-CH 2")


 Actually : 5 58. 117 / 11. 3 = 5. 14")
- Slides: 54
NUCLEAR MAGNETIC RESONANCE
NUCLEAR SPIN STATES - HYDROGEN NUCLEUS The spin of the positively charged nucleus generates m a magnetic moment vector, m. + + m + 1/2 - 1/2 TWO SPIN STATES The two states are equivalent in energy in the absence of a magnetic or an electric field.
Spin Quantum Numbers of Some Common Nuclei The most abundant isotopes of C and O do not have spin. Element Nuclear Spin Quantum No 1 H 2 H 12 C 13 C 14 N 16 O 17 O 19 F 1/2 1 0 5/2 1/2 2 3 0 6 2 (I) No. of Spin States Elements with either odd mass or odd atomic number have the property of nuclear “spin”. The number of spin states is 2 I + 1, where I is the spin quantum number.
THE ENERGY SEPARATION DEPENDS ON Bo - 1/2 DE = k. Bo = hn degenerate at Bo = 0 + 1/2 Bo increasing magnetic field strength
The Larmor Equation!!! g yromagnetic ratio g is a constant frequency which is different for each atomic nucleus (H, C, N, etc) g n= Bo 2 p constants n = ( K) Bo NMR Field Strength field strength 1. 41 T 2. 35 T 7. 05 T 1 H Operating Frequency 60 Mhz 100 MHz 300 MHz
Resonance Frequencies of Selected Nuclei Isotope Abundance Bo (Tesla) Frequency(MHz) g(radians/Tesla) 1 H 99. 98% 1. 00 1. 41 2. 35 7. 05 42. 6 60. 0 100. 0 300. 0 267. 53 2 H 0. 0156% 1. 00 7. 05 6. 5 45. 8 41. 1 13 C 1. 108% 1. 00 2. 35 7. 05 10. 7 25. 0 75. 0 67. 28 100. 0% 1. 00 40. 0 19 F 251. 7 4: 1
Nuclear Spin Energy Levels N -1/2 unaligned In a strong magnetic field (Bo) the two spin states differ in energy. +1/2 Bo S aligned
Absorption of Energy quantized Opposed -1/2 DE DE = hn Radiofrequency +1/2 Applied Field Bo Aligned +1/2
N w Nuclei precess at frequency w when placed in a strong magnetic field. RADIOFREQUENCY 40 - 600 MHz hn If n = w then energy will be absorbed and the spin will invert. NUCLEAR MAGNETIC RESONANCE NMR S
POPULATION AND SIGNAL STRENGTH The strength of the NMR signal depends on the Population Difference of the two spin states Radiation induces both upward and downward transitions. resonance induced emission For a net positive signal there must be an excess of spins in the lower state. Saturation = equal populations = no signal excess population
A Simplified 60 MHz NMR Spectrometer hn RF (60 MHz) Oscillator Transmitter absorption signal RF Detector Recorder Receiver MAGNET N S Probe ~ 1. 41 Tesla (+/-) a few ppm
COMPARISON OF CW AND FT TECHNIQUES
CONTINUOUS WAVE (CW) METHOD THE OLDER, CLASSICAL METHOD The magnetic field is “scanned” from a low field strength to a higher field strength while a constant beam of radiofrequency (continuous wave) is supplied at a fixed frequency (say 100 MHz). Using this method, it requires several minutes to plot an NMR spectrum. SLOW, HIGH NOISE LEVEL
PULSED FOURIER TRANSFORM (FT) METHOD FAST THE NEWER COMPUTER-BASED METHOD LOW NOISE Most protons relax (decay) from their excited states very quickly (within a second). The excitation pulse, the data collection (FID), and the computer-driven Fourier Transform (FT) take only a few seconds. The pulse and data collection cycles may be repeated every few seconds. Many repetitions can be performed in a very short time, leading to improved signal …. .
IMPROVED SIGNAL-TO-NOISE RATIO By adding the signals from many pulses together, the signal strength may be increased above the noise level. noise signal enhanced signal 1 st pulse 2 nd pulse nth pulse add many pulses etc. noise is random and cancels out
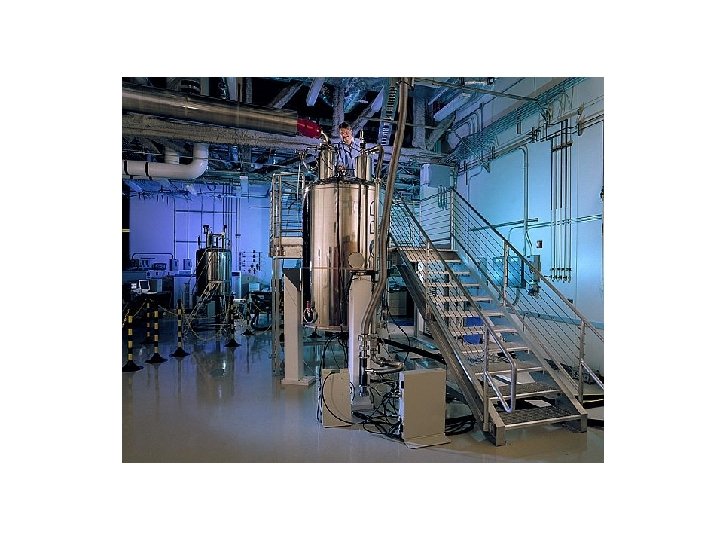
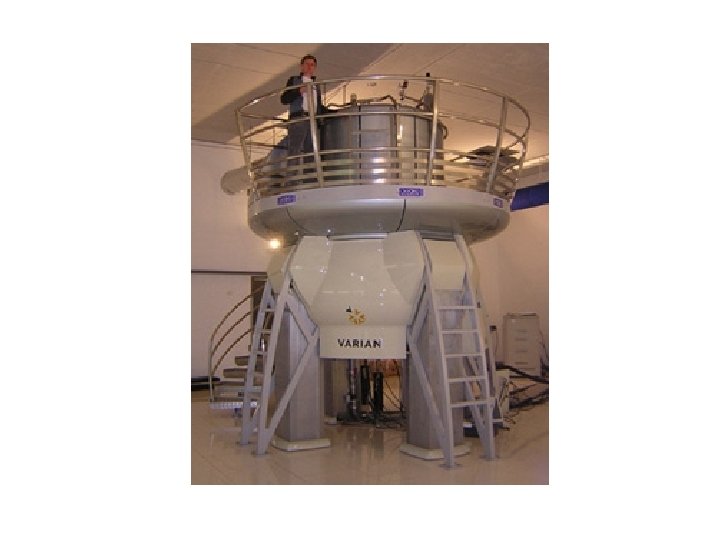
MODERN INSTRUMENTATION PULSED FOURIER TRANSFORM TECHNOLOGY FT-NMR requires a computer
PULSED EXCITATION N n 1 n 2 BROADBAND RF PULSE contains a range of frequencies (n 1. . . nn) n 3 S All types of hydrogen are excited simultaneously with the single RF pulse.
FREE INDUCTION DECAY ( relaxation ) n 1 n 2 n 3 n 1, n 2, n 3 have different half lifes
COMPOSITE FID “time domain“ spectrum n 1 + n 2 + n 3 +. . . time
FOURIER TRANSFORM A mathematical technique that resolves a complex FID signal into the individual frequencies that add ( Details not given here. ) together to make it. TIME DOMAIN converted to FID COMPLEX SIGNAL FREQUENCY DOMAIN NMR SPECTRUM FT-NMR computer Fourier Transform a mixture of frequencies decaying (with time) DOMAINS ARE MATHEMATICAL TERMS n 1 + n 2 + n 3 +. . . individual frequencies converted to a spectrum
The Composite FID is Transformed into a classical NMR Spectrum : “frequency domain” spectrum
DIAMAGNETIC ANISOTROPY SHIELDING BY VALENCE ELECTRONS
Diamagnetic Anisotropy The applied field induces circulation of the valence electrons - this generates a magnetic field that opposes the applied field. valence electrons shield the nucleus from the full effect of the applied field magnetic field lines Bo applied B induced (opposes Bo) fields subtract at nucleus
PROTONS DIFFER IN THEIR SHIELDING All different types of protons in a molecule have a different amounts of shielding. They all respond differently to the applied magnetic field and appear at different places in the spectrum. This is why an NMR spectrum contains useful information (different types of protons appear in predictable places). DOWNFIELD Less shielded protons appear here. SPECTRUM UPFIELD Highly shielded protons appear here. It takes a higher field to cause resonance.
CHEMICAL SHIFT
PEAKS ARE MEASURED RELATIVE TO TMS Rather than measure the exact resonance position of a peak, we measure how far downfield it is shifted from TMS. reference compound tetramethylsilane “TMS” Highly shielded protons appear way upfield. TMS shift in Hz downfield n 0 Chemists originally thought no other compound would come at a higher field than TMS.
IN THE CLASSICAL NMR EXPERIMENT THE INSTRUMENT SCANS FROM “LOW FIELD” TO “HIGH FIELD” LOW FIELD HIGH FIELD NMR CHART B g n i s a e r inc DOWNFIELD o UPFIELD scan
THE CHEMICAL SHIFT The shifts from TMS in Hz are bigger in higher field instruments (300 MHz, 500 MHz) than they are in the lower field instruments (100 MHz, 60 MHz). We can adjust the shift to a field-independent value, the “chemical shift” in the following way: chemical shift = d shift in Hz = spectrometer frequency in MHz parts per million = ppm This division gives a number independent of the instrument used. A particular proton in a given molecule will always come at the same chemical shift (constant value).
HERZ EQUIVALENCE OF 1 PPM What does a ppm represent? 1 H Operating Frequency 60 Mhz 100 MHz 300 MHz 7 6 1 part per million of n MHz is n Hz Hz Equivalent of 1 ppm n MHz 60 Hz 100 Hz 300 Hz 5 4 3 2 1 ( 1 106 0 ) = n Hz ppm Each ppm unit represents either a 1 ppm change in Bo (magnetic field strength, Tesla) or a 1 ppm change in the precessional frequency (MHz).
NMR Correlation Chart -OH -NH DOWNFIELD DESHIELDED UPFIELD SHIELDED CHCl 3 , TMS 12 RCOOH 11 10 9 RCHO 8 7 6 H C=C 5 4 CH 2 F CH 2 Cl CH 2 Br CH 2 I CH 2 O CH 2 NO 2 3 2 CH 2 Ar CH 2 NR 2 CH 2 S C C-H C=C-CH 2 -C- 1 0 d (ppm) C-CH-C C C-CH 2 -C C-CH 3 O Ranges can be defined for different general types of protons. This chart is general, the next slide is more definite.
APPROXIMATE CHEMICAL SHIFT RANGES (ppm) FOR SELECTED TYPES OF PROTONS R-CH 3 R-CH 2 -R R 3 CH 0. 7 - 1. 3 1. 2 - 1. 4 - 1. 7 R-C=C-C-H O 1. 6 - 2. 6 R-C-C-H O 2. 1 - 2. 4 RO-C-C-H O 2. 1 - 2. 5 HO-C-C-H 2. 1 - 2. 5 N C-C-H 2. 1 - 3. 0 R-C C-C-H 2. 1 - 3. 0 C-H R-C C-H 2. 3 - 2. 7 1. 7 - 2. 7 R-N-C-H 2. 2 - 2. 9 R-S-C-H 2. 0 - 3. 0 I-C-H 2. 0 - 4. 0 Br-C-H 2. 7 - 4. 1 Cl-C-H 3. 1 - 4. 1 RO-C-H 3. 2 - 3. 8 HO-C-H O 3. 2 - 3. 8 R-C-O-C-H 3. 5 - 4. 8 O 2 N-C-H 4. 1 - 4. 3 F-C-H 4. 2 - 4. 8 R-N-H 0. 5 - 4. 0 R-O-H 0. 5 - 5. 0 Ar-N-H Ar-O-H R-C=C-H 4. 5 - 6. 5 H 6. 5 - 8. 0 O R-C-N-H 5. 0 - 9. 0 O R-C-H 9. 0 - 10. 0 O R-C-O-H 11. 0 - 12. 0 3. 0 - 5. 0 4. 0 - 7. 0 R-S-H 1. 0 - 4. 0
YOU DO NOT NEED TO MEMORIZE THE PREVIOUS CHART IT IS USUALLY SUFFICIENT TO KNOW WHAT TYPES OF HYDROGENS COME IN SELECTED AREAS OF THE NMR CHART C-H where C is CH on C attached to an aliphatic acid aldehyde benzene alkene next to C-H COOH CHO CH =C-H electronega-tive pi bonds atom X=C-C-H X-C-H 12 10 9 7 6 4 3 2 0 MOST SPECTRA CAN BE INTERPRETED WITH A KNOWLEDGE OF WHAT IS SHOWN HERE
DESHIELDING AND ANISOTROPY Three major factors account for the resonance positions (on the ppm scale) of most protons. 1. Deshielding by electronegative elements. 2. Anisotropic fields usually due to pi-bonded electrons in the molecule. 3. Deshielding due to hydrogen bonding. We will discuss these factors in the sections that follow.
DESHIELDING BY ELECTRONEGATIVE ELEMENTS
DESHIELDING BY AN ELECTRONEGATIVE ELEMENT d- Cl d+ C d- electronegative element H d+ Chlorine “deshields” the proton, that is, it takes valence electron density away from carbon, which in turn takes more density from hydrogen deshielding the proton. NMR CHART “deshielded“ protons appear at low field deshielding moves proton resonance to lower field highly shielded protons appear at high field
Electronegativity Dependence of Chemical Shift Dependence of the Chemical Shift of CH 3 X on the Element X Compound CH 3 X Element X Electronegativity of X Chemical shift d most deshielded CH 3 F CH 3 OH CH 3 Cl CH 3 Br CH 3 I CH 4 (CH 3)4 Si F O Cl Br I H 4. 0 3. 5 3. 1 2. 8 2. 5 2. 1 4. 26 3. 40 3. 05 2. 68 2. 16 0. 23 Si 1. 8 0 TMS deshielding increases with the electronegativity of atom X
Substitution Effects on Chemical Shift most deshielded CHCl 3 CH 2 Cl 2 CH 3 Cl 7. 27 5. 30 3. 05 ppm -CH 2 -Br 3. 30 -CH 2 Br 1. 69 The effect increases with greater numbers of electronegative atoms. -CH 2 CH 2 Br 1. 25 ppm The effect decreases with incresing distance.
ANISOTROPIC FIELDS DUE TO THE PRESENCE OF PI BONDS The presence of a nearby pi bond or pi system greatly affects the chemical shift. Benzene rings have the greatest effect.
fields add together
ANISOTROPIC FIELD FOR AN ALKYNE H C C H Bo Shielded fields subtract hydrogens are shielded secondary magnetic (anisotropic) field
HYDROGEN BONDING
HYDROGEN BONDING DESHIELDS PROTONS The chemical shift depends on how much hydrogen bonding is taking place. Alcohols vary in chemical shift from 0. 5 ppm (free OH) to about 5. 0 ppm (lots of H bonding). Hydrogen bonding lengthens the O-H bond and reduces the valence electron density around the proton - it is deshielded and shifted downfield in the NMR spectrum.
SOME MORE EXTREME EXAMPLES Carboxylic acids have strong hydrogen bonding - they form dimers. With carboxylic acids the O-H absorptions are found between 10 and 12 ppm very far downfield. In methyl salicylate, which has strong internal hydrogen bonding, the NMR absortion for O-H is at about 14 ppm, way downfield. Notice that a 6 -membered ring is formed.
INTEGRATION
NMR Spectrum of Phenylacetone RECALL from last time Each different type of proton comes at a different place. You can tell how many different types of hydrogen there are in the molecule.
INTEGRATION OF A PEAK Not only does each different type of hydrogen give a distinct peak in the NMR spectrum, but we can also tell the relative numbers of each type of hydrogen by a process called integration. Integration = determination of the area under a peak The area under a peak is proportional to the number of hydrogens that generate the peak.
Benzyl Acetate The integral line rises an amount proportional to the number of H in each peak METHOD 1 integral line 55 : 22 : 33 = 5: 2: 3 simplest ratio of the heights
Benzyl Acetate (FT-NMR) Actually : 5 58. 117 / 11. 3 = 5. 14 METHOD 2 digital integration 2 21. 215 / 11. 3 = 1. 90 3 33. 929 / 11. 3 = 3. 00 assume CH 3 33. 929 / 3 = 11. 3 Integrals are good to about 10% accuracy. Modern instruments report the integral as a number.