Nuclear Magnetic Resonance I Magnetization properties Generation and


 • Paramagnetic materials have slightly positive susceptibility and enhance the local")


 energy")


 • With fast MR imaging techniques, 30 -degree and smaller")

 • Micromagnetic inhomogeneities intrinsic to the structure of the")
 • Exponential relaxation decay, T 2, represents the intrinsic")


 • T 1 relaxation depends on the dissipation of")
 • T 1 relaxation increases with higher field strengths")


- Slides: 41
Nuclear Magnetic Resonance I Magnetization properties Generation and detection of signals
Magnetism • Magnetism is a fundamental property of matter • Generated by moving charges, usually electrons • Magnetic properties of materials result from the organization and motion of the electrons in either a random or a nonrandom alignment of magnetic “domains”
Susceptibility • Magnetic susceptibility describes the extent to which a material becomes magnetized when placed in a magnetic field • Diamagnetic materials have slightly negative susceptibility and oppose the applied magnetic field – Examples are calcium, water, and most organic materials
Susceptibility (cont. ) • Paramagnetic materials have slightly positive susceptibility and enhance the local magnetic field, but they have no measurable self-magnetism – Examples are molecular oxygen (O 2), some blood degradation products, and gadolinium-based contrast agents • Ferromagnetic materials augment the external magnetic field substantially; can exhibit “selfmagentism” in many cases – Examples are iron, cobalt, and nickel
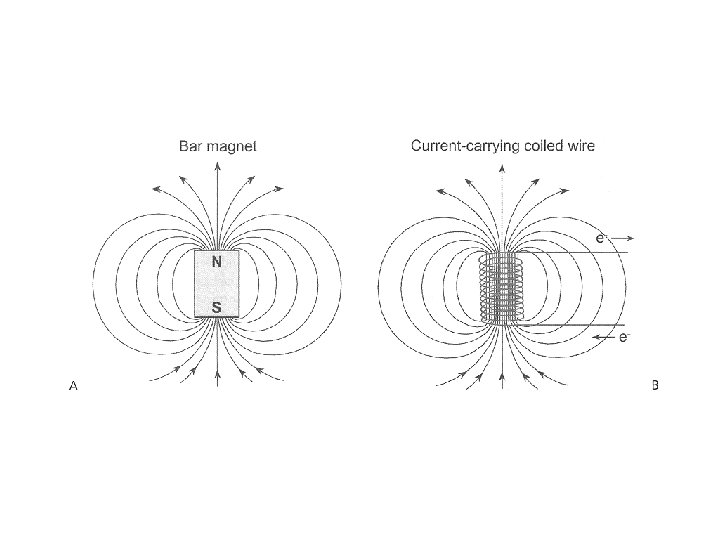
Magnetic fields • Magnetic fields exist as dipoles, where the north pole is the origin of the magnetic field lines and the south pole is the return • “Like” magnetic poles repel and “opposite” poles attract • The magnetic field strength, B, can be thought of as the number of magnetic lines of force per unit area • The SI unit for B is the tesla (T); an alternate unit is the gauss (G), where 1 T = 10, 000 G
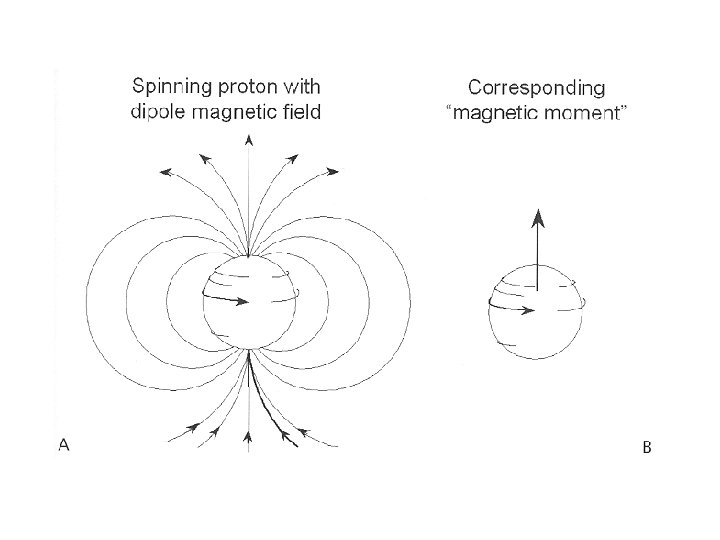
Magnetic characteristics of the nucleus • The nucleus exhibits magnetic characteristics on a much smaller scale • Magnetic properties are influenced by the spin and charge distributions intrinsic to the proton and neutron • Nuclear “spin” of the proton, which has a unit positive charge, produces a magnetic dipole • Neutrons have a magnetic field of opposite direction and approximately the same strength as the proton • The magnetic moment describes the magnetic field characteristics of the nucleus
Magnetic resonance properties of medically useful nuclei
Nuclear magnetic characteristics of the elements • Hydrogen, having the largest magnetic moment and greatest abundance, is the best element for general clinical utility • Therefore, the proton is the principal element used for MR imaging • The spinning proton or “spin” is classically considered to be like a bar magnet with north and south poles • A vector representation (amplitude and direction) is useful in considering the additive effects of many protons
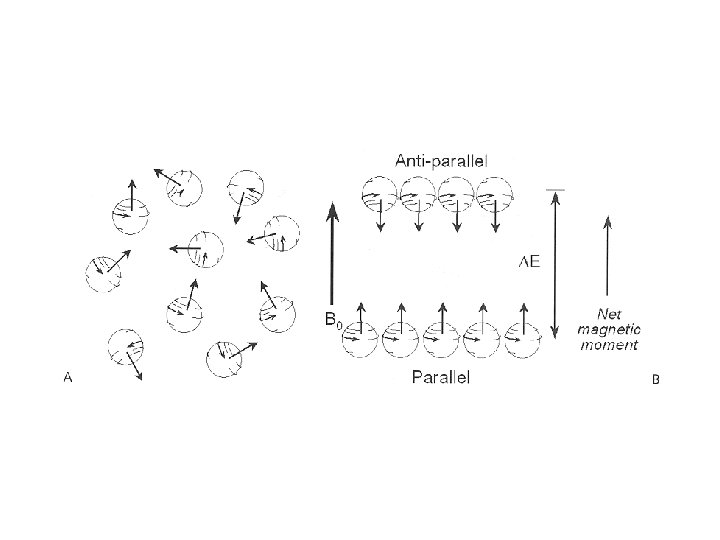
Effects of external magnetic field • Under the influence of a strong external magnetic field, B 0, the spins are distributed into two energy states – Alignment with (parallel to) the applied field at a low-energy level – Alignment against (antiparallel to) the applied field at a slightly higher energy level
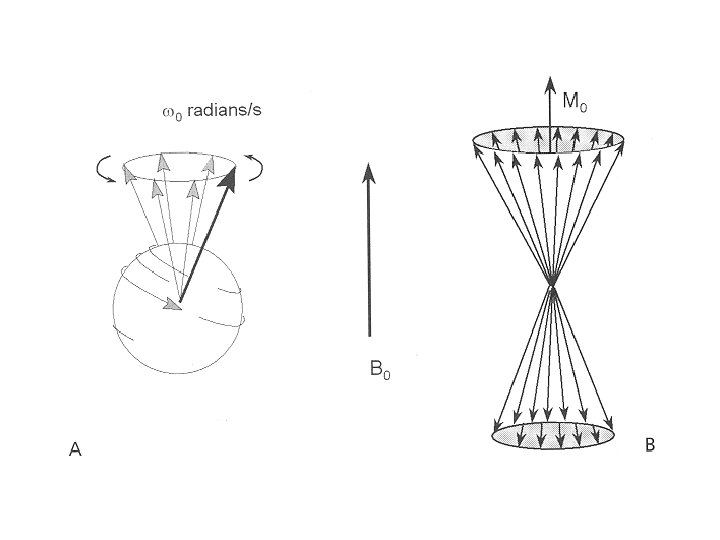
Larmor frequency • The protons also experience a torque from the applied magnetic field that causes precession, in much the same way that a spinning top wobbles due to the force of gravity • Precession occurs at a angular frequency (rotations/sec about an axis of rotation) that is proportional to B 0 • The Larmor equation describes the relationship:
Gyromagnetic ratio for useful nuclei in magnetic resonance
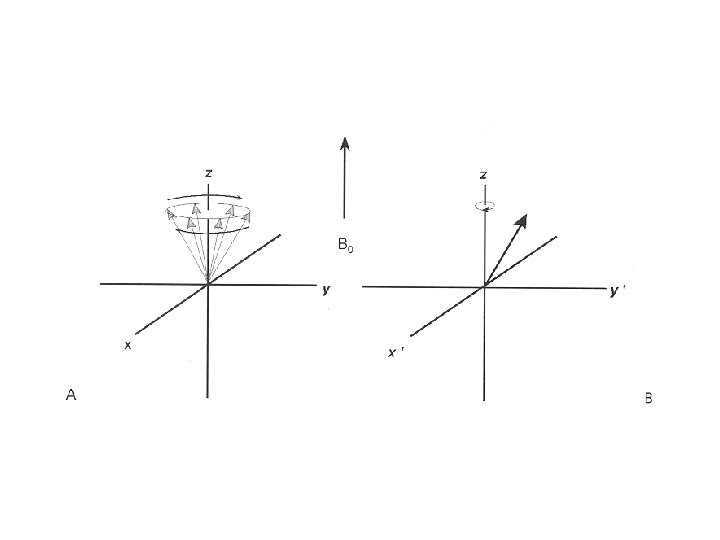
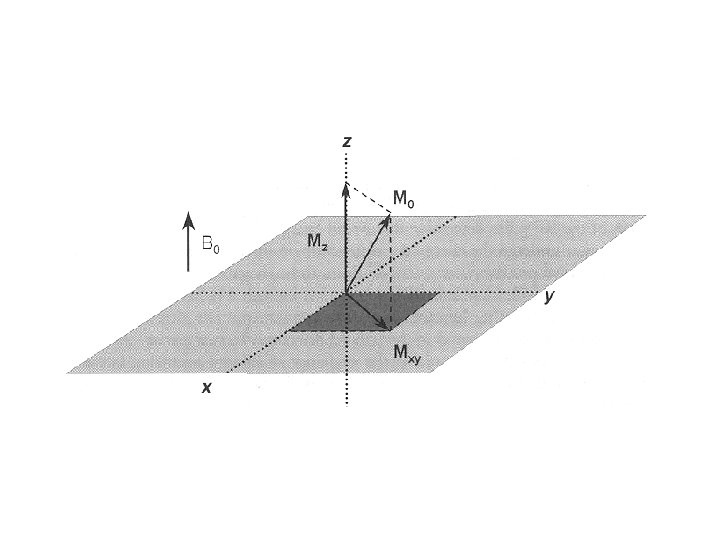
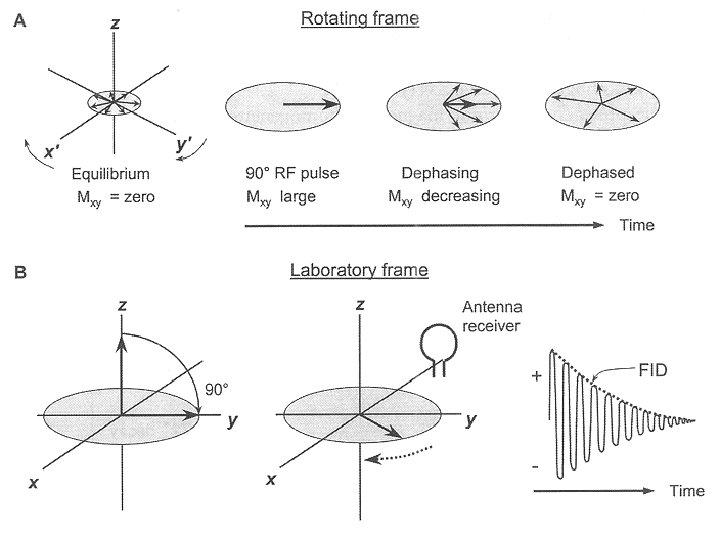
Geometric orientation • By convention, the applied magnetic field B 0 is directed parallel to the z axis • Two frames of reference are used: – The laboratory frame is a stationary reference frame from the observer’s point of view – The rotating frame is a spinning axis system with angular frequency equal to the precessional frequency of the protons
Magnetization vectors • Longitudinal magnetization, Mz, is the vector component of the magnetic moment in the z direction • Transverse magnetization, Mxy, is the vector component of the magnetic moment in the x-y plane • Equilibrium magnetization, M 0, is the maximum longitudinal magnetization of the sample
Generation and detection of the magnetic resonance signal • Application of radiofrequency (RF) energy synchronized to the precessional frequency of the protons causes displacement of the magnetic moment from equilibrium conditions • Return to equilibrium results in emission of MR signals proportional to the number of excited protons in the sample, with a rate that depends on the characteristics of the tissues
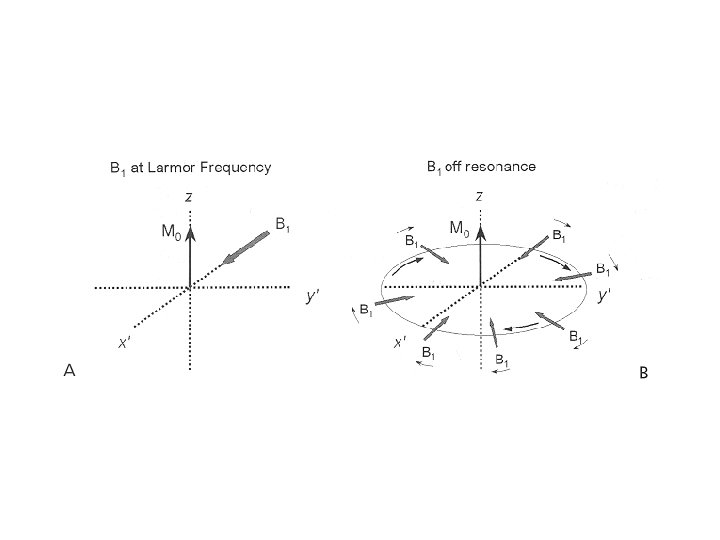
Resonance and excitation • Displacement of the equilibrium magnetization occurs when the magnetic component of the RF pulse, also known as the B 1 field, is precisely matched to the precessional frequency of the protons to produce a condition of resonance • In the rotating frame, the stationary B 1 field applies a torque to Mz, causing a rotation away from the longitudinal direction and into the transverse plane
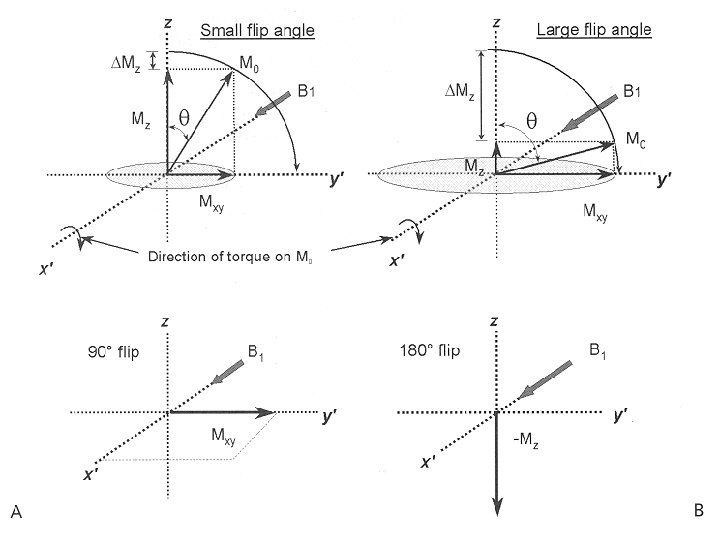
Flip angles • Flip angles describe the rotation through which the longitudinal magnetization is displaced to generate the transverse magnetization • Common angles are 90 degrees ( /2) and 180 degrees ( ) • A 90 degree pulse provides the greatest possible transverse magnetization
Flip angles (cont. ) • With fast MR imaging techniques, 30 -degree and smaller flip angles are often used to reduce the time needed to displace the longitudinal magnetization and generate the transverse magnetization • A 45 -degree flip takes half the time of a 90 -degree flip yet creates 70% of the signal, because the projection of the vector onto the transverse plane is sin 45 degrees, or 0. 707
Free induction decay: T 2 relaxation • As Mxy rotates at the Larmor frequency, the receiver antenna coil (in the laboratory frame) is induced (by magnetic induction) to produce a damped sinusoidal electronic signal known as the free induction decay (FID) signal • The “decay” of the FID envelope is the result of the loss of phase coherence of the individual spins caused by magnetic field variations
T 2 relaxation (cont. ) • Micromagnetic inhomogeneities intrinsic to the structure of the sample case a spin-spin interaction, whereby the individual spins precess at different frequencies due to slight changes in the local magnetic field strength • External magnetic field inhomogeneities arising from imperfections in the magnet or disruptions in the field by paramagnetic or ferromagnetic materials accelerate the dephasing process
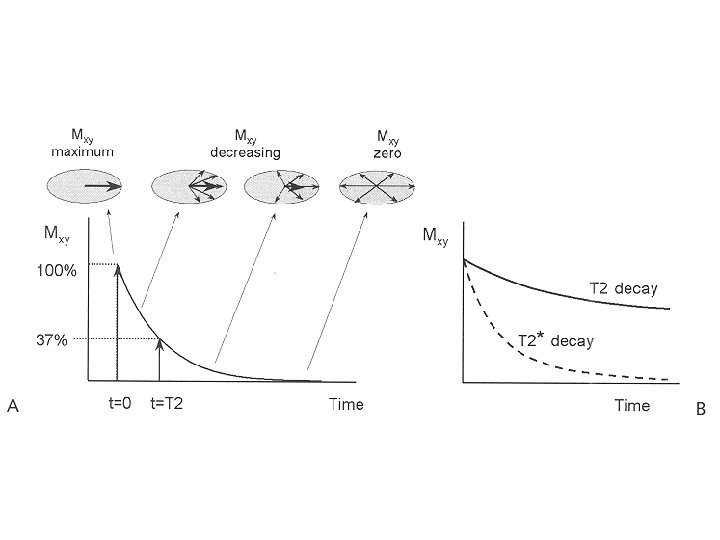
T 2 relaxation (cont. ) • Exponential relaxation decay, T 2, represents the intrinsic spin-spin interactions that cause loss of phase coherence due to the intrinsic magnetic properties of the sample • The elapsed time between the peak transverse signal and 37% of the peak level (1/e) is the T 2 decay constant • Mathematically, this exponential relationship is expressed as follows:
T 2 and T 2 * • T 2 decay mechanisms are determined by the molecular structure of the sample • Mobile molecules in amorphous liquids exhibit a long T 2 because rapid molecular motion reduces or cancels intrinsic magnetic inhomogeneities • When B 0 inhomogeneity is considered, the spin decay constant T 2 is shortened to T 2* • T 2* depends on the homogeneity of the main magnetic field and susceptibility agents present in the tissues
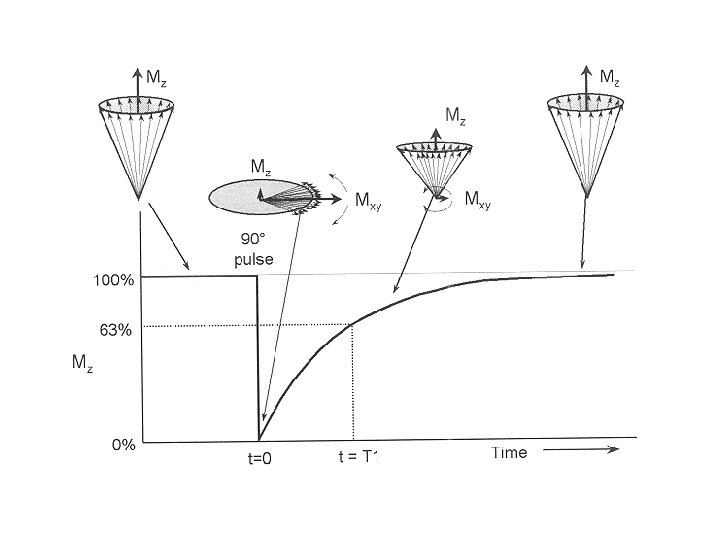
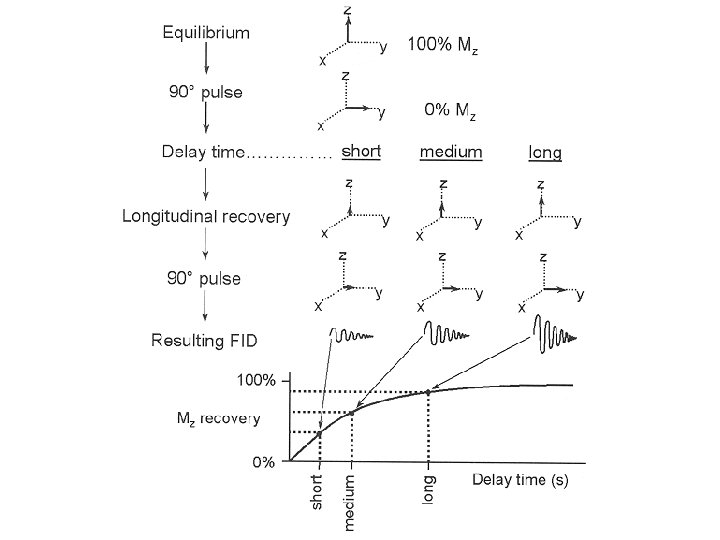
Return to equilibrium: T 1 relaxation • Spin-lattice relaxation is the term given for the exponential regrowth of Mz, and it depends on the characteristics of the spin interaction with the lattice (the molecular arrangement and structure) • The T 1 relaxation constant is the time needed to recover 63% of the longitudinal magnetization, Mz • The recovery of Mz versus time after the 90 -degree pulse is expressed mathematically as follows:
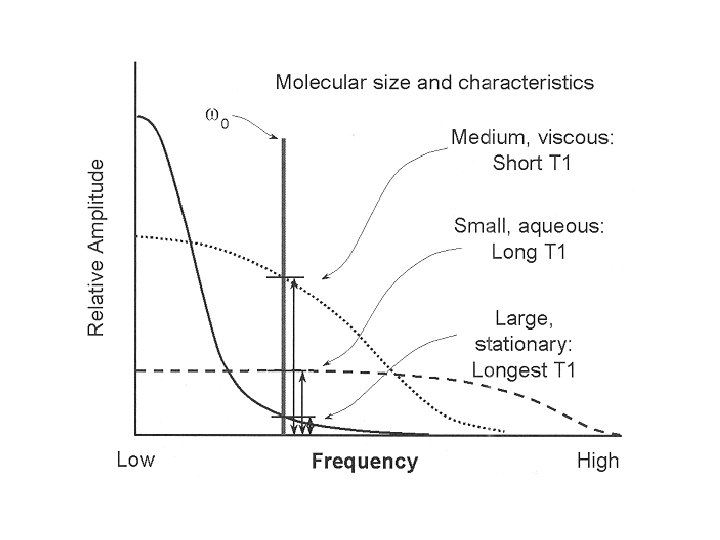
T 1 relaxation (cont. ) • T 1 relaxation depends on the dissipation of absorbed energy into the surrounding molecular lattice • Energy transfer is most efficient when the precessional frequency of the excited protons overlaps with the “vibrational” frequencies of the molecular lattice • Strongly dependent on the physical characteristics of the tissues
T 1 relaxation (cont. ) • T 1 relaxation increases with higher field strengths • Corresponding increase in the Larmor precessional frequency reduces the spectral overlap of the molecular vibrational frequency spectrum, resulting in longer T 1 times
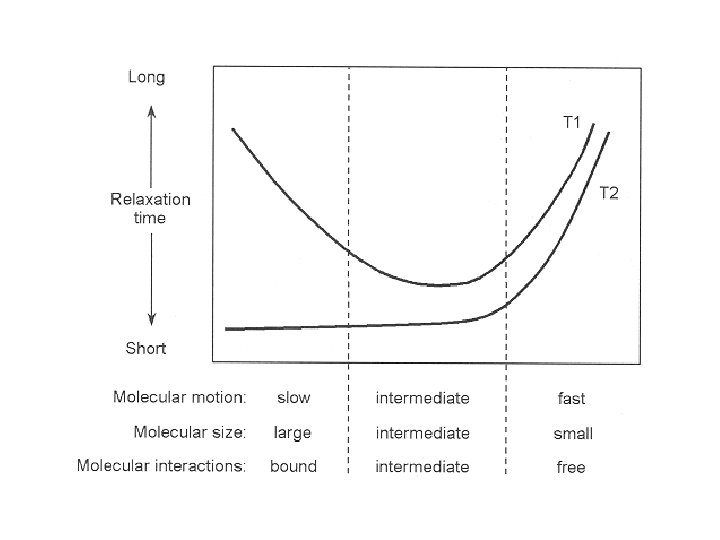
Comparison of T 1 and T 2 • T 1 is significantly longer than T 2 • Molecular motion, size, and interactions influence T 1 and T 2 relaxation • Differences in T 1, T 2, and T 2* (along with proton density variations and blood flow) that provide the extremely high contrast in MRI
T 1 and T 2 relaxation constants for several tissues
Summary • T 1 > T 2*, and the specific relaxation times are a function of the tissue characteristics • The spin density, T 1, and T 2 decay constants are fundamental properties of tissues, and therefore these tissue properties can be exploited by MRI to aid in the diagnosis of pathologic conditions such as cancer, multiple sclerosis, or hematoma