Nuclear imaging Basics Role in CAD History Myron

Nuclear imaging – Basics & Role in CAD

History Myron Prinzmetal Helmann Blumgart Hal Anger

Radioactive decay Principles Alpha decay Beta decay Gamma decay

SPECT - BASICS

Gamma camera Collimator – parallel hole collimator Detector crystal - Na. I Photomultiplier

Capture of emitted photons by a gamma camera The event is localized on the basis of where the photon interacts with the crystal

Technical Aspects of Image Acquisition • Myocardial perfusion data is sampled from multiple angles over 360 o around the patient • Multiple images, each comprising 20 - 25 s of emission data are collected • Each one of the separate “projection” images constitutes a 2 D snapshot of myocardial perfusion from the angle at which the projection was acquired • The imaging information from each of the angles is used to create a 3 D reconstruction of the organ of interest

Standard SPECT imaging display The short-axis images represent a portion of the anterior, lateral, inferior and septal walls Vertical long-axis images represent the anterior wall, apex and inferior wall Horizontal long-axis images represent the septum, apex and lateral walls

Basic properties of myocardial perfusion agents • Perfusion imaging is dependent upon – The physical properties of the radiolabeled tracer – Delivery of the tracer (regional coronary blood flow) – Extraction and retention of the tracer by the myocyte • Both cell membrane integrity and energy utilization are necessary for intracellular extraction and retention of tracer – Retained tracer activity is synonymous with myocyte viability

Basic properties of myocardial perfusion agents The ideal perfusion agent • High first pass myocardial extraction • Linear relationship between uptake and flow • Uptake independent of metabolic state • Stable distribution during imaging

The relation between myocardial blood flow and perfusion tracer uptake The ideal perfusion tracer would track myocardial blood flow across the entire range of physiologically relevant flows The different tracers reach a plateau at different levels of myocardial blood flow

SPECT Perfusion Tracers - Thallium-201 • Cyclotron produced -- Requires off-site manufacturing • The principal photo peaks are gamma rays – 69 to 83 ke. V (85 to 90%) – 167 ke. V (10%) – 135 ke. V (2. 7%) • T 1/2 is prolonged (73 hrs) – limits the overall amount that can be administered to 2 to 4 m. Ci • Monovalent cation with biologic properties similar to those of potassium • First-pass extraction fraction is high (85%)
 • Peak")
Thallium-201 - properties • Uptake is partly an active process (Na-K-ATPase pump) • Peak myocardial concentration occurs within 5 minutes of injection • Rapid clearance from the intravascular compartment • Linear relationship between flow and myocardial thallium activity – proportional up to at least twice the resting flow rates

Thallium-201 - properties Advantages: • Redistribution allows a single injection for both stress and rest images • "gold standard" for viability assessment among single photon agents Disadvantages: • Low photon energy results in more scatter and soft tissue attenuation • Longer physical half-life limits the allowable dose reduced image quality

Thallium-201 redistribution An equilibrium is created between the intracellular and extracellular concentrations of thallium After blood level diminish the equilibrium favors egress of thallium out of the myocyte Thallium concentration diminishes more slowly in zones with less initial thallium uptake

Thallium-201 redistribution • Redistribution is unrelated to flow – Rate of thallium clearance from myocardium – Linked to the concentration gradient between myocytes and the blood levels of thallium • Redistribution often begins as early as 20 mins – Post-stress imaging should begin within 15 minutes after the initial injection • Redistribution assessment of relative regional coronary blood flow following stress and under "resting" conditions, after a single injection of tracer

Assessment of Myocardial Blood Flow at rest • Visualization of myocardial regions suggests the presence of working, viable cell membranes • Lack of visualization of myocardium does not necessarily indicate the absence of viable cells – Infarcted myocardium – Hibernating but viable myocardium • A severe reduction in tracer activity usually signifies infarction

An apical infarction in the HLA and VLA views An inferior infarction in the SA and VLA views Severity of the defect suggests minimal myocyte viability within those territories

Effect of Coronary Stenosis on Coronary Blood Flow Reserve

Effect of Coronary Stenosis on Coronary Blood Flow Reserve Illustration of coronary blood flow reserve abnormalities

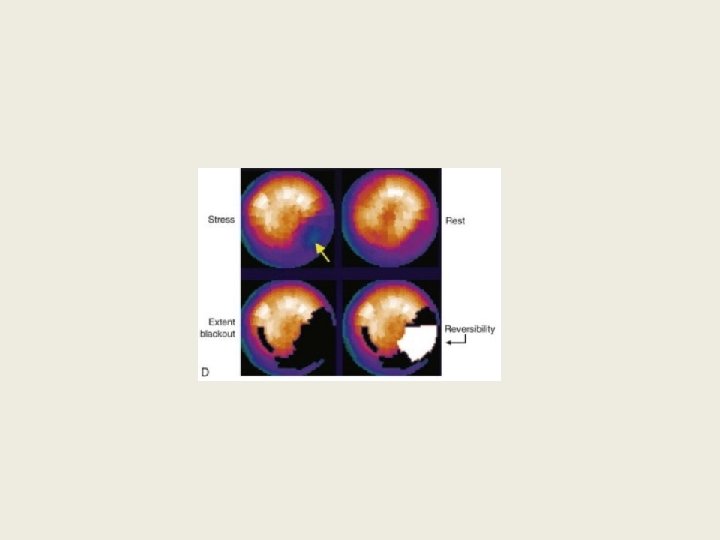
Detection of Stress-Induced Ischemia Versus Infarction with Myocardial Perfusion Imaging SPECT anterior and apical reversible perfusion defects Irreversible or fixed defects When both viable myocardium and scarred myocardium are present, reversibility is incomplete (partial reversibility) on the delayed images

Thallium 201 protocols Stress-redistribution imaging • Was the standard imaging protocol • Single injection at peak stress • 47% of segments that have fixed defects at 4 hours show evidence of viability on PET scanning Tillisch J et al. Reversibility of cardiac wall-motion abnormalities predicted by positron tomography. N Engl J Med 1986

Stress-redistribution imaging Late redistribution imaging • In some instances, redistribution takes longer than 4 hrs • May be related to relatively lower blood levels of thallium-201 throughout the redistribution period • Redistribution imaging 18 to 24 hrs after thallium-201 injection • 20% of fixed defects at 4 hour imaging show late distribution at 24 hrs Perrone-Filardi P et al. Assessment of myocardial viability in patients with chronic coronary artery disease. Rest-4 -hour-24 -hour 201 Tl tomography versus dobutamine echocardiography. Circulation 1996

Stress-redistribution imaging • 95% of segments with late redistribution show improved stress perfusion following revascularization • Disadvantage : poor quality images due to tracer washout and decay • Even with delayed imaging, a proportion of segments with fixed defects improve function after revascularization – some viable segments may never redistribute unless blood levels of thallium-201 are augmented • 37 % of fixed defects even after late imaging improved after revascularization Kiat H et al. Late reversibility of tomographic myocardial thallium-201 defects: an accurate marker of myocardial viability. J Am Coll Cardiol 1988

Thallium-201 reinjection protocol • The reinjection of a second, smaller dose of 201 Tl – Immediately following the redistribution images – Increases the blood level of 201 Tl • Enhanced detection of stress defect reversibility • 50 to 70 % of fixed defects at 4 hr were proved viable • Positive predictive value - 69% • Negative predictive value - 89 %

Thallium-201 reinjection protocol “Differential uptake" • Infrequent phenomenon • Segments with reversible defects at redistribution appear to have more severe defects following reinjection • Relatively smaller increment in regional thallium-201 uptake following reinjection in ischemic compared to normal zones • Implication : It is probably necessary to obtain all three image sets (stress, redistribution and reinjection) to optimize assessment of ischemia and viability fully

Rest-redistribution imaging • A significant percentage of resting thallium-201 defects show redistribution when reimaged several hours after injection • Indicative of regional myocardial viability • An increase of tracer uptake of ≥ 10% on the redistribution images is considered indicative of viability • Useful when fixed perfusion defect is seen in dual isotope rest–stress study
")
Technetium-99 labelled agents Tc-99 m is a generator produced product readily available (on site) at most institutions Advantages • Higher photon energy (140 ke. V) – well suited for gamma camera imaging – less photon attenuation and scatter due to soft tissue • Short half-life (6 hrs) and favorable dosimetry – Permits the administration of substantially more activity high number of emitted photons and improved image resolution – The increased photon flux permits functional imaging with gated SPECT or first-pass techniques

Sestamibi • Lipophilic monovalent cation with transient hepatic uptake, minimal lung uptake and a good target-to-background ratio • First-pass extraction fraction - 60% • Mechanism of myocardial uptake – Passive across the plasma and mitochondrial membranes – Driven by the transmembrane electrochemical gradient – Retained within the mitochondria

Sestamibi Advantages: • Simultaneous perfusion and function assessment is possible • Minimal redistribution over time – Well suited to the prolonged acquisition times associated with tomographic imaging • The absence of redistribution – Necessitates two separate injections, one during peak stress and a second while at rest – Permits greater flexibility in scheduling (immediate image acquisition is not required)

Tetrofosmin • A lipophilic, cationic compound • Good myocardial uptake with rapid clearance from the liver, lungs and blood • First-pass extraction fraction - 60% • More rapid washout from the liver than with sestamibi – Permitting earlier imaging after injection – Less artifact from subdiaphragmatic activity

99 m. Tc protocols Three basic protocols with 99 m. Tc-labeled tracers: • A single-day study – Myocardial blood flow is interrogated at rest and at peak stress – First injected dose is low (8 to 10 m. Ci) and the second injected dose is high (22 to 30 m. Ci) • A 2 -day study (patients with large body habitus) – Higher doses of the tracer are injected (20 to 30 m. Ci) both at rest and at peak stress to optimize myocardial count rate • A dual-isotope technique – Injection of thallium at rest followed by injection of a 99 m. Tc tracer at peak stress

Dual isotope study Thallium rest redistribution and 99 m. Tc Sestamibi stress test

Summary

General Principles of Interpretation and Reporting The key elements to be reported • • • Perfusion defects - presence and location Reversibility (stress induced ischemia) Irreversible or fixed (MI) The extent of perfusion abnormality Severity Extent and severity – Independent risk factors – Risk stratification • It is not sufficient to describe a stress perfusion imaging test as simply “abnormal”

SPECT Image Interpretation and Reporting Visual evaluation A, A large, moderately severe, reversible IW defect reflecting a moderately severe flow reserve abnormality B, A milder reversible IW defect reflecting a less severe stenosis or a severe stenosis with well-developed collaterals minimizing the defect severity In both patients, there is also a mild lateral wall reversible defect

Single vascular territory reversible defects A, A reversible IW defect consistent with inducible ischemia in the RCA territory B, A reversible lateral wall defect consistent with inducible ischemia in the LCX territory C, A reversible anterior wall defect consistent with inducible ischemia in the LAD territory

Reversible defects in more than one vascular territory A, Inducible ischemia in LCX and RCA territories B, Inducible ischemia in LCX and LAD territories

Perfusion abnormalities in all three major vascular territories

Advantages and Disadvantages of Visual Analysis Accuracy of visual analysis • Experience and training of the reader • Quality of the imaging study Advantage • Incorporate information from the raw data (e. g. , Breast or an elevated diaphragm attenuating the inferior wall) • Adjust threshold for interpreting an abnormality Disadvantage • Inherently subjective • Intraobserver and interobserver variability

Semiquantitative visual analysis • A standardised segmentation model – Myocardium is divided into 17 segments – On the basis of 3 short-axis slices and a representative long-axis slice to depict the apex • Perfusion is graded within each segment on a scale of 0 to 4 – 0: Normal perfusion – 4: A very severe perfusion defect

Semiquantitative visual analysis • The segmental scores are assigned • Subjectively by the image interpreter or • Automatically by software programs

Semiquantitative visual analysis • Scores for all 17 segments are added to create a “summed” score • Summed stress score, SSS – Represents the extent and severity of stress perfusion abnormality, (magnitude of perfusion defects related to both ischemia and infarction) • Summed rest score, SRS – Represents the extent of infarction • The summed difference score (SDS) – Subtracting the SRS from the SSS and – Represents the extent and severity of stress-induced ischemia • SSS : Predictors of natural history outcomes

Standard segmental myocardial display for semiquantitative visual analysis in a 17 -segment model Segmental scoring: severe apical fixed defect extending into the inferoapical and anteroapical walls with evidence of reversible defects in the inferior and lateral walls. SSS = 23; SRS = 15; SDS = SSS − SRS = 8 represents the extent of ischemia

Quantitative analysis of SPECT imaging Circumferential profile of relative tracer activity • The most common technique employed • Around the tomogram of interest, such as a short-axis tomogram • Each short-axis tomogram is sampled at every 3 -6 o for 360 o, along a ray extending from the center of the image
 are")
Quantitative analysis of SPECT imaging • The maximum pixel (midportion of the myocardium) are recorded for each angle • The data may be plotted to create a profile of the perfusion pattern relative to the most “normal” area of uptake (assigned a value of 100% uptake)

Quantitative analysis of SPECT imaging Quantitative extent of abnormality • Total amount of myocardium that falls below the lower limit of normal Severity of the perfusion abnormality • Depth of the patient's perfusion abnormality relative to the lower limit of normal Lower limit of normal

Bull's-eye polar plot • Data from all of the individual short-axis tomograms can be combined • 2 D compilation of all of the 3 D short-axis perfusion data

Automated quantitative analysis software Selected short- and long-axis tomograms from stress and rest studies are automatically segmented and scored Extent of ischemic myocardium (white area) measures 23% of the total myocardium 3 D BULL’s EYE PLOTS

Advantages and Disadvantages of Quantitative Analysis Advantages • Little or no human interaction • Highly reproducible • Accounts for potential artifacts such as breast or diaphragm attenuation • More objectivity and reproduciblility Interrogate the effect of therapies on serial changes in myocardial perfusion Disadvantages • Artifacts that are not accounted for by the normal data comparison (motion or other suboptimal quality issues may be called abnormal by quantitation) In practice : Final conclusion is arrived by visual analysis incorporating the quantitative data
 Lung Uptake • In some patients,")
Beyond Myocardial Perfusion (Signs in SPECT Imaging Analysis) Lung Uptake • In some patients, substantial tracer uptake is apparent throughout the lung fields after stress that is not present at rest – Often have severe multivessel disease – Elevation of PCWP during exercise – Decreases in EF during exercise • Mechanism: – Ischemia-induced elevation in LA and pulmonary pressures slows pulmonary transit of the tracer more time for extraction or transudation into the interstitial spaces of the lung

Increased lung uptake of Thallium 201

Transient Ischemic Dilation of the Left Ventricle • Imaging pattern in which the LV or LV cavity appears larger on the stress images than at rest • Entire left ventricle appears larger during stress – Pathophysiology: Extensive ischemia and prolonged postischemic systolic dysfunction resulting in a dilated, dysfunctional LV • Apparent dilation of the LV cavity – The epicardial silhouette appears similar at stress and rest – Diffuse subendocardial ischemia – Associated with severe and extensive CAD

Transient Ischemic Dilation of the Left Ventricle Transient ischemic dilation of LV The perfusion pattern suggests single-vessel disease, but the presence of transient ischemic cavity dilation is suggestive of more extensive and higher risk disease

Common Normal Variations in SPECT Imaging • May be falsely interpreted as a defect • Related to structural variations of the myocardium – “dropout” of the upper septum because of merging of the muscular septum with the membranous septum – Apical thinning: The apex is anatomically thinner than other myocardial regions

Common Normal Variations in SPECT Imaging • Related to technical factors associated with image acquisition – The lateral wall may often appear brighter than the contralateral septum – The camera is physically closer to the lateral myocardial wall than to the septum less soft tissue attenuation and more efficient count capture

Technical Artifacts Affecting Image Interpretation • Attenuation of photons refers to undetected events in the heart due to interaction of photons with the intervening soft tissue • Mimic true myocardial perfusion defects Reduce specificity (increase false-positive findings) Breast Attenuation • In patients with large or dense breasts, significant attenuation may create artifacts • Gender-matched quantitative data bases have had a favorable impact • Data bases generally consist of subjects of average body and breast size

Technical Artifacts Affecting Image Interpretation A mild fixed anterior and anteroseptal defect ? A nontransmural anterior infarct ? Artifact due to breast attenuation

Technical Artifacts Affecting Image Interpretation In the gated images, the same SA and VLA views are frozen in end diastole and end systole Wall thickening from end diastole to end systole appears normal This is most consistent with an attenuation artifact

Technical Artifacts Affecting Image Interpretation Inferior Wall Attenuation • Commonly encountered in SPECT imaging • May be caused by diaphragm overlapping the inferior wall • The longer distance from the IW to the camera photons must traverse a greater degree of tissue before reaching the detectors increase the degree of scatter and attenuation

Technical Artifacts Affecting Image Interpretation Attenuation of the inferior basal wall Most commonly, this appears as a tapering of the IW seen best on the VLA Prone position: The IW is pulled somewhat away from the diaphragm

ECG-gated SPECT • Simultaneous assessment of LV function and perfusion • Involves creation of one cardiac cycle for analysis that represents an average of several hundred beats – counts recorded during any individual cardiac cycle is insufficient • Images acquired during a period of 8 to 15 minutes • Frames are redisplayed sequentially in a cine or movie format • Beat-length windowing • High-quality ECG-gated images

Basis for the technique of ECG gating 1 – end diastolic 4 – end systolic Wall thickening and brightening are seen across the course of systole

ECG-gated SPECT image interpretation Visual assessment of regional myocardial function • Normally brightening - normal regional systolic performance • Diminished but apparent brightening – hypokinetic • Slight brightening - severely hypokinetic • No apparent brightening - akinetic

ECG-gated SPECT – Visual assessment A, Inferior region appears to brighten less - severely hypokinetic The lateral wall also brightens less than the normal septum - hypokinetic B, The apex in HLA appears to have no change from diastole to systole - Akinetic

ECG-gated SPECT - Quantitative Analysis • Computer-based methodology with software capable of quantitative analysis • Fully automated and highly reproducible • Automated interrogation of the apparent epicardial and endocardial borders of all of the tomograms in all three orthogonal planes • These multiple 2 D contours are then reconstructed to create a surfacerendered 3 D display • Can be viewed from any direction by simple maneuvering • Automated calculation of EF and LV volumes

ECG-gated SPECT - Quantitative Analysis The green “mesh” represents the epicardium, and the gray surface represents the endocardium EF is quantitated from the volume change During image interpretation, gated SPECT images are displayed in the cine format as an endless loop movie
 • Performed by first-pass or by")
Radionuclide Ventriculography (radionuclide angiography or blood pool imaging) • Performed by first-pass or by equilibrium gated techniques (MUGA scanning) – The two techniques use distinct tracers and data recording – Provide similar results for global EF and chamber volumes • Highly reproducible to quantify global LV and RV EF Equilibrium Radionuclide Ventriculography (Gated Blood Pool Imaging) • Data are recorded in a computer system synchronized with the R wave of the patient's ECG (similar to ECG-gated SPECT) • For labeling of the blood pool, 99 m. Tc is bound to RBC (better image contrast) or albumin

Equilibrium Radionuclide Ventriculography Image Acquisition • Summation of counts from 800 to 1000 cardiac cycles • Images are usually acquired in three standard projections: – Anterior, “best septal” LAO and left lateral • Minimum framing rate – Resting RVG study : 16 frames/cycle (about 50 msec/frame) – Quantitative assessment of diastolic indices and regional EF : 32 frames/cycle (about 25 msec/frame) • Images are acquired for a preset count of at least 250, 000 per frame or count density of 300 counts per pixel, which corresponds to an acquisition time of 5 to 10 minutes per projection

RVG - Image Display and Analysis Qualitative analysis Qualitative inspection as an endless cinematic loop of the cardiac cycle • Size of heart chambers and great vessels • Regional wall motion • Global function (qualitative assessment) • Extracardiac uptake (such as splenomegaly)

ECG-gated equilibrium RVG schematic images

RVG - Image Display and Analysis Qualitative analysis Normal LV function LV dysfunction LV and RV volumes diminish from diastole Much less volume change from end to systole diastole to end systole

RVG - Image Display and Analysis Quantitative analysis The LAO view of the LV and RV at end diastole with a region of interest (ROI) identifying the LV contour “background” ROI drawn at end systole, used to correct for count activity in front of and behind the LV

RVG - Image Display and Analysis Quantitative analysis Time-activity curve The change in counts within the ROI across a cardiac cycle Count activity is related to LV chamber volume The time-activity curve represents the relative volume change of the LV chamber across a cardiac cycle

First-Pass Radionuclide Angiography or Ventriculography • The bolus of radioactivity passes initially through the right chambers of the heart lungs left sided chambers of the heart • Tracers used must produce adequate counts in a short time at an acceptably low radiation dose • 99 m. Tc-DTPA is the recommended radionuclide of choice

First-Pass RVG Image Acquisition • Images are acquired very rapidly as the tracer passes through • Separation of the RV and LV is achieved because of the temporal separation of the bolus • Image quality is related to the injection technique (requires rapid (2 - 3 s) uninterrupted bolus) • Images are acquired in the supine position after the rapid injection of 25 m. Ci of tracer • • Medial antecubital or external jugular vein The shallow (20 -30 o) RAO projection is used to optimize separation of the atria and great vessels from the ventricles

First-pass radionuclide ventriculography Individual frames from a first-pass acquisition Path of the bolus isotope through the SVC, RA, RVOT and lungs (PA), LA and LV

First-pass radionuclide ventriculography Image Analysis • To identify the RV and LV phases, regions of interest are drawn around the right and left ventricles at end diastole • Time-activity curves are generated and cycles around the peak timeactivity curve are used to calculate Efs • In general, 2 -5 cardiac cycles are summed for the RV phase and 5 -7 cycles are summed for the LV phase • From these data, quantitative analysis of LVEF and RVEF is performed

Comparison of Equilibrium and First-Pass Techniques Advantages of the first-pass technique • High target-to-background ratio • Rapidity of imaging • More distinct temporal separation of the cardiac chambers • RVEF may be more readily assessed Advantages of equilibrium technique • Potential for repeated assessment during rapidly varying physiologic conditions • High count density • Acquisition of images in multiple projections • In contemporary practice, the equilibrium technique is performed far more commonly

Positron emission tomography • Beta decay – Electron capture – Positron emission – Electron emission • Measurement of myocardial perfusion and metabolism in absolute quantitative terms – ml/g/minute for blood flow – moles/gram/minute for metabolism

PET - Image Acquisition Schematic of positron and electron beta particle emission, with detection by a coincidence camera

PET Tracers • PET imaging is based on two concepts: – Myocardial flow and myocardial metabolism

PET – Tracers • Ischemic myocardium : fatty acids glucose • Uptake of FDG in an area of dysfunctional myocardium indicates metabolic activity and thus viability • Regional perfusion can be simultaneously assessed with N-13 ammonia or Rb-82

PET - Image Analysis • Emission data are displayed as tomograms similar to SPECT display (SA, HLA, VLA)

PET - Image Analysis Differentiation of normal, stunned, hibernating and necrotic myocardium • Hibernating myocardium – Presence of enhanced FDG uptake in regions of decreased blood flow ("PET mismatch") • Necrotic myocardium – Concordant reduction in both metabolism and flow ("PET match") • Stunning – Regional dysfunction in presence of normal perfusion

Clinical Application of PET Perfusion Imaging • Segments with reductions in both blood flow and FDG uptake – Only a 20% chance of functional improvement following revascularization • Hibernating segments – 80 to 85% chance of functional improvement following revascularization • The PPV and NPV for improvement in wall motion score after revascularization is 96% • Extent of myocardium with enhanced FDG uptake predicts the magnitude of improvement in EF, exercise tolerance and HF symptoms

Hybernating myocardium Scarred in anteroseptal region

Advantages of PET over SPECT • Higher spatial resolution • Improved attenuation and scatter correction • Sensitivity and specificity (95%) for detection of CAD – "probably normal" or abnormal studies by SPECT versus PET (37 vs 21 %) • Quantification of myocardial blood flow in absolute terms – “balanced” ischemia may not be detected by SPECT
![Limitations • Requirement of an on-site cyclotron for [13 N]ammonia • High cost of](http://slidetodoc.com/presentation_image_h/1c69d4fb31ab088ab39426aa8f17152f/image-90.jpg "Limitations • Requirement of an on-site cyclotron for [13 N]ammonia • High cost of")
Limitations • Requirement of an on-site cyclotron for [13 N]ammonia • High cost of monthly generator replacement for 82 Rb • Relatively short half-lives of both 82 Rb and [13 N]ammonia limit the utility of PET to patients undergoing pharmacologic stress only

Comparison with non-nuclear techniques • Dobutamine echocardiography is an established technique for viability detection • • Relative predictive value of the different forms of radionuclide MPI and of dobutamine echocardiography Meta-analysis : 52 studies; 1367 patients with ischemic LV dysfunction For each technique, NPV > PPV NPV: Highest with FDG-PET, reinjection thallium SPECT and dobutamine echocardiography PPV : Highest with dobutamine echocardiography and lowest with reinjection thallium SPECT Bax JJ et al. Sensitivity, specificity, and predictive accuracies of various noninvasive techniques for detecting hibernating myocardium. Curr Probl Cardiol 2001

Predictive accuracy of imaging tests for myocardial viability

Assessment of myocardial viability by nuclear imaging in CAD Why viability assessment? • • CAD is the major cause of HF Severe LV dysfunction – not an irreversible condition Hibernation and stunning are potentially reversible Viable myocardium can be demonstrated in 20 -40% of patients with CAD and LV dysfunction, even in the absence of angina Allman KC et al. Myocardial viability testing and impact of revascularization on prognosis in patients with coronary artery disease and left ventricular dysfunction: a meta-analysis. J Am Coll Cardiol 2002

Assessment of myocardial viability by nuclear imaging in CAD The outcome depends not only on the presence, but also the extent of viability Group A - > 7 viable segments Group B - ≤ 7 viable segments

Risk Stratification in Stable Chest Pain Syndromes The Relation Between the Extent of Perfusion Defect and Natural History Outcomes

The Incremental Value of Perfusion Imaging The larger the chi-square value, the stronger the relation between the combination of factors on the x-axis and the natural history outcome Even when anatomic information is available, the physiologic information provided by SPECT MPI adds significantly to risk prediction ability

Identification of Treatment Benefit After Risk Stratification • Stress MPI in >10, 000 patients with suspected CAD • The extent of ischemic myocardium predicted reduction in the risk of death with revascularization • Just over 10% of ischemic myocardium • As the percentage of ischemic myocardium increased, the magnitude of benefit of revascularization increased as well

Prognostic Value of Normal MPI • Studies Benign outcome associated with a normal stress MPI study • ACC/AHA/ASNC Radionuclide Imaging Guidelines – Data of 21, 000 patients with normal stress SPECT MPI study – The hard event rate is 0. 7% / yr (follow-up of 2 yrs - “warranty period”) • Baseline high risk factors (e. g. , DM) slightly higher risk after a normal stress MPI study (consistent with Bayes’ theorem) • Angiographic CAD with a stable symptom complex – Low-risk outcome (~0. 9% / yr) with a normal stress MPI – The mechanism: ? Preserved endothelial function despite CAD allowing appropriate flow-mediated vasodilation during stress

Influence of Perfusion Tracer on Detection of CAD • The choice of radiotracer does notably affect the discrimination between the presence and absence of CAD • Studies comparing the widely used agents No significant improvement in sensitivity or specificity • Exception: Demonstration of improved specificity in women with 99 m. Tcsestamibi • 99 m. Tc-based agents (greater photon energy) – Improved performance in obese patients and those with large breasts – Higher quality gated images

Pharmacologic Stress Testing for Detection of CAD • Vasodilator stress (more powerful hyperemic stress response) – No improved sensitivity to detect CAD – Because of the “roll-off” property of the common perfusion tracers (diffusion limitation at high flow levels) • 2003 ACC/AHA/ASNC Radionuclide Imaging Guidelines – Pooled analysis of 2465 catheterized patients in 17 studies – Sensitivity of 89% and specificity of 75% (similar to exercise SPECT MPI) • Dobutamine stress imaging – Diagnostic ability : Similar to other pharmacologic and exercise stress – Recommended only when other agents are contraindicated • Maximal coronary flow reserve is not achieved often • Substantial side effects

Effect of Submaximal Exercise Performance on CAD Detection • In exercise ECG testing, sensitivity falls significantly if >85% of maximum predicted HR for age is not achieved • Perfusion heterogeneity usually develops at a lower degree of supplydemand mismatch than ECG changes – Sensitivity of MPI is maintained at somewhat lower workloads • No difference in sensitivity between the maximal and the submaximal tests • The extent and severity of reversible perfusion defects are diminished at submaximal workloads, which may affect the prognostic value of the test

Detecting and Defining the Extent of CAD • To formulate a management strategy Extent of disease >> presence or absence of disease • SPECT MPI is limited by the relative nature of the perfusion information • In TVD with balanced ischemia, the least hypoperfused area appears normal true extent of CAD may be underestimated • Gated SPECT allows improved sensitivity (85% to 91%) Sharir T, Bacher-Stier C, Dhar S, et al: Identification of severe and extensive CAD by postexercise regional wall motion abnormalities in Tc-99 m sestamibi gated SPECT. Am J Cardiol 2000

Detection of CAD in Women • The detection of CAD by exercise ECG testing is problematic in women • 201 Tl limited by problems associated with breast attenuation • With the incorporation of gated SPECT sestamibi imaging, specificity - 92% (67% with 201 Tl)

Imaging in Patients with Established CAD • Clinical questions may remain after angiography regarding the “physiologic significance” of stenoses • SPECT MPI can identify the “culprit” ischemic lesion • The results of stress-rest SPECT MPI correlate generally with invasive measures of coronary flow reserve • Successful PCI Improvement of SPECT evidence of ischemia

Imaging After CABG • Recurrent symptoms post CABG: SPECT MPI accurately detects graft stenoses • Routine assessment for ischemia in an asymptomatic patient is not recommended (outcome risk is low in the early years after CABG) • 900 asymptomatic patients post CABG – Defects were common with SPECT MPI – Associated with significantly increased relative risk of death or major events Ficaro EP American Society of Nuclear Cardiology: Imaging Guidelines for Nuclear Cardiology Procedures

• In symptomatic post-CABG patients : Helps to guide the need for intervention • In asymptomatic patients – Implications for clinical decision making are less clear – Extent of SPECT abnormality is important – More extensive perfusion abnormality may justify an invasive approach

Suspected ACS in the Emergency Department • Patients with symptoms suggestive of ACS but with nondiagnostic ECG and biomarker • 99 m. Tc-based perfusion agents may be administered in the ED at rest, with images acquired 45 to 60 minutes later • Images reflect myocardial blood flow at the time of injection (minimal redistribution) • NPV for ruling out MI is high • Positive MPI higher risk of cardiac events during the index hospitalization as well as during follow-up • Assist triage decisions

Suspected ACS in the Emergency Department • Sensitivity to detect ACS in the ED – SPECT sestamibi - 92% – Initial troponin I (drawn at the same time) - 39% • The maximum troponin I during the first 24 hrs had a sensitivity similar to that of rest sestamibi imaging but at a distinctly later time point • Acute MPI has the potential to identify ACS earlier than biomarkers • One RCT of 46 ED patients with ongoing chest pain and a nondiagnostic ECG – MPI-guided strategy incurred lower costs and resulted in shorter lengths of stay Stowers SA et al: An economic analysis of an aggressive diagnostic strategy with SPECT MPI and early exercise stress testing in ED patients who present with chest pain but nondiagnostic ECGs: Results from a randomized trial. Ann Emerg Med 2000

• The Emergency Room Assessment of Sestamibi for Evaluation of chest pain trial (ERASE) – 2475 patients with symptoms suggestive of ACS – Significant 20% relative reduction in unnecessary admissions with incorporation of MPI into the ED evaluation strategy • The ACC/AHA/ASNC Radionuclide Imaging Guidelines classify MPI in this setting as a Class I, Level A indication

NSTEMI and UA Normal SPECT MPI High-risk stress-rest SPECT MPI Despite medical stabilisation, requires intervention Summary of predictive values of SPECT imaging in the aftermath of UA from multiple studies SPECT perfusion imaging in patients after medical stabilization of unstable angina

Assessment of Inducible Ischemia after MI • Three major determinants of natural history risk after an acute MI – Residual resting LV function – Extent of ischemic, jeopardized myocardium – Susceptibility to ventricular arrhythmias • Gated SPECT MPI – Has the ability to provide much of this information – Has the potential to be the single most important test in the stable patient after STEMI • A “low-risk” 201 Tl image (no reversible defects and no lung uptake) was associated with a low-risk natural history outcome after MI Beller GA: Clinical value of MPI in CAD. J Nucl Cardiol 2003

Risk of cardiac event post MI is predicted by the combination of infarct size (represented by LVEF) and the extent of reversible ischemia Fixed defect (MI) in the anterior wall and apex Extensive inducible ischemia involving 25% of the ventricle Gated SPECT LVEF was 38% 25% risk of post-MI adverse event

Clinical implications of viability assessment • Two RCTs comparing mechanical revascularization and OMT based on viability have been reported • Both studies reported a lack of association between the presence or absence of residual myocardial viability, treatment allocation and patient outcome • STICH substudy – 601 patients - viability assessed by SPECT imaging – No difference in outcome based on the interaction between treatment allocation and the presence or absence of viability

• The Canadian PARR study – Randomized 430 patients with severe LV dysfunction – FDG PET – At one year, the cumulative proportion of patients who experienced the primary endpoint (composite of CD, MI or hospitalization for cardiac cause) was no different between groups

• The practical implication – OMT and coronary revascularization may be equally efficacious in the vast majority of patients • It is reasonable to revascularize patients with LV systolic dysfunction and CAD with good coronary target vessels and relatively low surgical risk • For the patient at relatively high surgical risk the demonstration of significant residual myocardial viability make the risk-benefit ratio more favorable for surgery

- Thank you
- Slides: 116