
NTUA Renewable Energy Project General Manager Walter W
NTUA Renewable Energy Project General Manager - Walter W. Haase P. E. National Energy and Utility Affordable Coalition (NEUAC) Annual Conference June 4, 2019 – Fort Worth, Texas
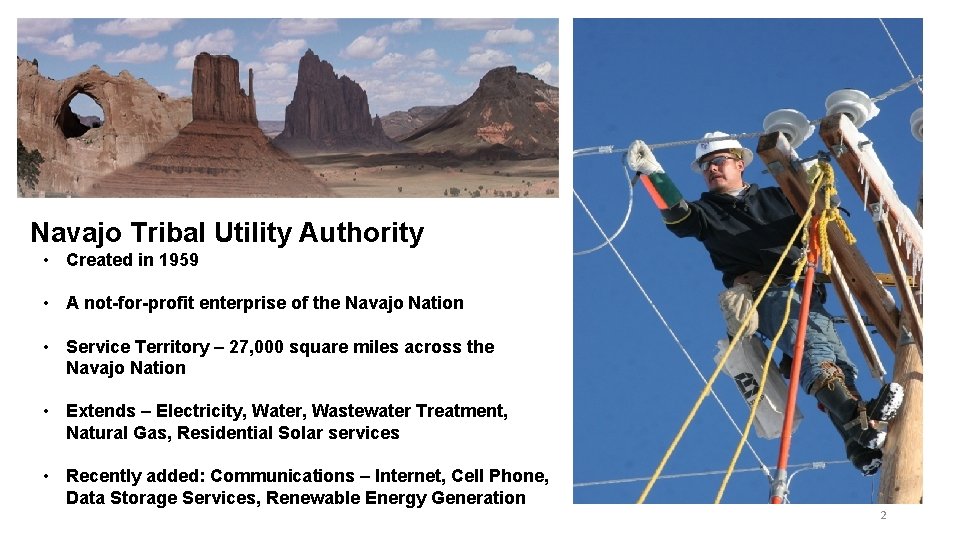
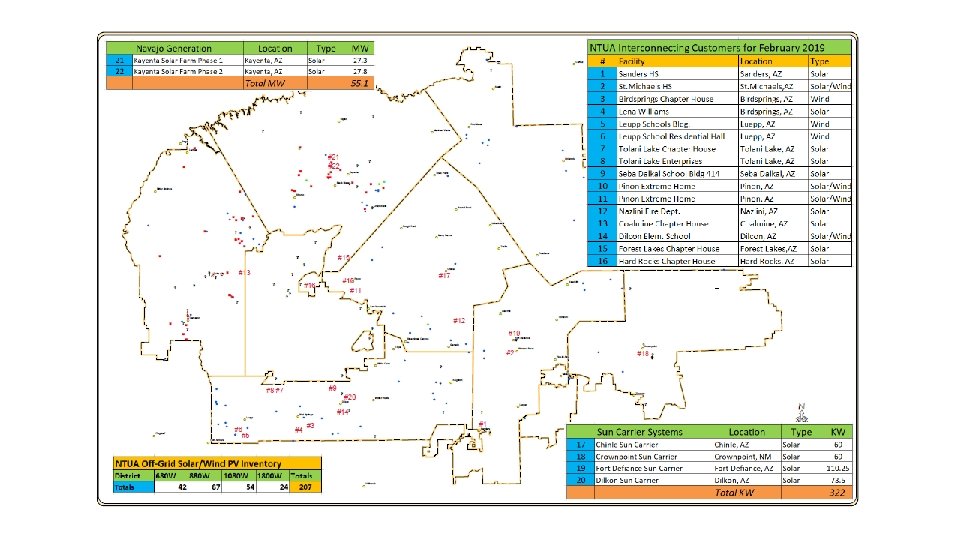
Navajo Tribal Utility Authority • Created in 1959 • A not-for-profit enterprise of the Navajo Nation • Service Territory – 27, 000 square miles across the Navajo Nation • Extends – Electricity, Water, Wastewater Treatment, Natural Gas, Residential Solar services • Recently added: Communications – Internet, Cell Phone, Data Storage Services, Renewable Energy Generation 2
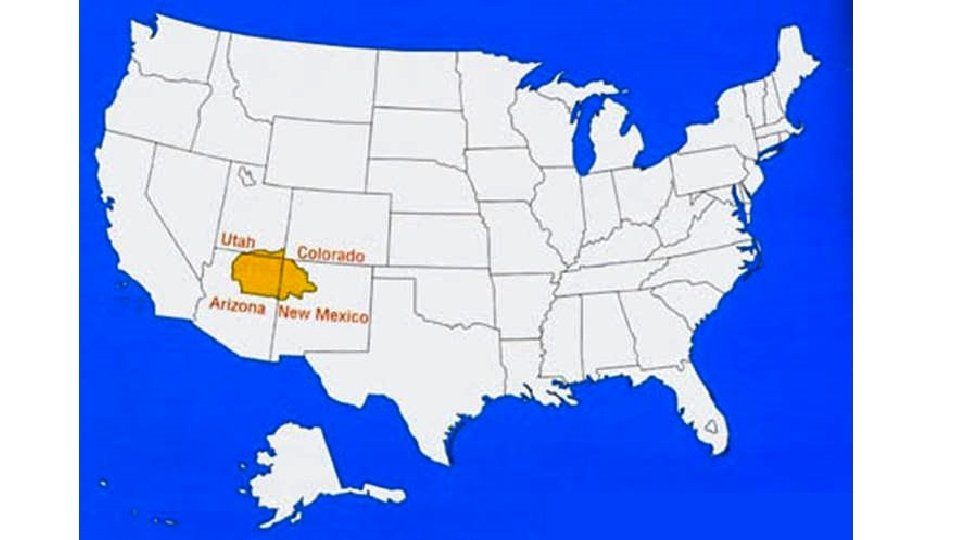
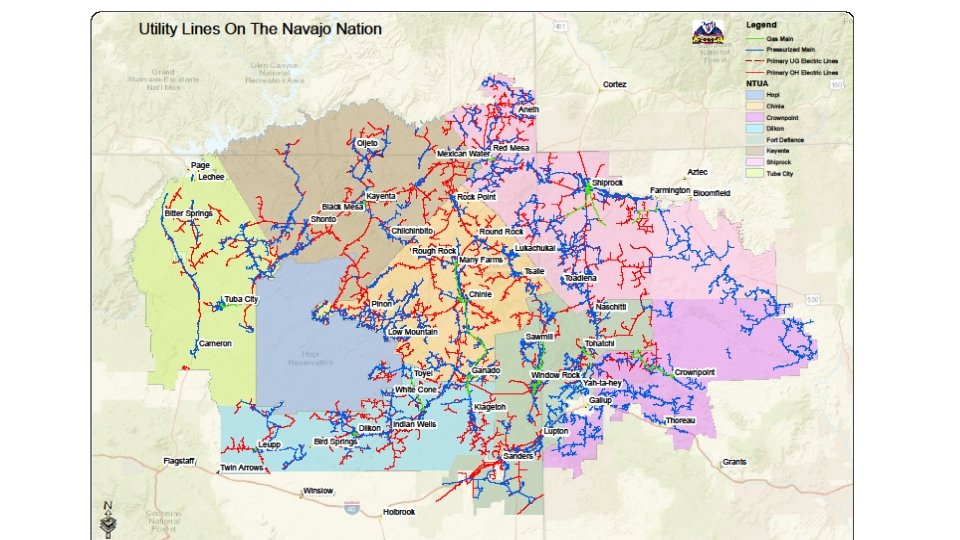

Navajo Nation – Southwest USA • 186, 500 Citizens • Territory larger than West Virginia • Unemployment rate of 48. 5% (9 times current U. S. average) • 38% of Navajo people live below poverty line • Avg per capita income of $10, 695 vs U. S. Avg of $48, 377 31% of all Navajo homes lack plumbing 38% lack water 32% lack electricity 86% lack natural gas 60% lack landline phone services – reducing immediate access to 911 5
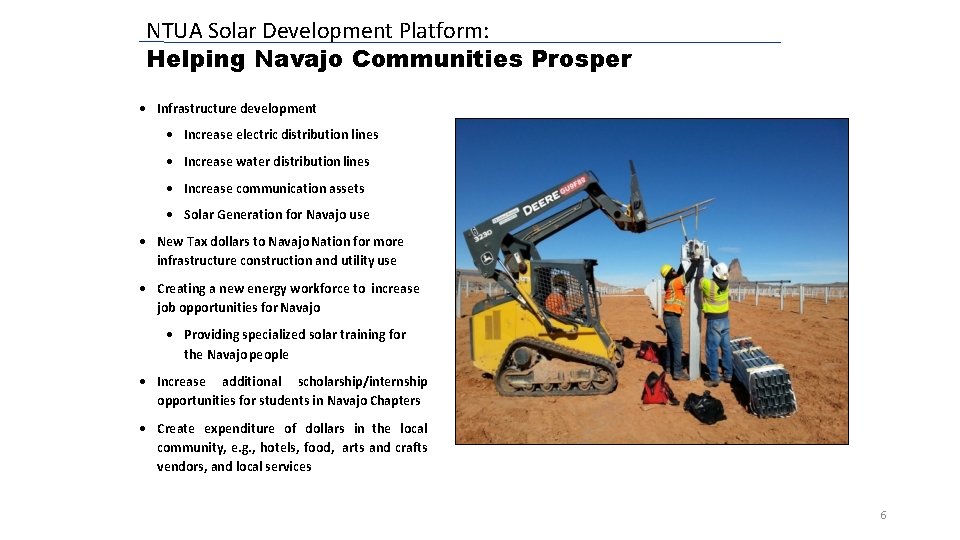
NTUA Solar Development Platform: Helping Navajo Communities Prosper Infrastructure development Increase electric distribution lines Increase water distribution lines Increase communication assets Solar Generation for Navajo use New Tax dollars to Navajo Nation for more infrastructure construction and utility use Creating a new energy workforce to increase job opportunities for Navajo Providing specialized solar training for the Navajo people Increase additional scholarship/internship opportunities for students in Navajo Chapters Create expenditure of dollars in the local community, e. g. , hotels, food, arts and crafts vendors, and local services 6
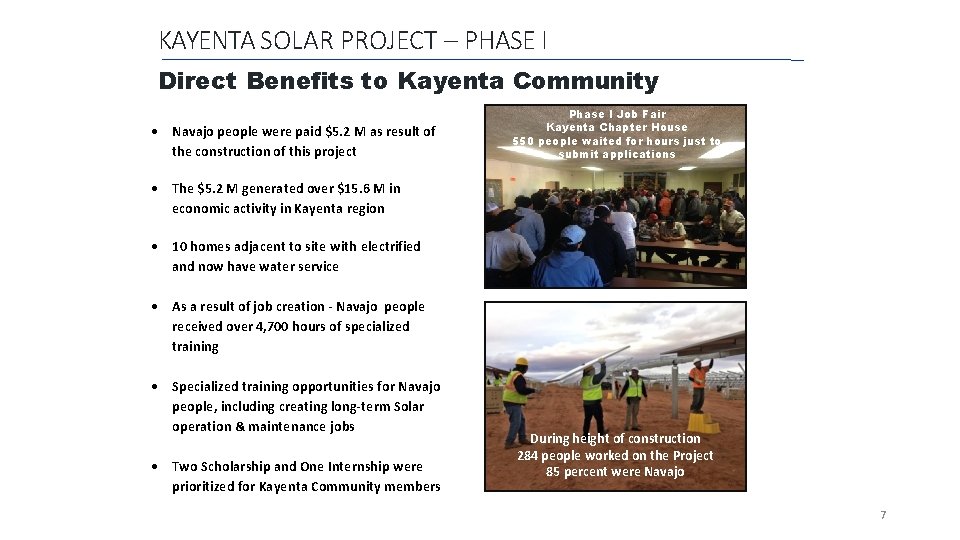
KAYENTA SOLAR PROJECT – PHASE I Direct Benefits to Kayenta Community Navajo people were paid $5. 2 M as result of the construction of this project Phase I Job Fair Kayenta Chapter House 550 people waited for hours just to submit applications The $5. 2 M generated over $15. 6 M in economic activity in Kayenta region 10 homes adjacent to site with electrified and now have water service As a result of job creation - Navajo people received over 4, 700 hours of specialized training Specialized training opportunities for Navajo people, including creating long-term Solar operation & maintenance jobs Two Scholarship and One Internship were prioritized for Kayenta Community members During height of construction 284 people worked on the Project 85 percent were Navajo 7
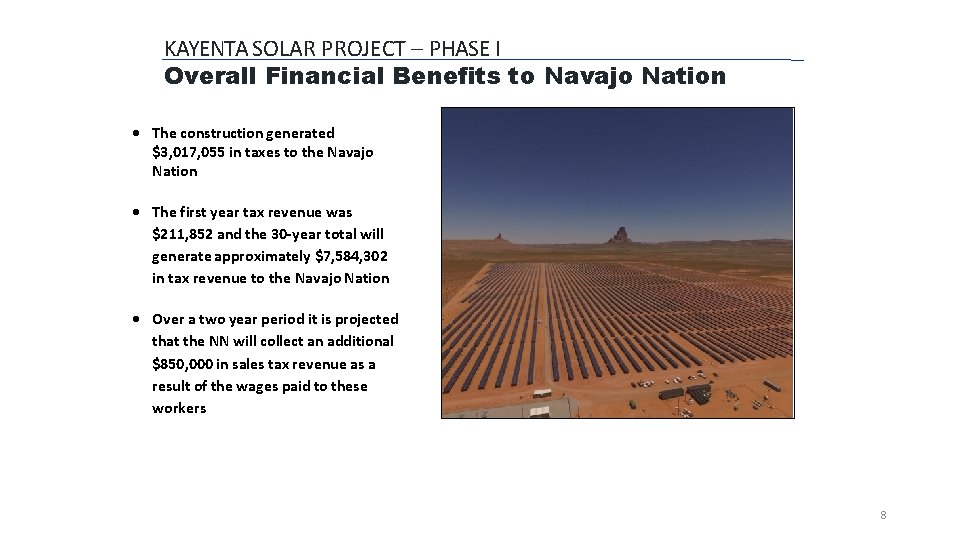
KAYENTA SOLAR PROJECT – PHASE I Overall Financial Benefits to Navajo Nation The construction generated $3, 017, 055 in taxes to the Navajo Nation The first year tax revenue was $211, 852 and the 30 -year total will generate approximately $7, 584, 302 in tax revenue to the Navajo Nation Over a two year period it is projected that the NN will collect an additional $850, 000 in sales tax revenue as a result of the wages paid to these workers 8
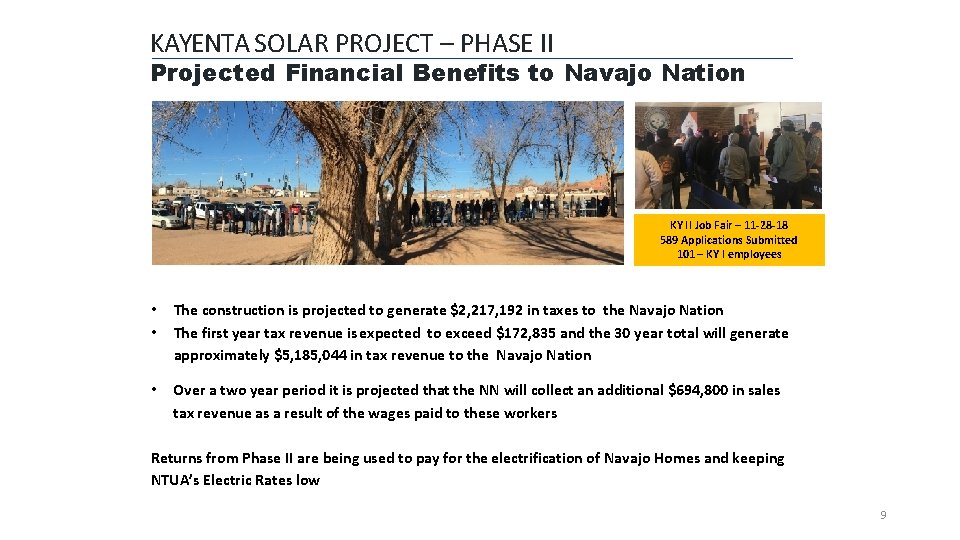
KAYENTA SOLAR PROJECT – PHASE II Projected Financial Benefits to Navajo Nation KY II Job Fair – 11 -28 -18 589 Applications Submitted 101 – KY I employees • • The construction is projected to generate $2, 217, 192 in taxes to the Navajo Nation The first year tax revenue is expected to exceed $172, 835 and the 30 year total will generate approximately $5, 185, 044 in tax revenue to the Navajo Nation • Over a two year period it is projected that the NN will collect an additional $694, 800 in sales tax revenue as a result of the wages paid to these workers Returns from Phase II are being used to pay for the electrification of Navajo Homes and keeping NTUA’s Electric Rates low 9
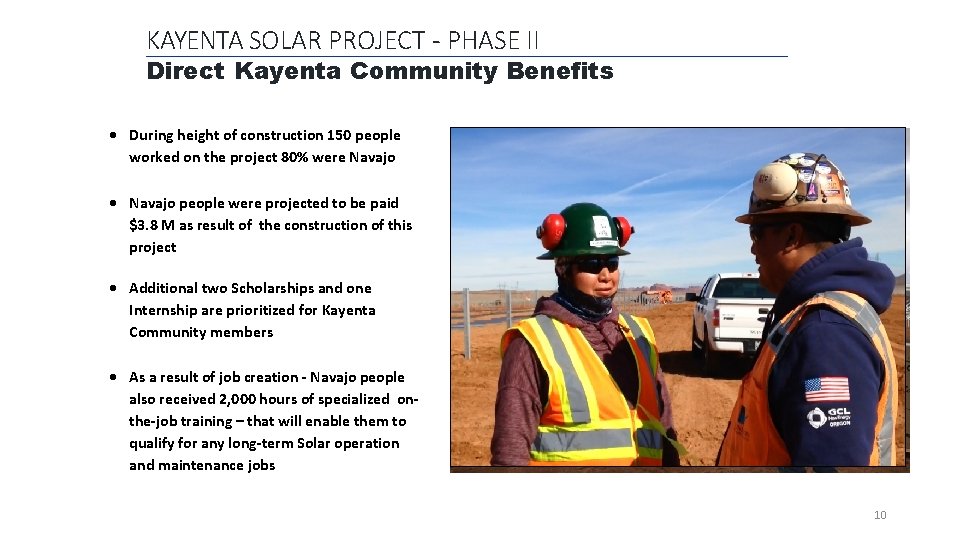
KAYENTA SOLAR PROJECT - PHASE II Direct Kayenta Community Benefits During height of construction 150 people worked on the project 80% were Navajo people were projected to be paid $3. 8 M as result of the construction of this project Additional two Scholarships and one Internship are prioritized for Kayenta Community members As a result of job creation - Navajo people also received 2, 000 hours of specialized onthe-job training – that will enable them to qualify for any long-term Solar operation and maintenance jobs 10
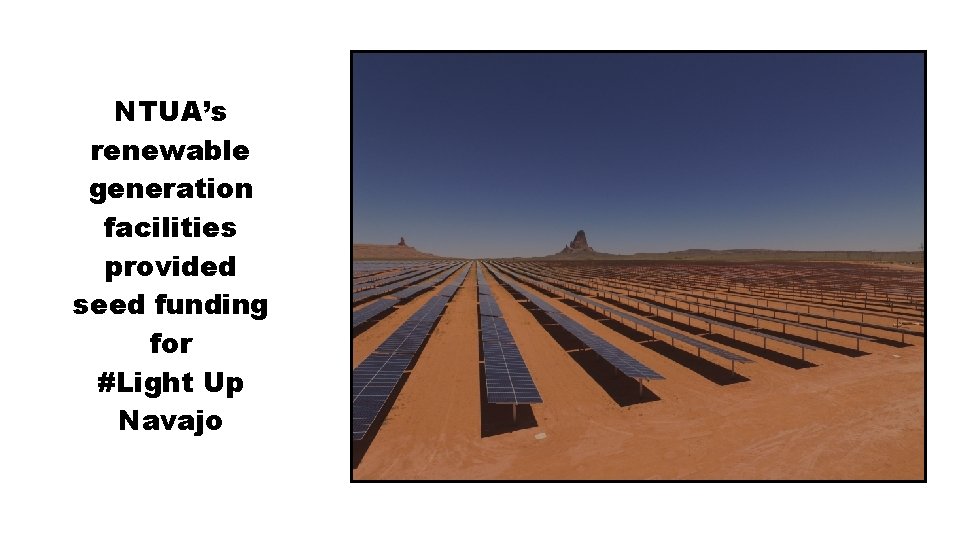
NTUA’s renewable generation facilities provided seed funding for #Light Up Navajo
15
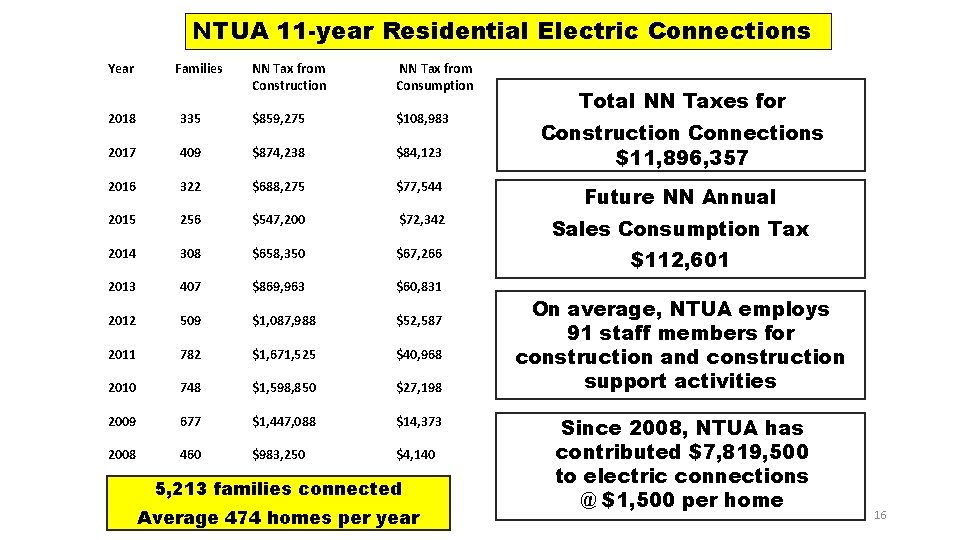
NTUA 11 -year Residential Electric Connections Year Families NN Tax from Construction NN Tax from Consumption Total NN Taxes for 2018 335 $859, 275 $108, 983 2017 409 $874, 238 $84, 123 2016 322 $688, 275 $77, 544 Future NN Annual 2015 256 $547, 200 $72, 342 Sales Consumption Tax 2014 308 $658, 350 $67, 266 $112, 601 2013 407 $869, 963 $60, 831 2012 509 $1, 087, 988 $52, 587 2011 782 $1, 671, 525 $40, 968 2010 748 $1, 598, 850 $27, 198 2009 677 $1, 447, 088 $14, 373 2008 460 $983, 250 $4, 140 5, 213 families connected Average 474 homes per year Construction Connections $11, 896, 357 On average, NTUA employs 91 staff members for construction and construction support activities Since 2008, NTUA has contributed $7, 819, 500 Tot to electric connections @ $1, 500 per home 16
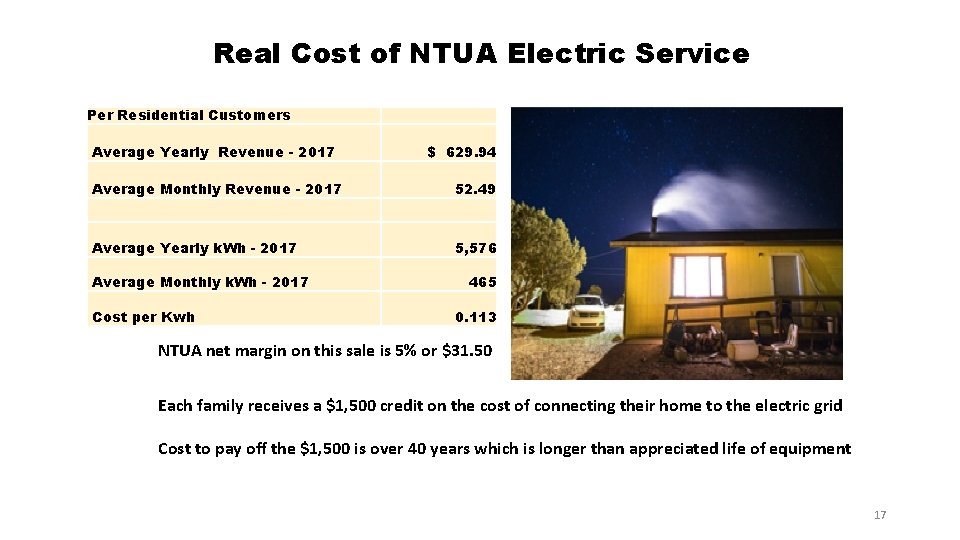
Real Cost of NTUA Electric Service Per Residential Customers Average Yearly Revenue - 2017 $ 629. 94 Average Monthly Revenue - 2017 52. 49 Average Yearly k. Wh - 2017 5, 576 Average Monthly k. Wh - 2017 Cost per Kwh 465 0. 113 NTUA net margin on this sale is 5% or $31. 50 Each family receives a $1, 500 credit on the cost of connecting their home to the electric grid Cost to pay off the $1, 500 is over 40 years which is longer than appreciated life of equipment 17
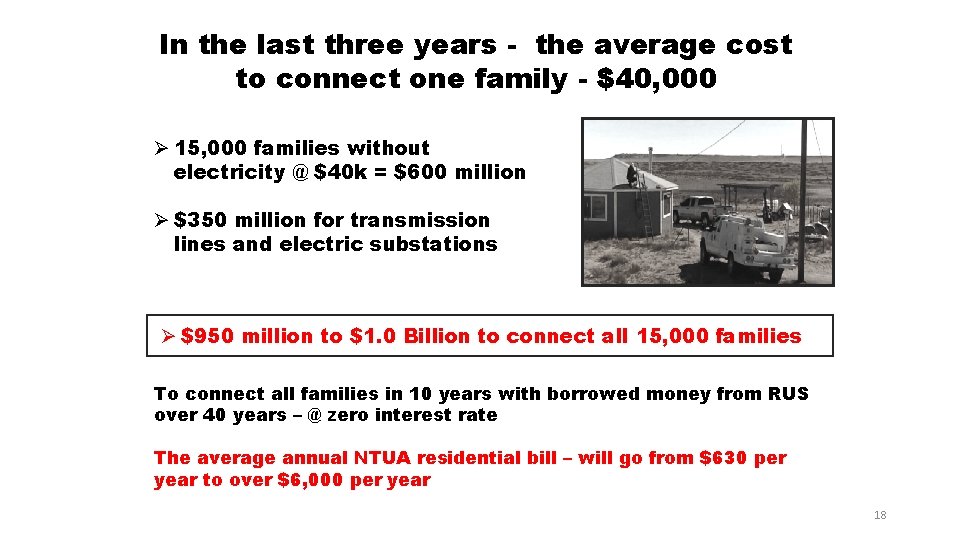
In the last three years - the average cost to connect one family - $40, 000 Ø 15, 000 families without electricity @ $40 k = $600 million Ø $350 million for transmission lines and electric substations Ø $950 million to $1. 0 Billion to connect all 15, 000 families To connect all families in 10 years with borrowed money from RUS over 40 years – @ zero interest rate The average annual NTUA residential bill – will go from $630 per year to over $6, 000 per year 18
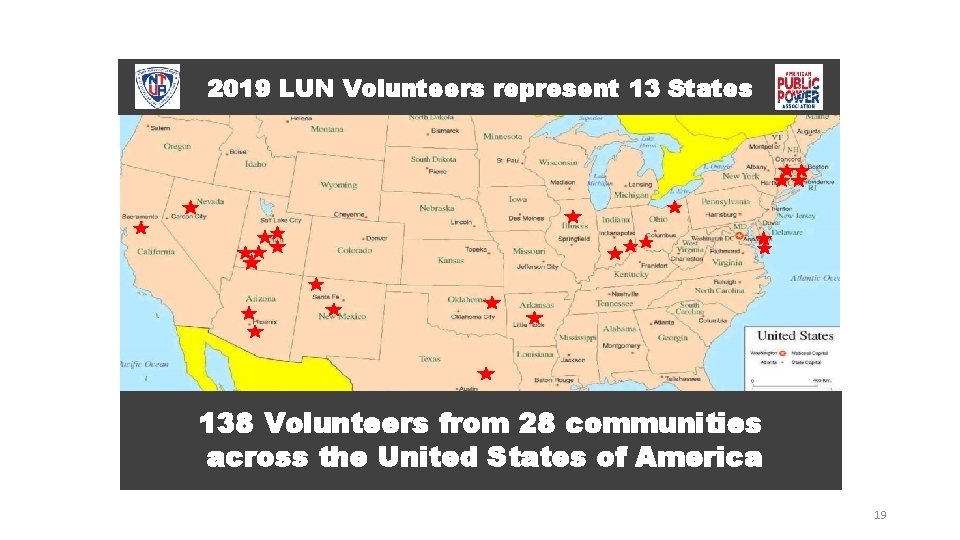
2019 LUN Volunteers represent 13 States 138 Volunteers from 28 communities across the United States of America 19
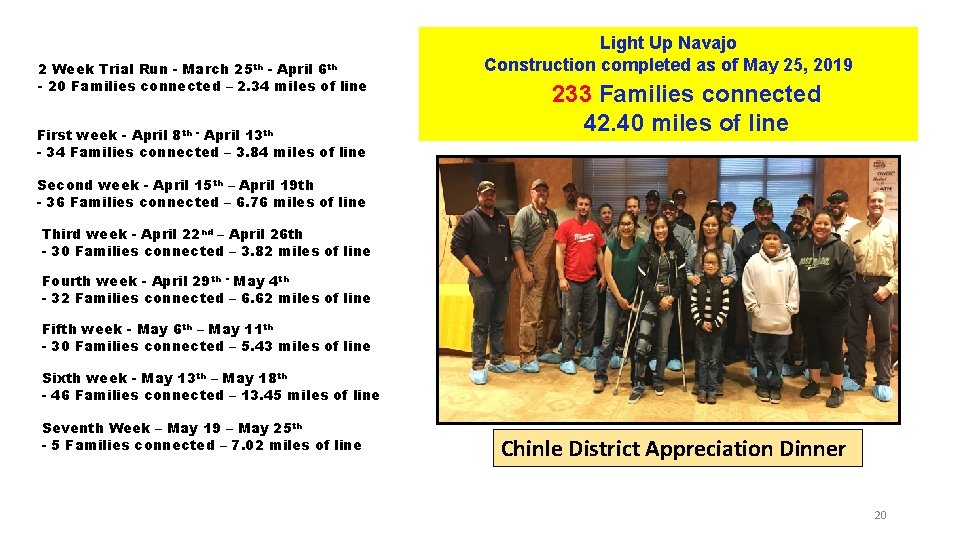
2 Week Trial Run - March 25 th - April 6 th - 20 Families connected – 2. 34 miles of line First week - April 8 th - April 13 th - 34 Families connected – 3. 84 miles of line Light Up Navajo Construction completed as of May 25, 2019 233 Families connected 42. 40 miles of line Second week - April 15 th – April 19 th - 36 Families connected – 6. 76 miles of line Third week - April 22 nd – April 26 th - 30 Families connected – 3. 82 miles of line Fourth week - April 29 th - May 4 th - 32 Families connected – 6. 62 miles of line Fifth week - May 6 th – May 11 th - 30 Families connected – 5. 43 miles of line Sixth week - May 13 th – May 18 th - 46 Families connected – 13. 45 miles of line Seventh Week – May 19 – May 25 th - 5 Families connected – 7. 02 miles of line Chinle District Appreciation Dinner 20
- Slides: 20