
NTU Taida Institute for Mathematical Sciences TIMS November
NTU, Taida Institute for Mathematical Sciences (TIMS) November 4 th, 2015 Including groundwater in land surface models for hydrologic and climatic applications Agnès DUCHARNE Senior scientist at CNRS (Centre National de la Recherche Scientifique) METIS Laboratory, Université Pierre et Marie Curie, Paris Agnes. Ducharne@upmc. fr 1
Outline 1. Introduction: what are land surface models (LSMs) ? and why groundwater (GW) may be important ? 2. GW effect on surface hydrology: with the Catchment LSM 3. GW effect on climate: with the ORCHIDEE LSM 4. Perspectives 2
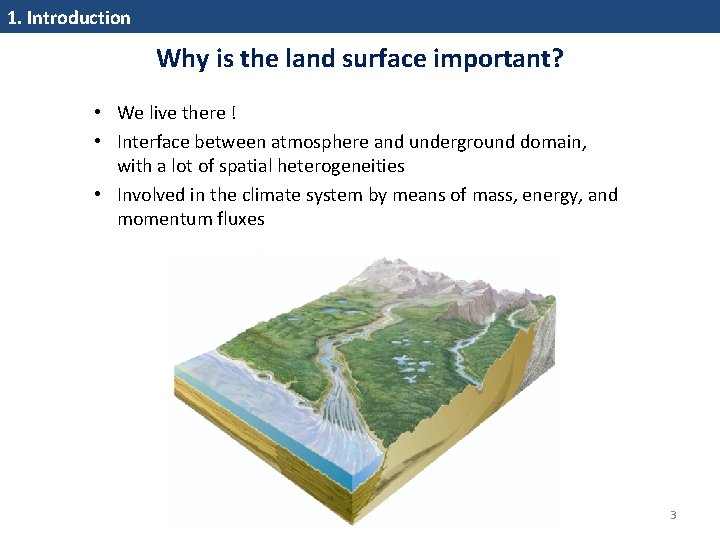
1. Introduction Why is the land surface important? • We live there ! • Interface between atmosphere and underground domain, with a lot of spatial heterogeneities • Involved in the climate system by means of mass, energy, and momentum fluxes 3
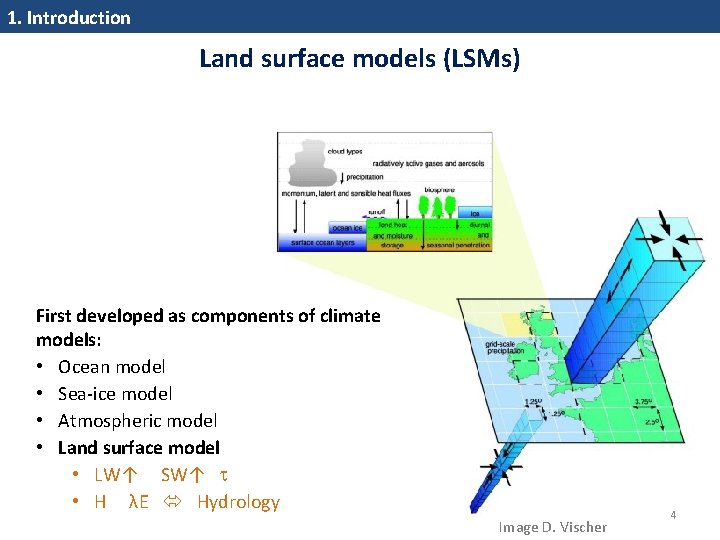
1. Introduction Land surface models (LSMs) First developed as components of climate models: • Ocean model • Sea‐ice model • Atmospheric model • Land surface model • LW↑ SW↑ • H λE Hydrology Image D. Vischer 4
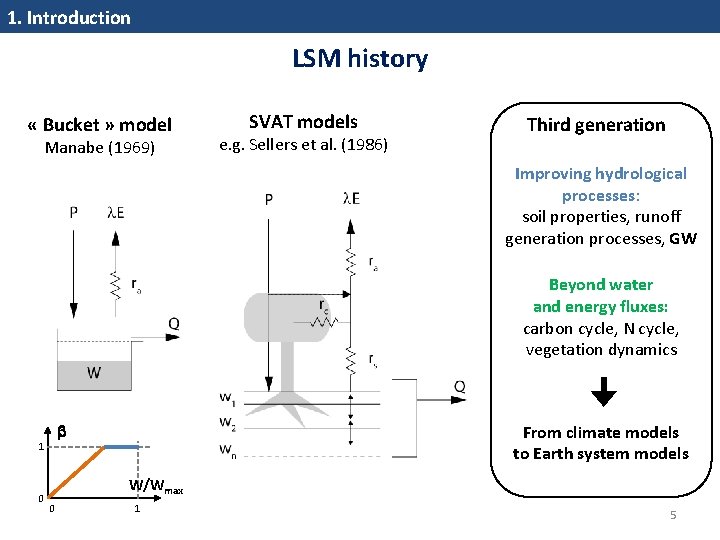
1. Introduction LSM history « Bucket » model Manabe (1969) SVAT models e. g. Sellers et al. (1986) Third generation Improving hydrological processes: soil properties, runoff generation processes, GW Beyond water and energy fluxes: carbon cycle, N cycle, vegetation dynamics 1 0 From climate models to Earth system models W/Wmax 0 1 5
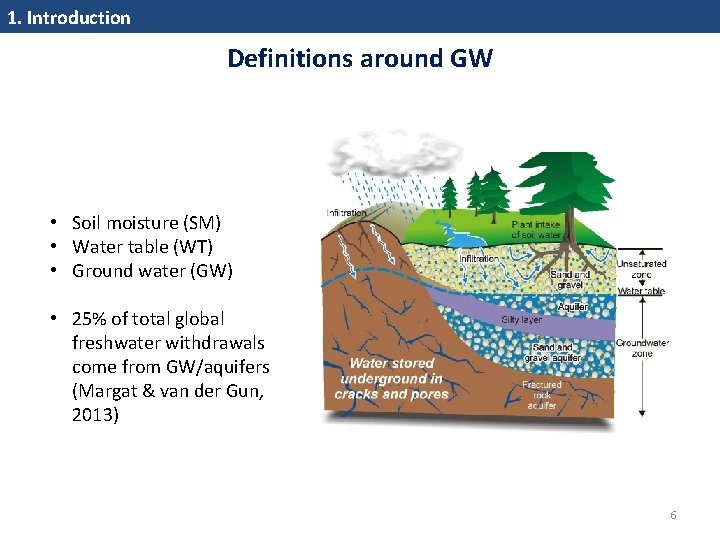
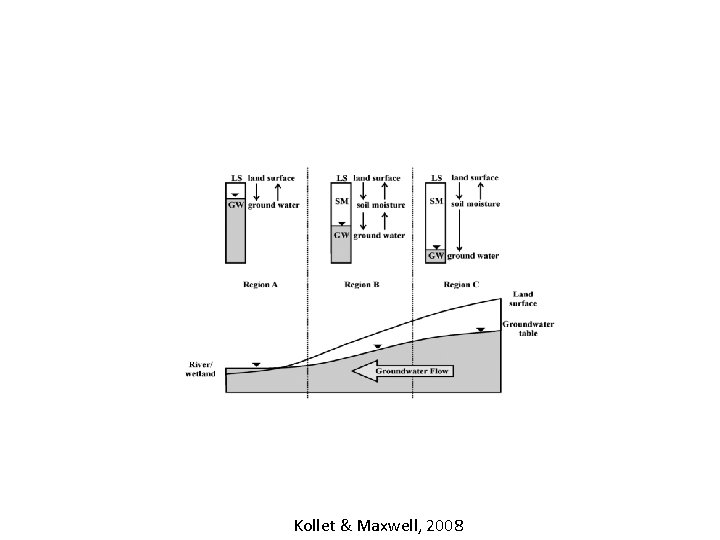
1. Introduction Definitions around GW • Soil moisture (SM) • Water table (WT) • Ground water (GW) • 25% of total global freshwater withdrawals come from GW/aquifers (Margat & van der Gun, 2013) 6
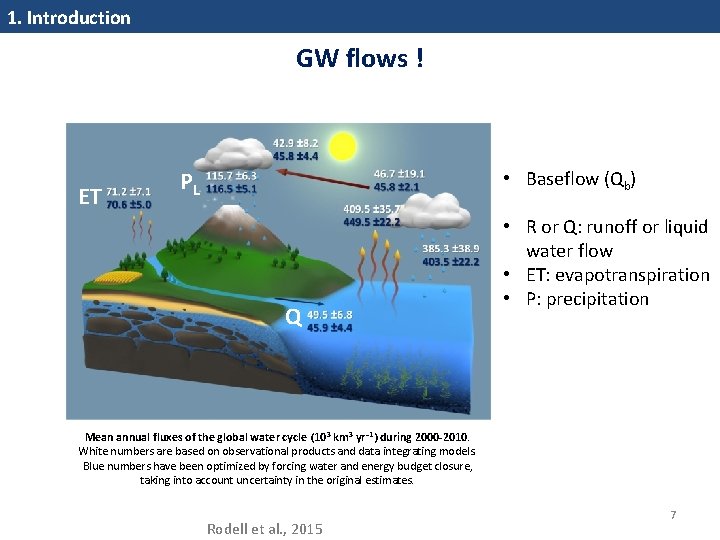
1. Introduction GW flows ! ET PL • Baseflow (Qb) Q • R or Q: runoff or liquid water flow • ET: evapotranspiration • P: precipitation Mean annual fluxes of the global water cycle (10 3 km 3 yr− 1) during 2000 -2010. White numbers are based on observational products and data integrating models. Blue numbers have been optimized by forcing water and energy budget closure, taking into account uncertainty in the original estimates. Rodell et al. , 2015 7
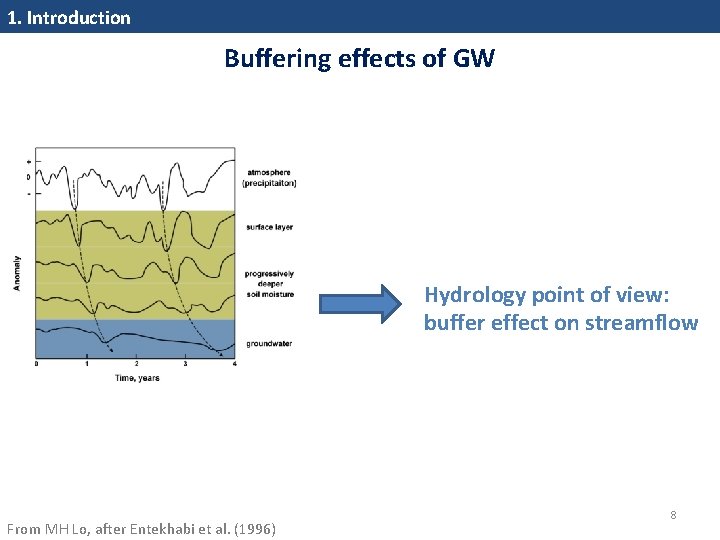
1. Introduction Buffering effects of GW Hydrology point of view: buffer effect on streamflow From MH Lo, after Entekhabi et al. (1996) 8
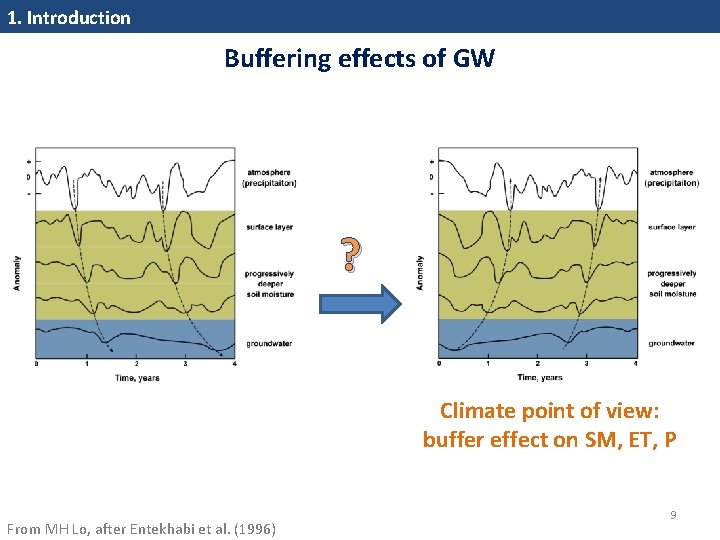
1. Introduction Buffering effects of GW ? Climate point of view: buffer effect on SM, ET, P From MH Lo, after Entekhabi et al. (1996) 9
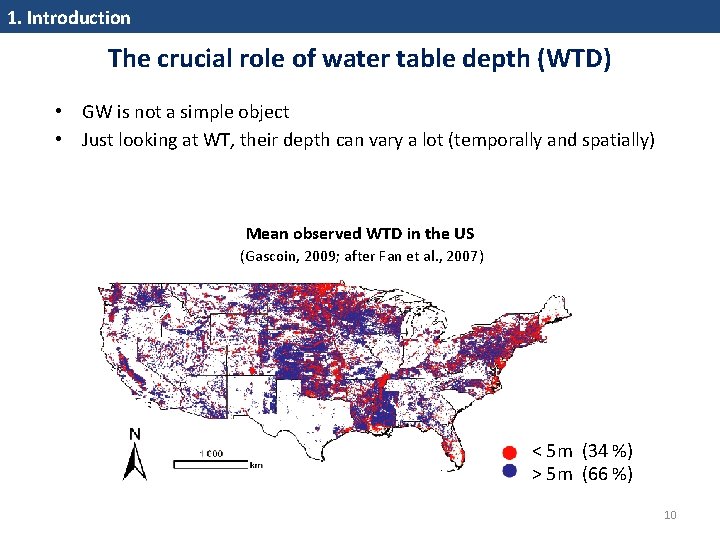
1. Introduction The crucial role of water table depth (WTD) • GW is not a simple object • Just looking at WT, their depth can vary a lot (temporally and spatially) Mean observed WTD in the US (Gascoin, 2009; after Fan et al. , 2007) < 5 m (34 %) > 5 m (66 %) 10
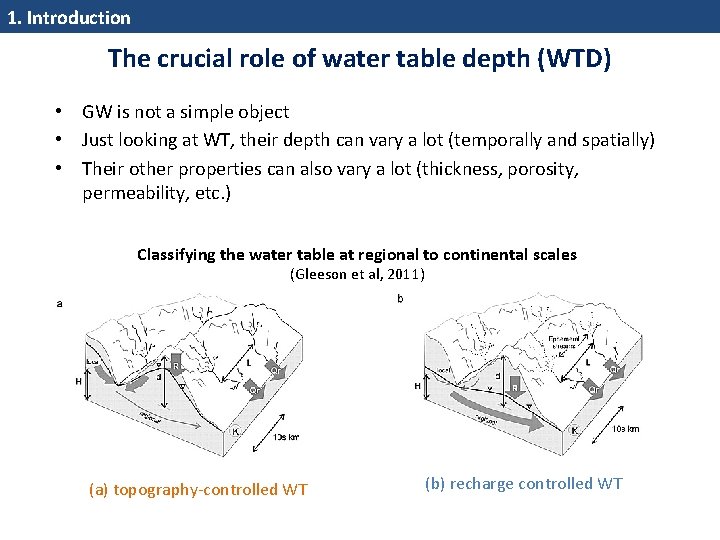
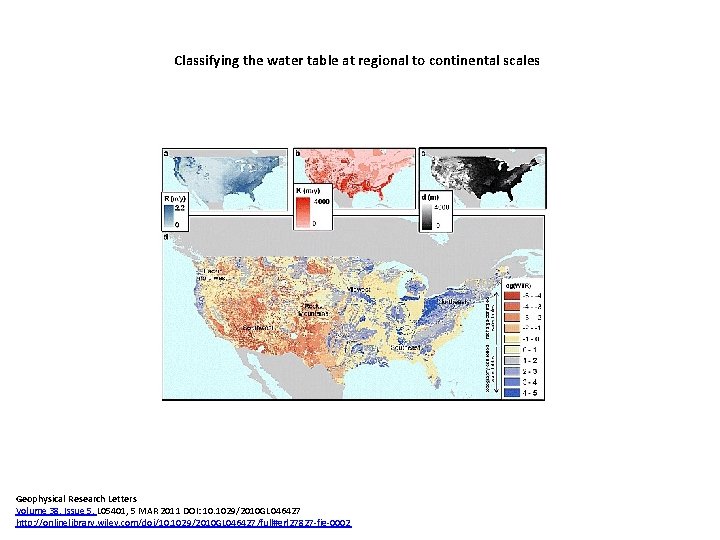
1. Introduction The crucial role of water table depth (WTD) • GW is not a simple object • Just looking at WT, their depth can vary a lot (temporally and spatially) • Their other properties can also vary a lot (thickness, porosity, permeability, etc. ) Classifying the water table at regional to continental scales (Gleeson et al, 2011) (a) topography‐controlled WT (b) recharge controlled WT
Outline 1. Introduction: what are land surface models (LSMs) ? and why may groundwater (GW) be important ? 2. GW effect on surface hydrology: with the Catchment LSM • Model summary • Two «off‐line» studies in Northern France 3. GW effect on climate: with the ORCHIDEE LSM 4. Perspectives 12
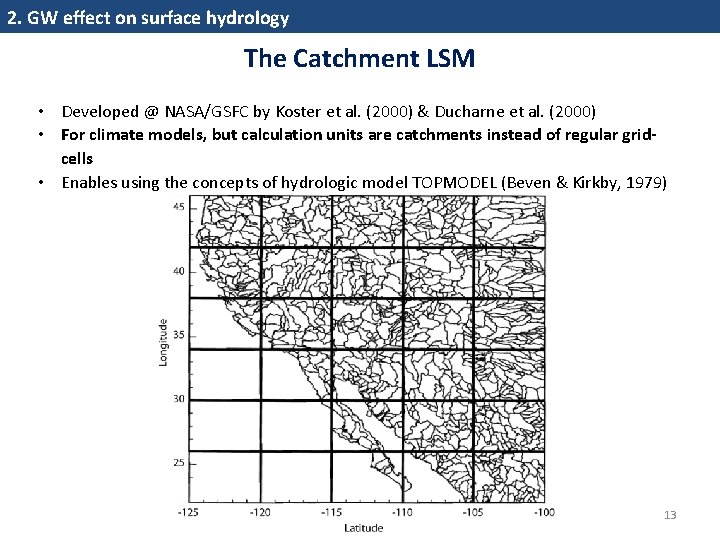
2. GW effect on surface hydrology The Catchment LSM • Developed @ NASA/GSFC by Koster et al. (2000) & Ducharne et al. (2000) • For climate models, but calculation units are catchments instead of regular gridcells • Enables using the concepts of hydrologic model TOPMODEL (Beven & Kirkby, 1979) 13
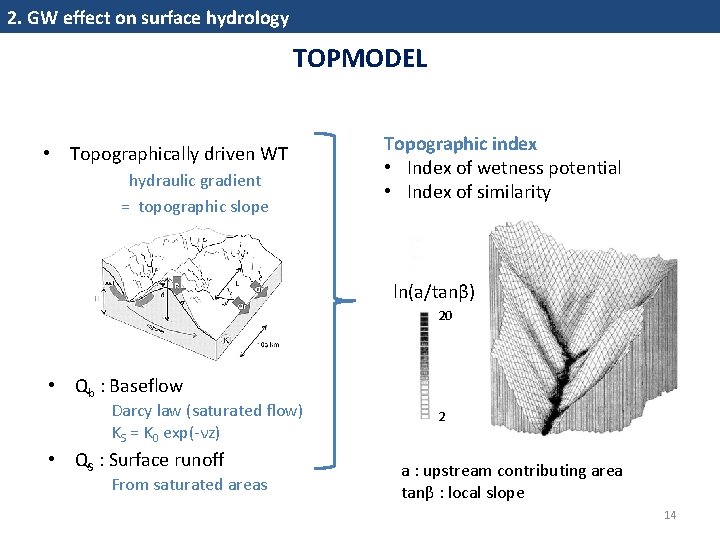
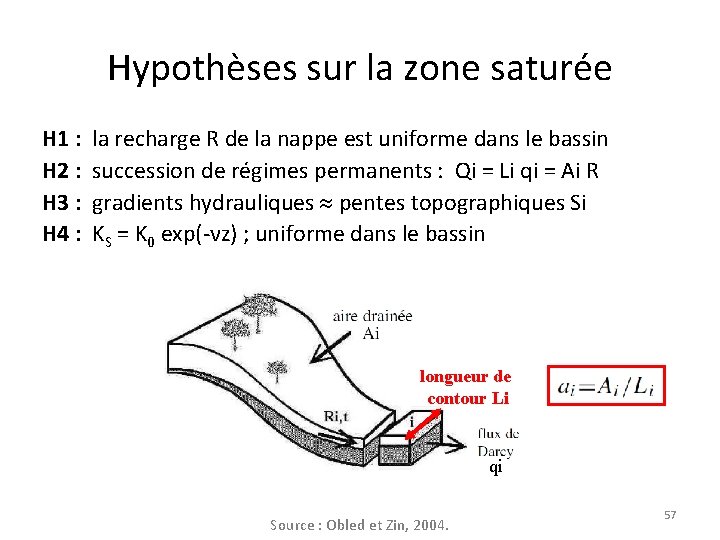
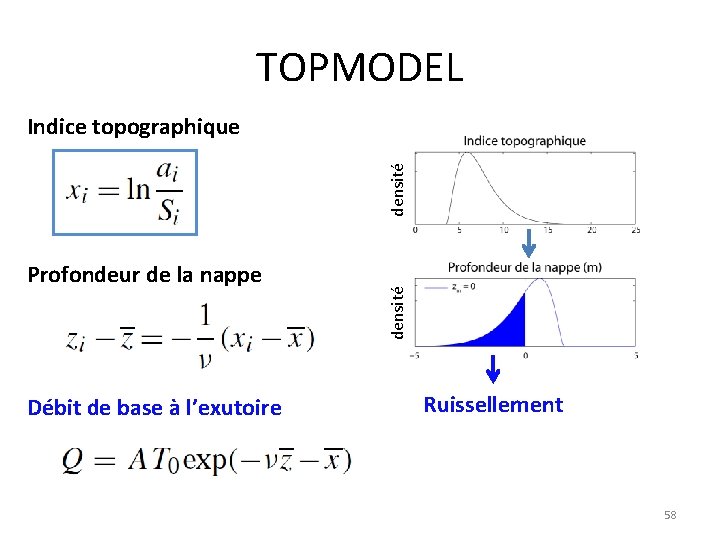
2. GW effect on surface hydrology TOPMODEL • Topographically driven WT hydraulic gradient = topographic slope Topographic index • Index of wetness potential • Index of similarity ln(a/tanβ) 20 • Qb : Baseflow Darcy law (saturated flow) KS = K 0 exp(‐νz) • QS : Surface runoff From saturated areas 2 a : upstream contributing area tanβ : local slope 14
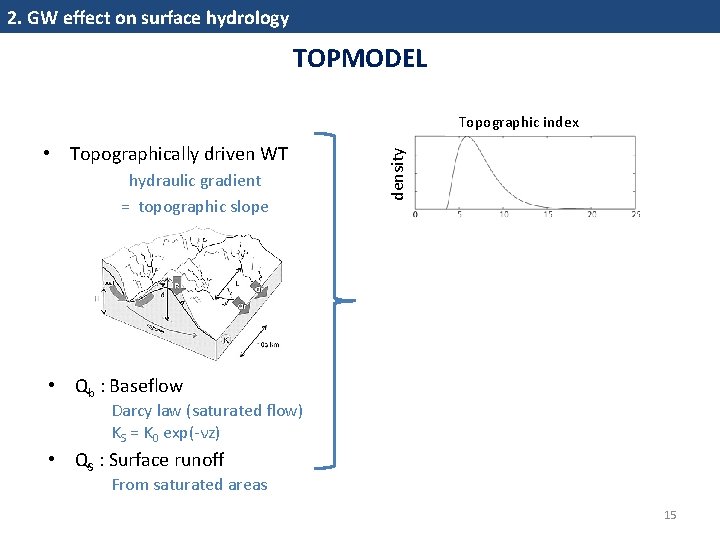
2. GW effect on surface hydrology TOPMODEL • Topographically driven WT hydraulic gradient = topographic slope density Topographic index • Qb : Baseflow Darcy law (saturated flow) KS = K 0 exp(‐νz) • QS : Surface runoff From saturated areas 15
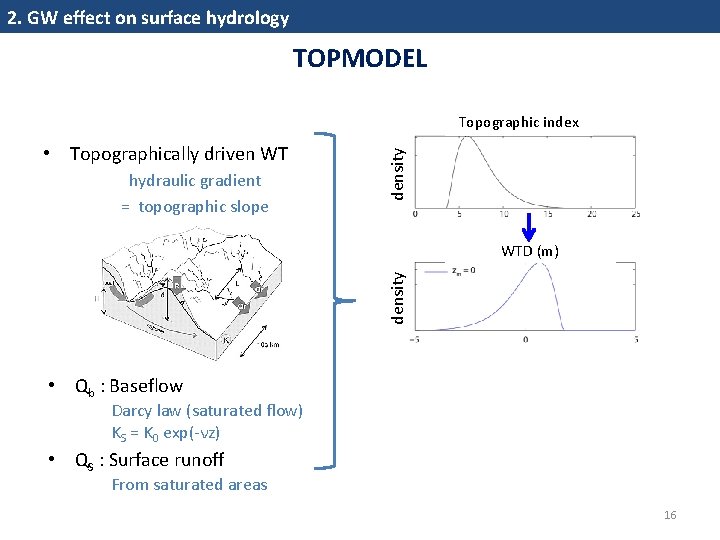
2. GW effect on surface hydrology TOPMODEL • Topographically driven WT hydraulic gradient = topographic slope density Topographic index density WTD (m) • Qb : Baseflow Darcy law (saturated flow) KS = K 0 exp(‐νz) • QS : Surface runoff From saturated areas 16
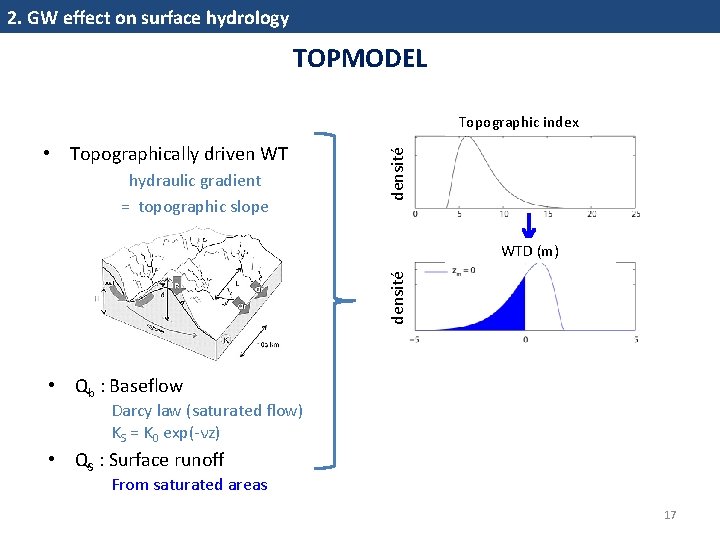
2. GW effect on surface hydrology TOPMODEL • Topographically driven WT hydraulic gradient = topographic slope densité Topographic index densité WTD (m) • Qb : Baseflow Darcy law (saturated flow) KS = K 0 exp(‐νz) • QS : Surface runoff From saturated areas 17
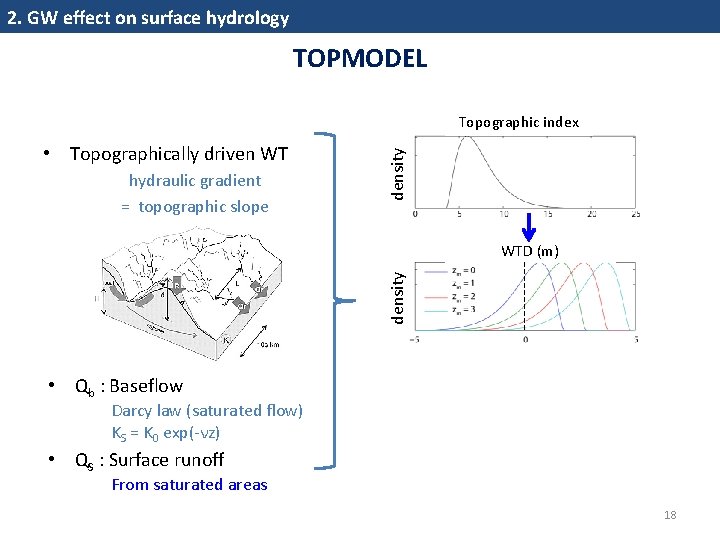
2. GW effect on surface hydrology TOPMODEL • Topographically driven WT hydraulic gradient = topographic slope density Topographic index density WTD (m) • Qb : Baseflow Darcy law (saturated flow) KS = K 0 exp(‐νz) • QS : Surface runoff From saturated areas 18
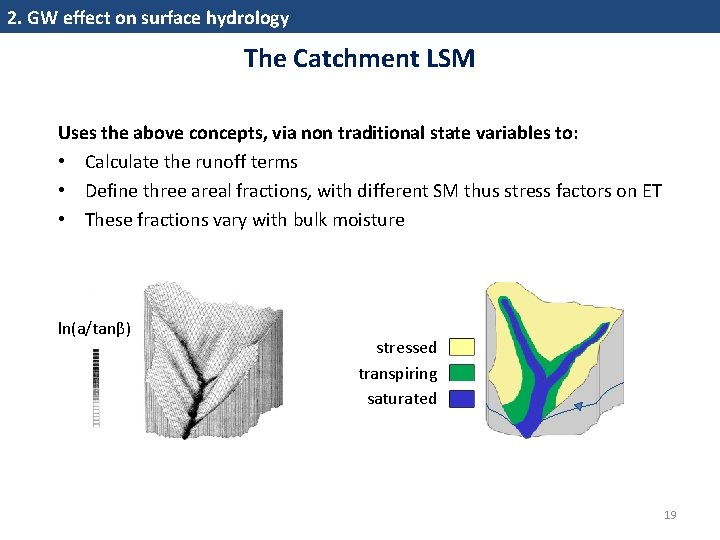
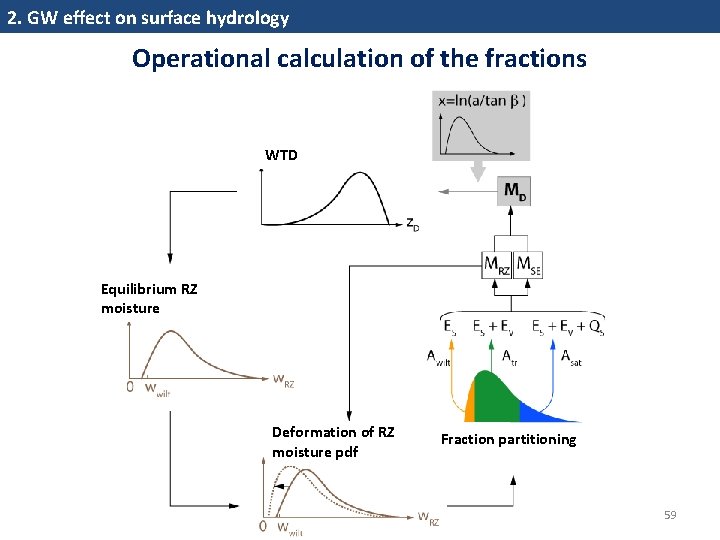
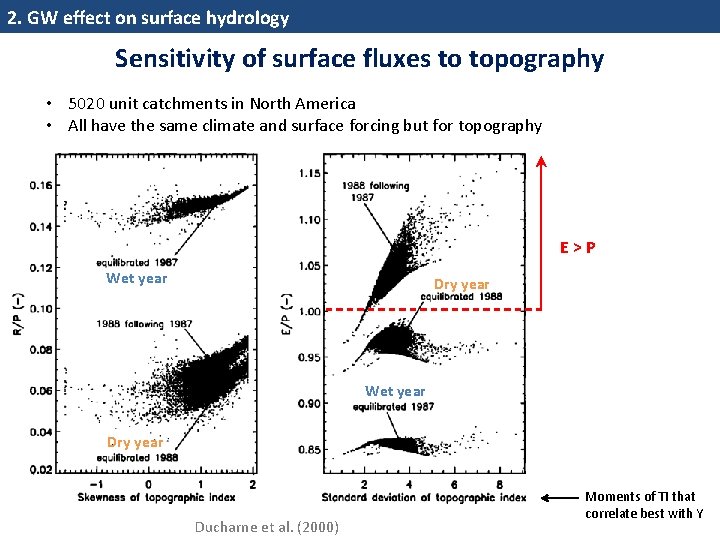
2. GW effect on surface hydrology The Catchment LSM Uses the above concepts, via non traditional state variables to: • Calculate the runoff terms • Define three areal fractions, with different SM thus stress factors on ET • These fractions vary with bulk moisture ln(a/tanβ) stressed transpiring saturated 19
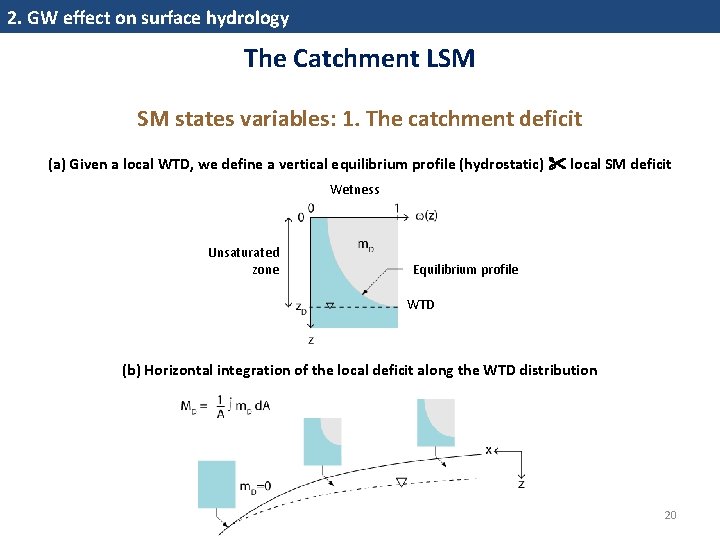
2. GW effect on surface hydrology The Catchment LSM SM states variables: 1. The catchment deficit (a) Given a local WTD, we define a vertical equilibrium profile (hydrostatic) local SM deficit Wetness Unsaturated zone Equilibrium profile WTD (b) Horizontal integration of the local deficit along the WTD distribution 20
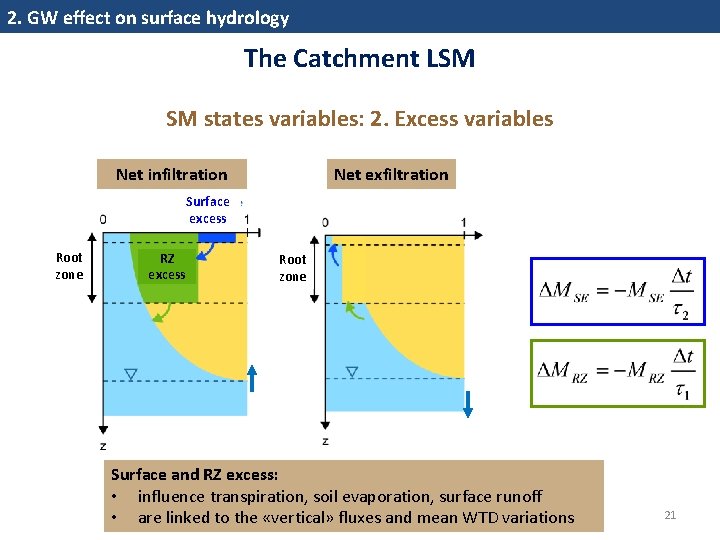
2. GW effect on surface hydrology The Catchment LSM SM states variables: 2. Excess variables Net infiltration Net exfiltration Surface excess Root zone RZ excess Root zone Surface and RZ excess: • influence transpiration, soil evaporation, surface runoff • are linked to the «vertical» fluxes and mean WTD variations 21
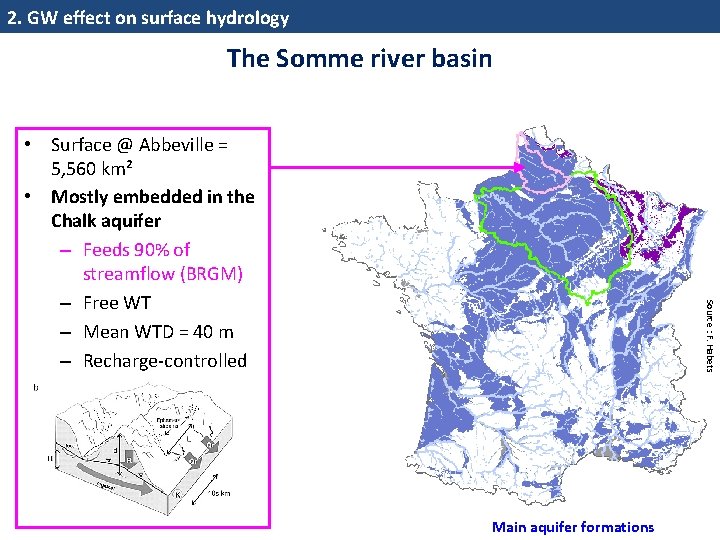
2. GW effect on surface hydrology The Somme river basin Source : F. Habets • Surface @ Abbeville = 5, 560 km² • Mostly embedded in the Chalk aquifer – Feeds 90% of streamflow (BRGM) – Free WT – Mean WTD = 40 m – Recharge‐controlled Main aquifer formations
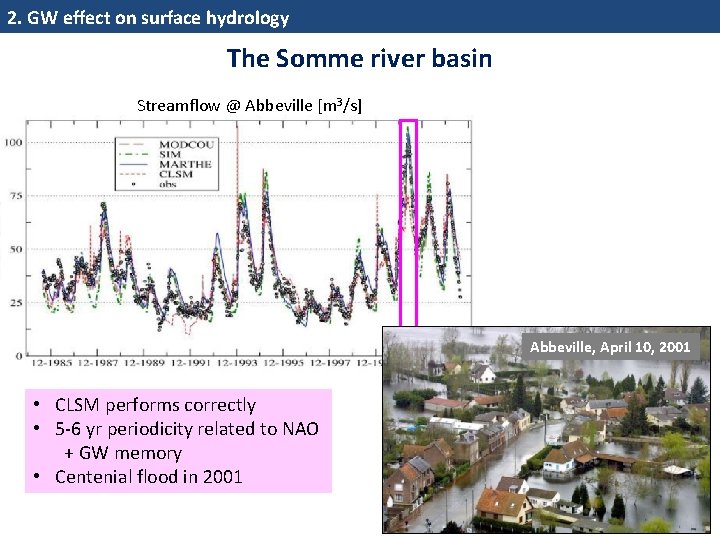
2. GW effect on surface hydrology The Somme river basin Streamflow @ Abbeville [m 3/s] Abbeville, April 10, 2001 • CLSM performs correctly • 5‐ 6 yr periodicity related to NAO + GW memory • Centenial flood in 2001 23
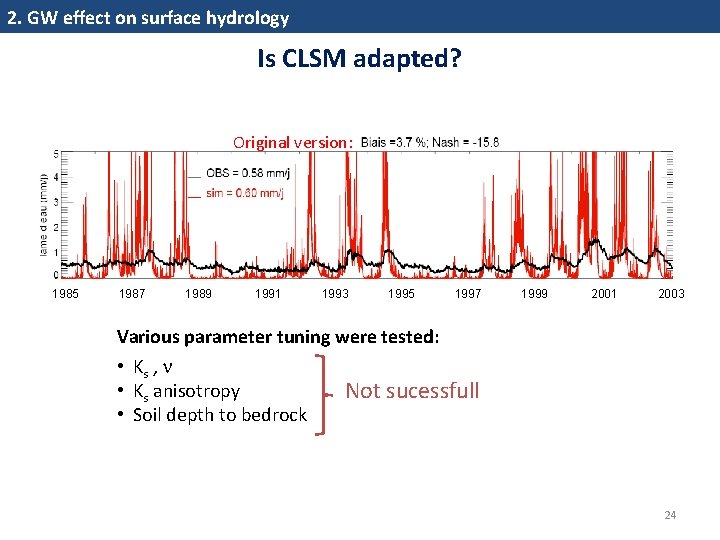
2. GW effect on surface hydrology Is CLSM adapted? Original version: 1985 1987 1989 1991 1993 1995 1997 1999 2001 2003 Various parameter tuning were tested: • Ks , • Ks anisotropy • Soil depth to bedrock Not sucessfull 24
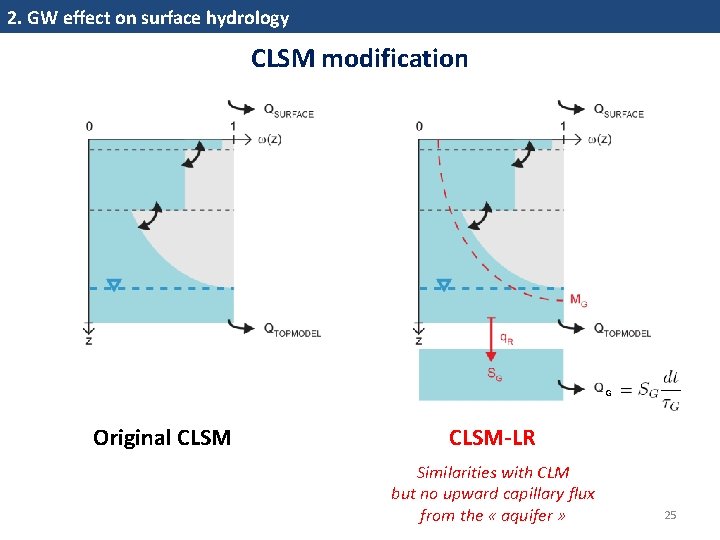
2. GW effect on surface hydrology CLSM modification G Original CLSM-LR Similarities with CLM but no upward capillary flux from the « aquifer » 25
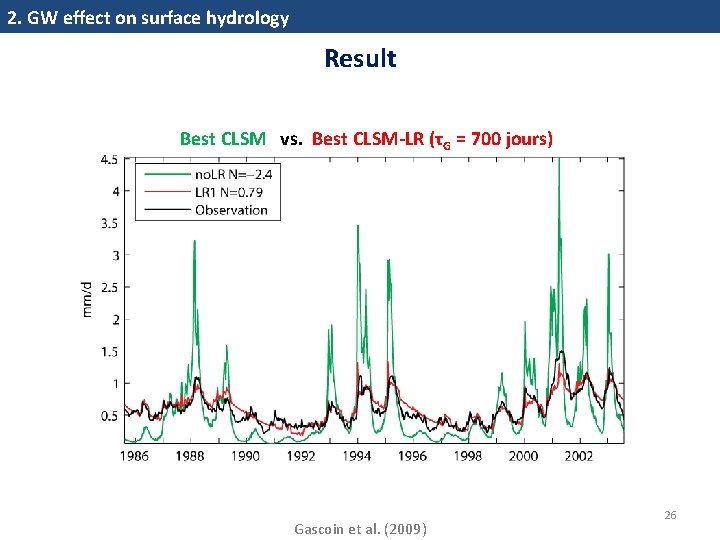
2. GW effect on surface hydrology Result Best CLSM vs. Best CLSM-LR (τG = 700 jours) Gascoin et al. (2009) 26
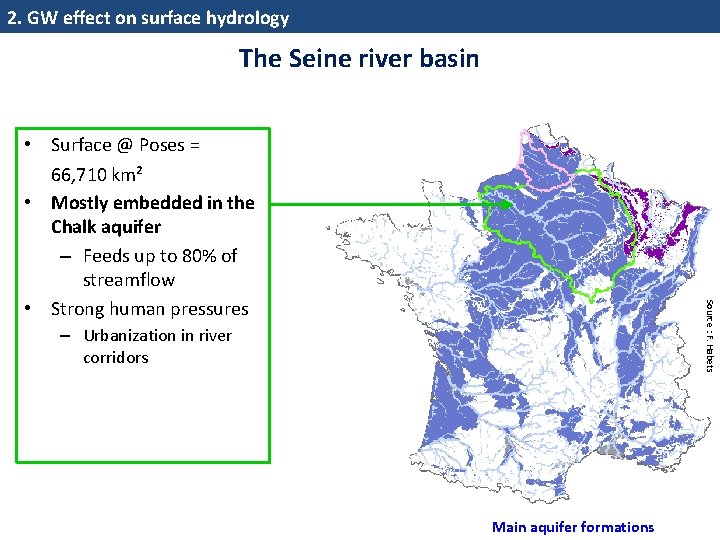
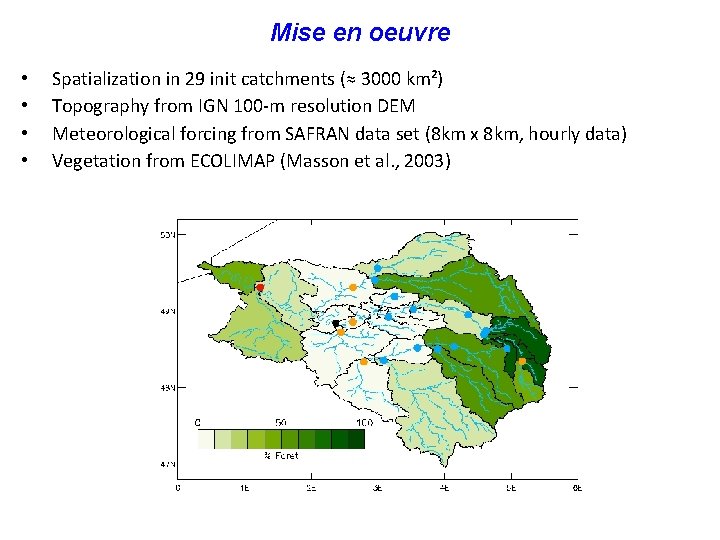
2. GW effect on surface hydrology The Seine river basin Source : F. Habets • Surface @ Poses = 66, 710 km² • Mostly embedded in the Chalk aquifer – Feeds up to 80% of streamflow • Strong human pressures – Urbanization in river corridors Main aquifer formations
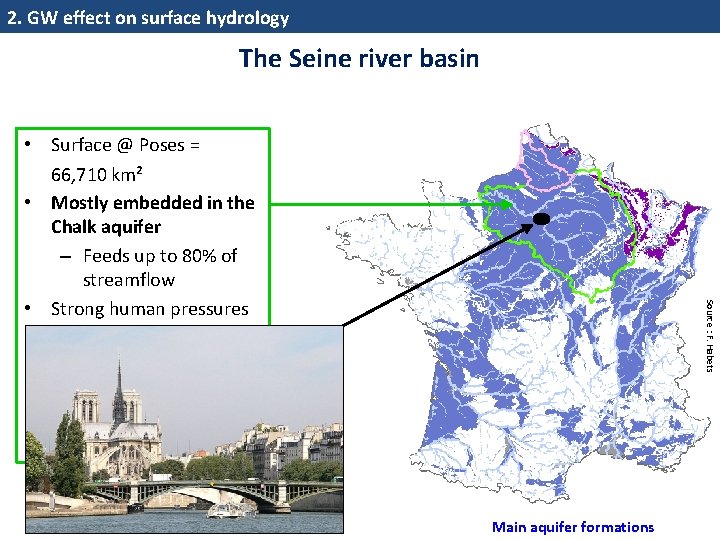
2. GW effect on surface hydrology The Seine river basin Source : F. Habets • Surface @ Poses = 66, 710 km² • Mostly embedded in the Chalk aquifer – Feeds up to 80% of streamflow • Strong human pressures – Urbanization in river corridors – Intensive agriculture Main aquifer formations
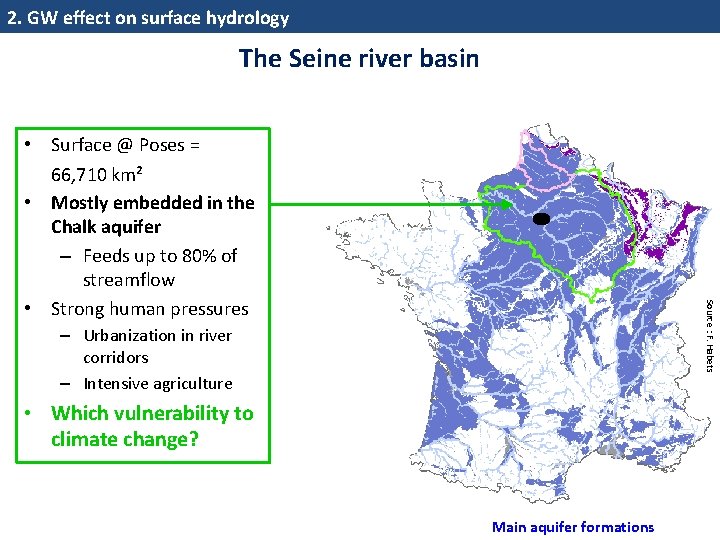
2. GW effect on surface hydrology The Seine river basin Source : F. Habets • Surface @ Poses = 66, 710 km² • Mostly embedded in the Chalk aquifer – Feeds up to 80% of streamflow • Strong human pressures – Urbanization in river corridors – Intensive agriculture • Which vulnerability to climate change? Main aquifer formations
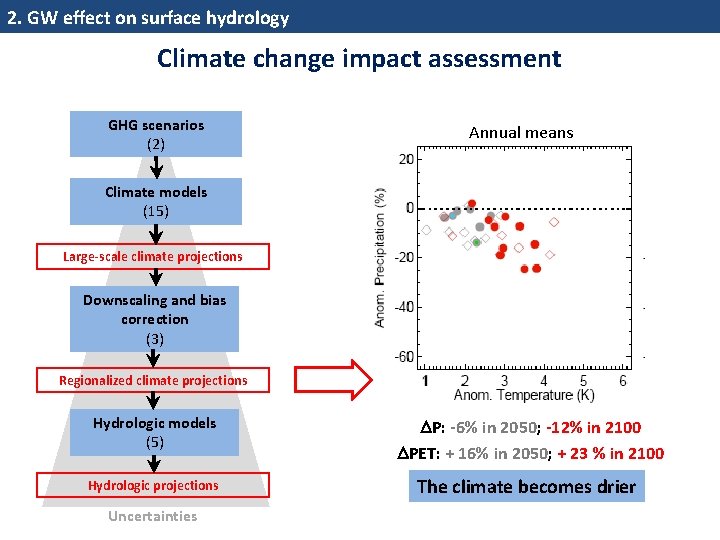
2. GW effect on surface hydrology Climate change impact assessment GHG scenarios (2) Annual means Climate models (15) Large-scale climate projections Downscaling and bias correction (3) Regionalized climate projections Hydrologic models (5) Hydrologic projections Uncertainties P: -6% in 2050; -12% in 2100 PET: + 16% in 2050; + 23 % in 2100 The climate becomes drier
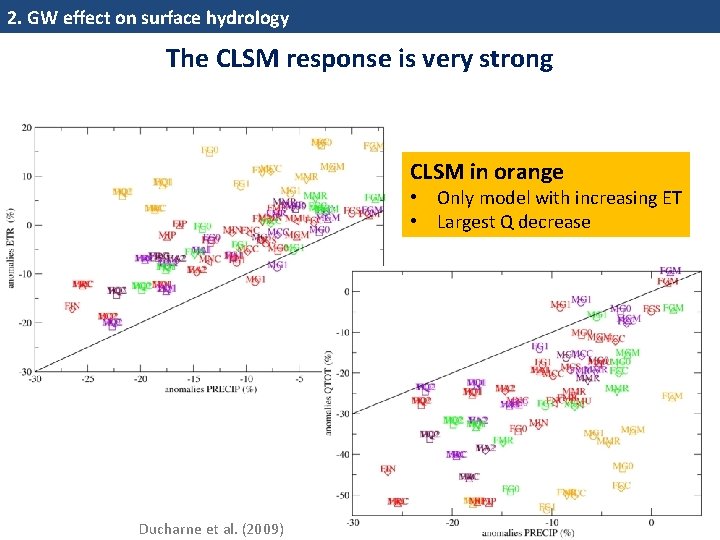
2. GW effect on surface hydrology The CLSM response is very strong CLSM in orange • Only model with increasing ET • Largest Q decrease Ducharne et al. (2009) 31
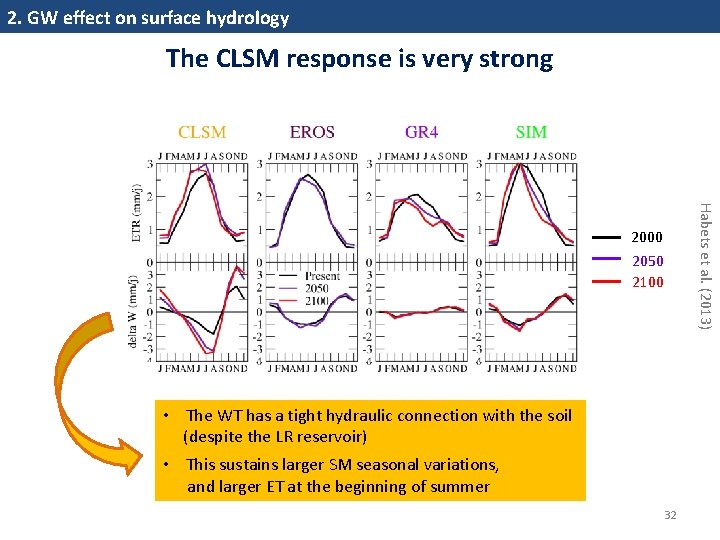
2. GW effect on surface hydrology The CLSM response is very strong Habets et al. (2013) 2000 2050 2100 • The WT has a tight hydraulic connection with the soil (despite the LR reservoir) • This sustains larger SM seasonal variations, and larger ET at the beginning of summer 32
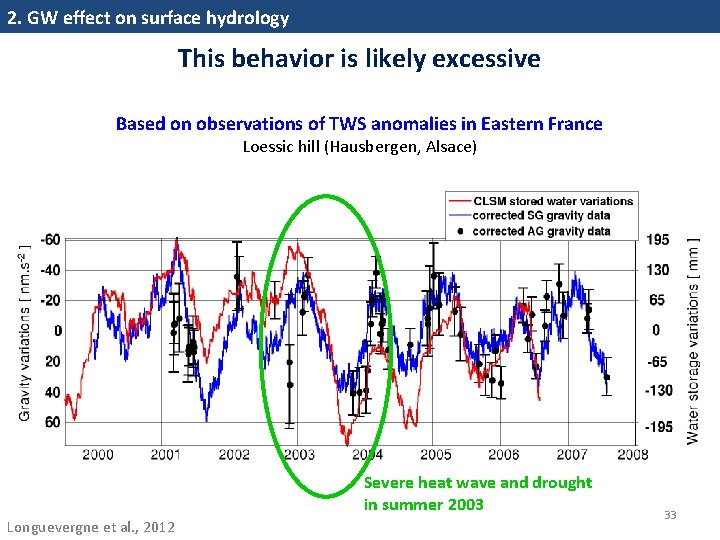
2. GW effect on surface hydrology This behavior is likely excessive Based on observations of TWS anomalies in Eastern France Loessic hill (Hausbergen, Alsace) Severe heat wave and drought in summer 2003 Longuevergne et al. , 2012 33
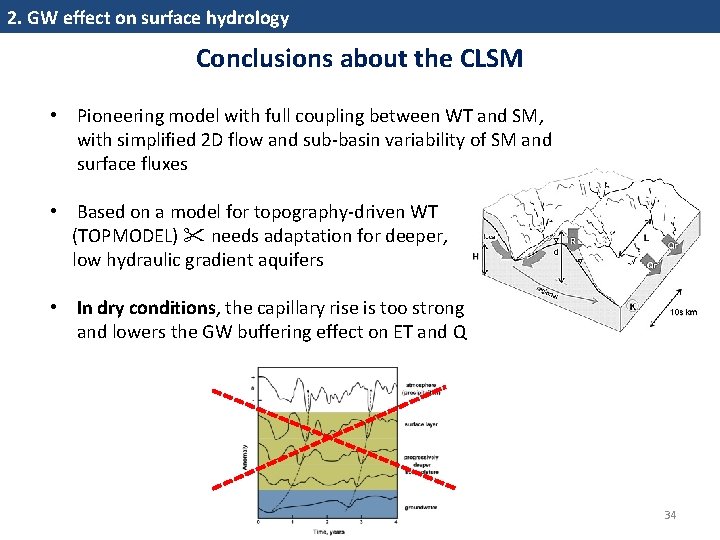
2. GW effect on surface hydrology Conclusions about the CLSM • Pioneering model with full coupling between WT and SM, with simplified 2 D flow and sub‐basin variability of SM and surface fluxes • Based on a model for topography‐driven WT (TOPMODEL) needs adaptation for deeper, low hydraulic gradient aquifers • In dry conditions, the capillary rise is too strong and lowers the GW buffering effect on ET and Q 34
Outline 1. Introduction: what are land surface models (LSMs) ? and why may groundwater (GW) be important ? 2. GW effect on surface hydrology: with the Catchment LSM 3. GW effect on climate: with the ORCHIDEE LSM • Model summary • One «on‐line» study at two scales in Europe 4. Perspectives 35
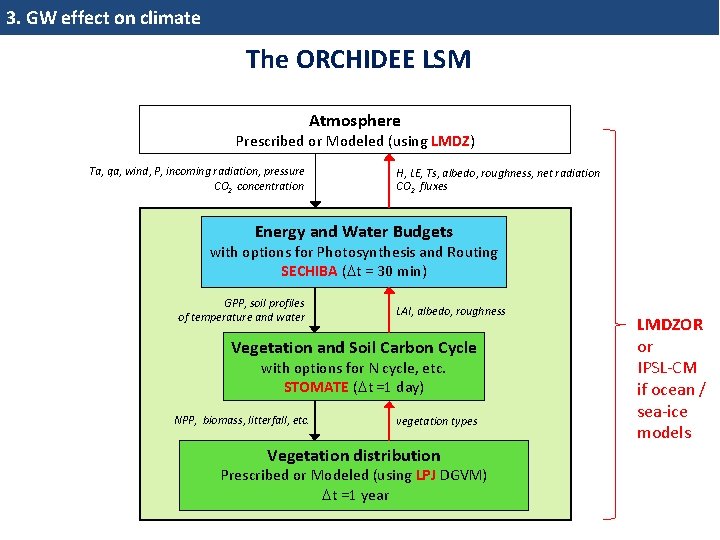
3. GW effect on climate The ORCHIDEE LSM Atmosphere Prescribed or Modeled (using LMDZ) Ta, qa, wind, P, incoming radiation, pressure CO 2 concentration H, LE, Ts, albedo, roughness, net radiation CO 2 fluxes Energy and Water Budgets with options for Photosynthesis and Routing SECHIBA ( t = 30 min) GPP, soil profiles of temperature and water LAI, albedo, roughness Vegetation and Soil Carbon Cycle with options for N cycle, etc. STOMATE ( t =1 day) NPP, biomass, litterfall, etc. vegetation types Vegetation distribution Prescribed or Modeled (using LPJ DGVM) t =1 year LMDZOR or IPSL‐CM if ocean / sea‐ice models
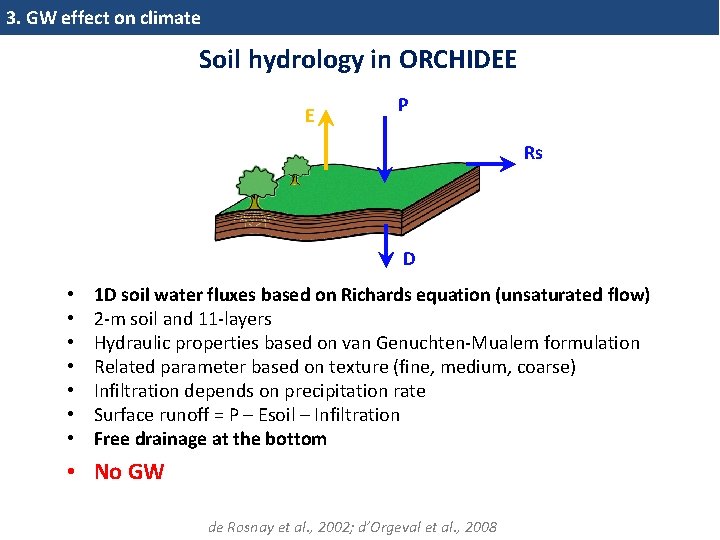
3. GW effect on climate Soil hydrology in ORCHIDEE E P Rs D • • 1 D soil water fluxes based on Richards equation (unsaturated flow) 2‐m soil and 11‐layers Hydraulic properties based on van Genuchten‐Mualem formulation Related parameter based on texture (fine, medium, coarse) Infiltration depends on precipitation rate Surface runoff = P – Esoil – Infiltration Free drainage at the bottom • No GW de Rosnay et al. , 2002; d’Orgeval et al. , 2008
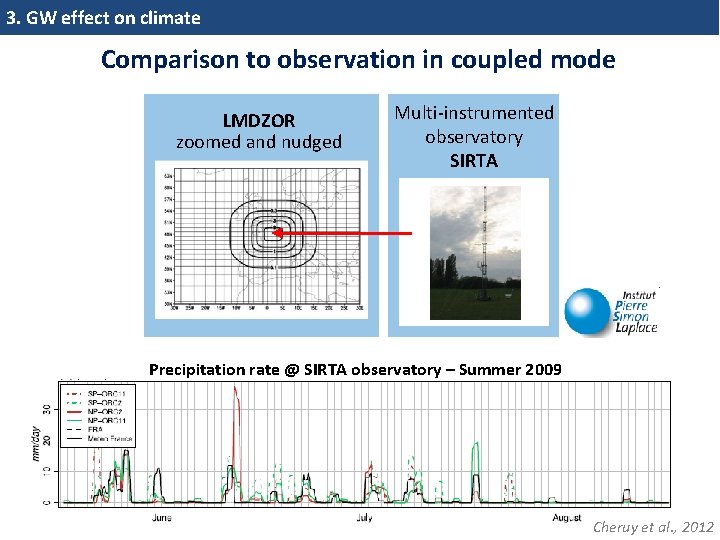
3. GW effect on climate Comparison to observation in coupled mode LMDZOR zoomed and nudged Multi‐instrumented observatory SIRTA c Precipitation rate @ SIRTA observatory – Summer 2009 Cheruy et al. , 2012
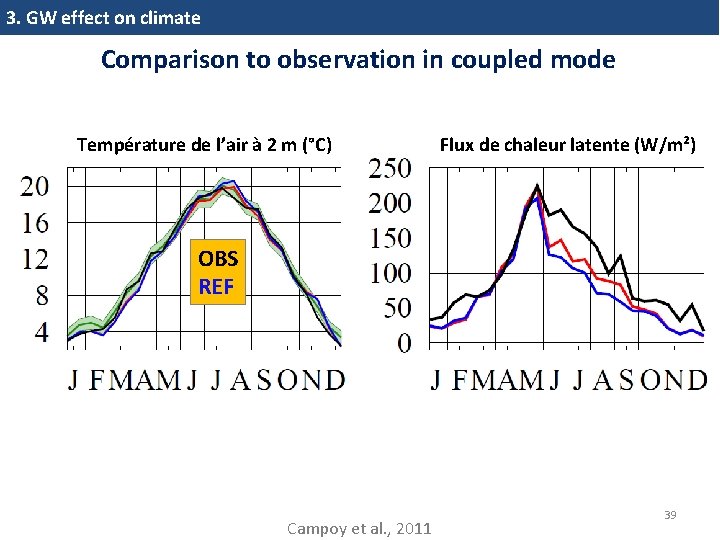
3. GW effect on climate Comparison to observation in coupled mode Température de l’air à 2 m (°C) Flux de chaleur latente (W/m²) OBS REF Campoy et al. , 2011 39
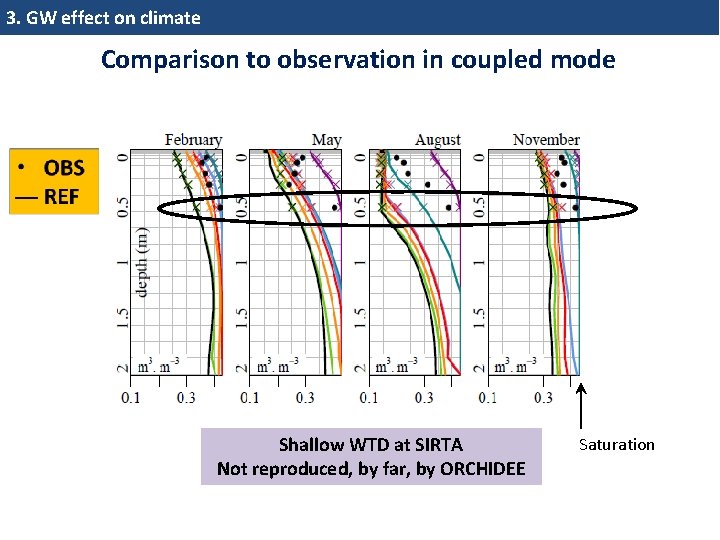
3. GW effect on climate Comparison to observation in coupled mode Shallow WTD at SIRTA Not reproduced, by far, by ORCHIDEE Saturation
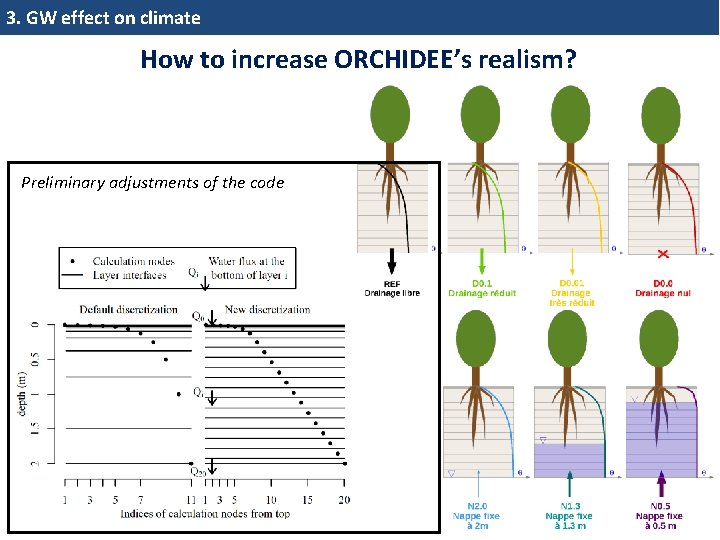
3. GW effect on climate How to increase ORCHIDEE’s realism? Preliminary adjustments of the code
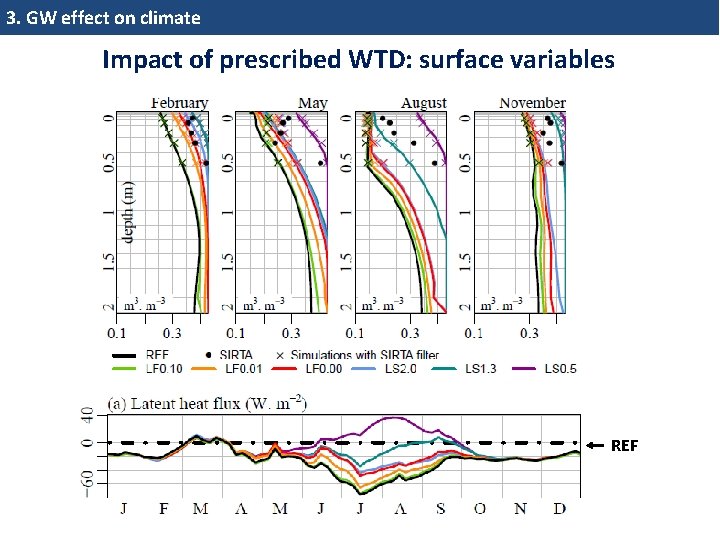
3. GW effect on climate Impact of prescribed WTD: surface variables REF
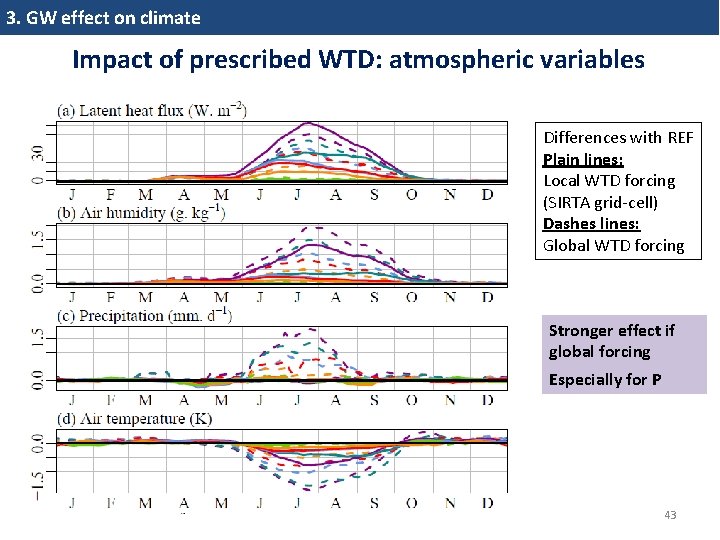
3. GW effect on climate Impact of prescribed WTD: atmospheric variables Differences with REF Plain lines: Local WTD forcing (SIRTA grid‐cell) Dashes lines: Global WTD forcing Stronger effect if global forcing Especially for P 43
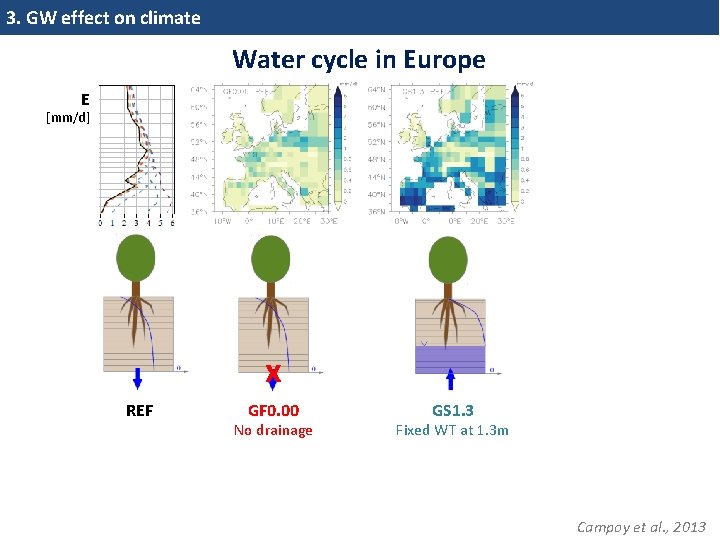
3. GW effect on climate Water cycle in Europe E [mm/d] x REF GF 0. 00 No drainage GS 1. 3 Fixed WT at 1. 3 m Campoy et al. , 2013
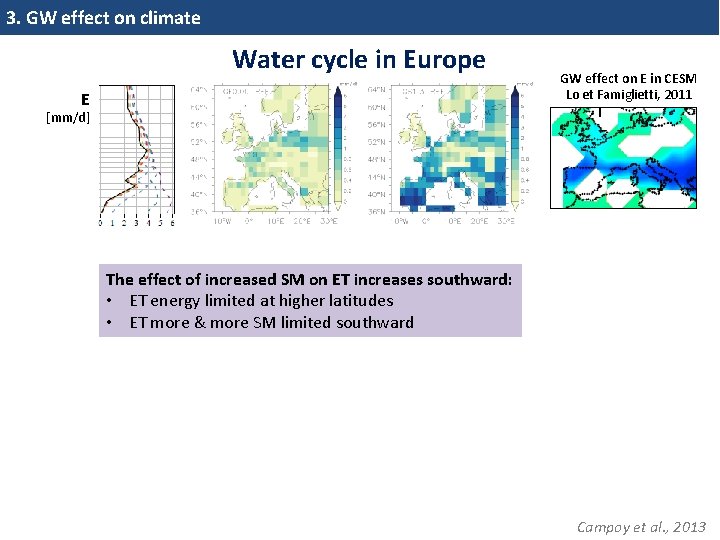
3. GW effect on climate Water cycle in Europe E GW effect on E in CESM Lo et Famiglietti, 2011 [mm/d] The effect of increased SM on ET increases southward: • ET energy limited at higher latitudes • ET more & more SM limited southward Campoy et al. , 2013
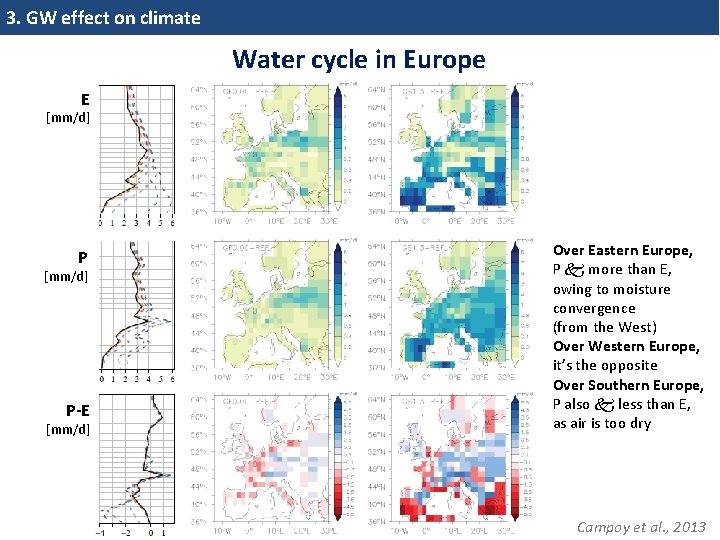
3. GW effect on climate Water cycle in Europe E [mm/d] P-E [mm/d] Over Eastern Europe, P more than E, owing to moisture convergence (from the West) Over Western Europe, it’s the opposite Over Southern Europe, P also less than E, as air is too dry Campoy et al. , 2013
Outline 1. Introduction: what are land surface models (LSMs) ? and why may groundwater (GW) be important ? 2. GW effect on surface hydrology: with the Catchment LSM 3. GW effect on climate: with the ORCHIDEE LSM 4. Perspectives 47
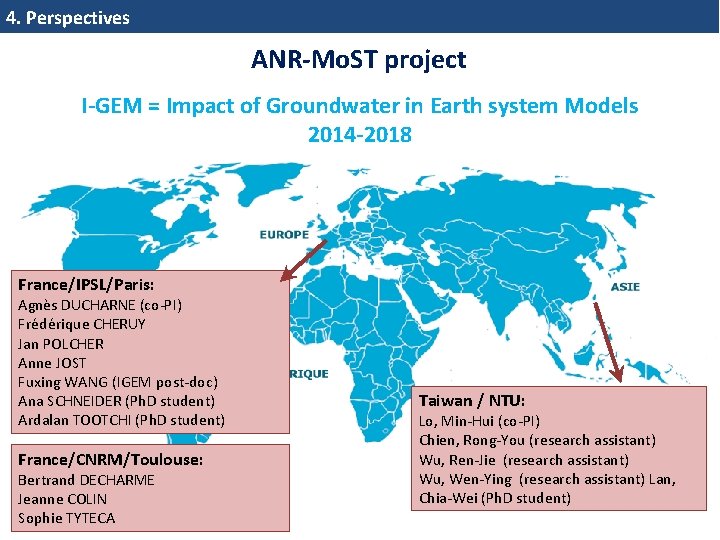
4. Perspectives ANR-Mo. ST project I-GEM = Impact of Groundwater in Earth system Models 2014 -2018 France/IPSL/Paris: Agnès DUCHARNE (co‐PI) Frédérique CHERUY Jan POLCHER Anne JOST Fuxing WANG (IGEM post‐doc) Ana SCHNEIDER (Ph. D student) Ardalan TOOTCHI (Ph. D student) France/CNRM/Toulouse: Bertrand DECHARME Jeanne COLIN Sophie TYTECA Taiwan / NTU: Lo, Min‐Hui (co‐PI) Chien, Rong‐You (research assistant) Wu, Ren‐Jie (research assistant) Wu, Wen‐Ying (research assistant) Lan, Chia‐Wei (Ph. D student) 48
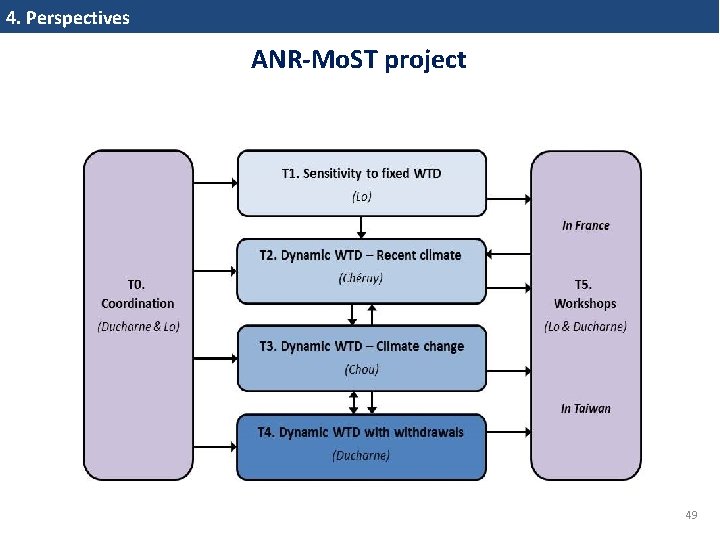
4. Perspectives ANR-Mo. ST project 49
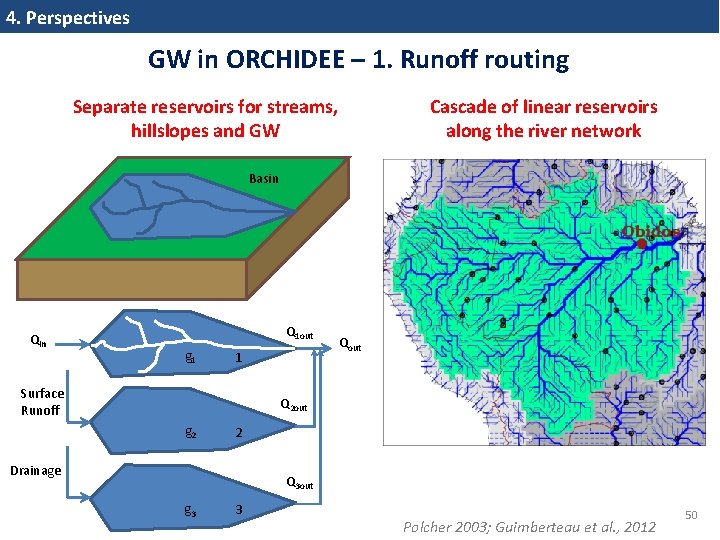
4. Perspectives GW in ORCHIDEE – 1. Runoff routing Separate reservoirs for streams, hillslopes and GW Cascade of linear reservoirs along the river network Basin Q 1 out g 1 1 Surface Runoff Qout Q 2 out g 2 2 Drainage Q 3 out g 3 3 Polcher 2003; Guimberteau et al. , 2012 50
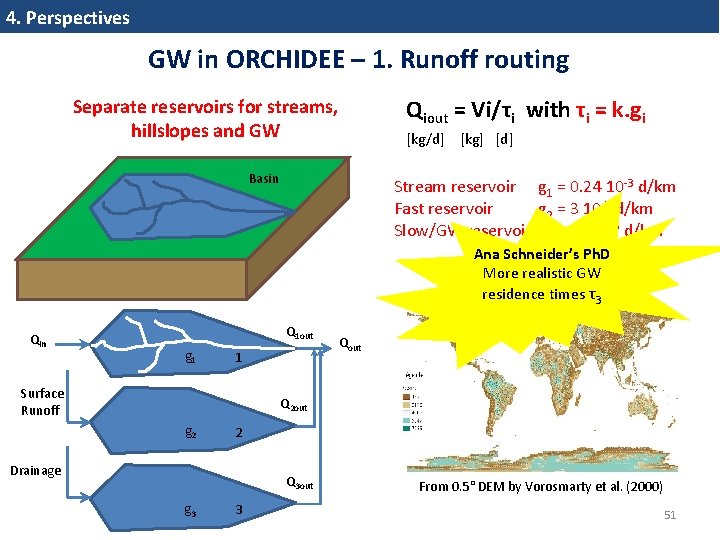
4. Perspectives GW in ORCHIDEE – 1. Runoff routing Separate reservoirs for streams, hillslopes and GW Basin Qiout = Vi/τi with τi = k. gi [kg/d] [kg] [d] Stream reservoir g 1 = 0. 24 10‐ 3 d/km Fast reservoir g 2 = 3 10‐ 3 d/km Slow/GW reservoir g 3 = 25 10‐ 3 d/km Ana Schneider’s Ph. D More realistic GW k = d/√slope [km] residence times τ3 Qin Q 1 out g 1 1 Surface Runoff Qout Q 2 out g 2 2 Drainage Q 3 out g 3 3 From 0. 5° DEM by Vorosmarty et al. (2000) 51
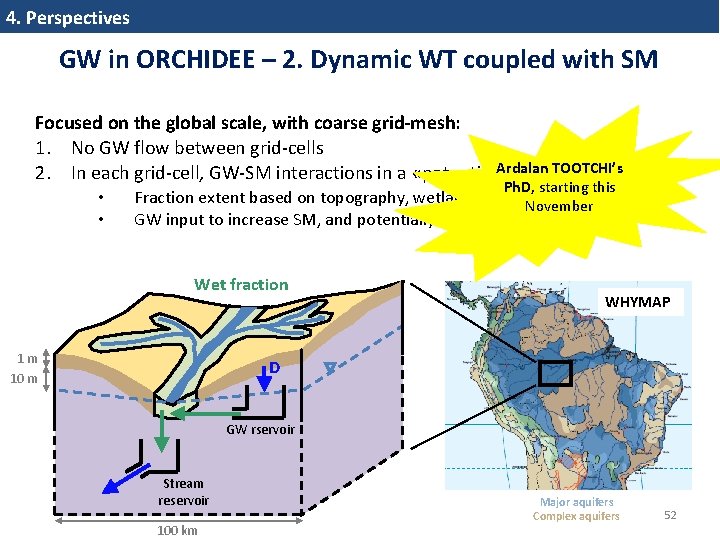
4. Perspectives GW in ORCHIDEE – 2. Dynamic WT coupled with SM Focused on the global scale, with coarse grid-mesh: 1. No GW flow between grid‐cells Ardalan TOOTCHI’s 2. In each grid‐cell, GW‐SM interactions in a «potentially wet fraction » • • Ph. D, starting this Fraction extent based on topography, wetland maps, aquifer maps, etc. November GW input to increase SM, and potentially generate a WT Wet fraction 1 m 10 m WHYMAP D GW rservoir Stream reservoir 100 km Major aquifers Complex aquifers 52

Thank you for your attention Any question? 53
1. Introduction Abtract Historically, land surface models aim at describing the water and energy budget of land areas, and are restricted to the soil‐vegetation interface with the atmosphere. Yet, groundwater can extend deep below the soil, often under the form of a water table, with important effects on the spatio‐temporal variability of soil moisture and river discharge. Based on research I've been involved in over the last 15 years, I will present several attempts to include a representation of groundwater in land surface models, and highlight the resulting effects on hydrologic and climatic variability. 1. Introduction: what are land surface models (LSMs) and why may groundwater (GW) be important ? 2. Results based on the Catchment LSM: GW effect 3. Results based on the ORCHIDEE LSM: GW effect on climate 4. Perspectives 54
Kollet & Maxwell, 2008
Classifying the water table at regional to continental scales Geophysical Research Letters Volume 38, Issue 5, L 05401, 5 MAR 2011 DOI: 10. 1029/2010 GL 046427 http: //onlinelibrary. wiley. com/doi/10. 1029/2010 GL 046427/full#grl 27827‐fig‐ 0002
Hypothèses sur la zone saturée H 1 : la recharge R de la nappe est uniforme dans le bassin H 2 : succession de régimes permanents : Qi = Li qi = Ai R H 3 : gradients hydrauliques pentes topographiques Si H 4 : KS = K 0 exp(‐νz) ; uniforme dans le bassin longueur de contour Li qi Source : Obled et Zin, 2004. 57
TOPMODEL Profondeur de la nappe Débit de base à l’exutoire densité Indice topographique Ruissellement 58
2. GW effect on surface hydrology Operational calculation of the fractions WTD Equilibrium RZ moisture Deformation of RZ moisture pdf Fraction partitioning 59
2. GW effect on surface hydrology Sensitivity of surface fluxes to topography • 5020 unit catchments in North America • All have the same climate and surface forcing but for topography E > P Wet year Dry year Ducharne et al. (2000) Moments of TI that correlate best with Y
Mise en oeuvre • • Spatialization in 29 init catchments (≈ 3000 km²) Topography from IGN 100‐m resolution DEM Meteorological forcing from SAFRAN data set (8 km x 8 km, hourly data) Vegetation from ECOLIMAP (Masson et al. , 2003)
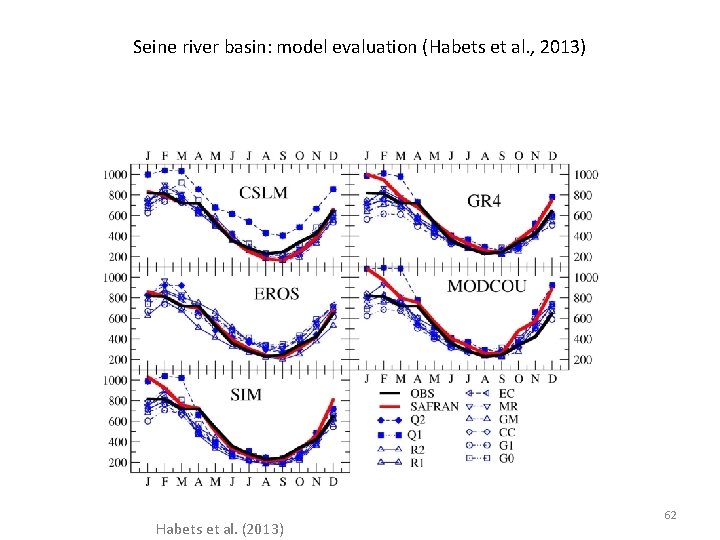
Seine river basin: model evaluation (Habets et al. , 2013) Habets et al. (2013) 62
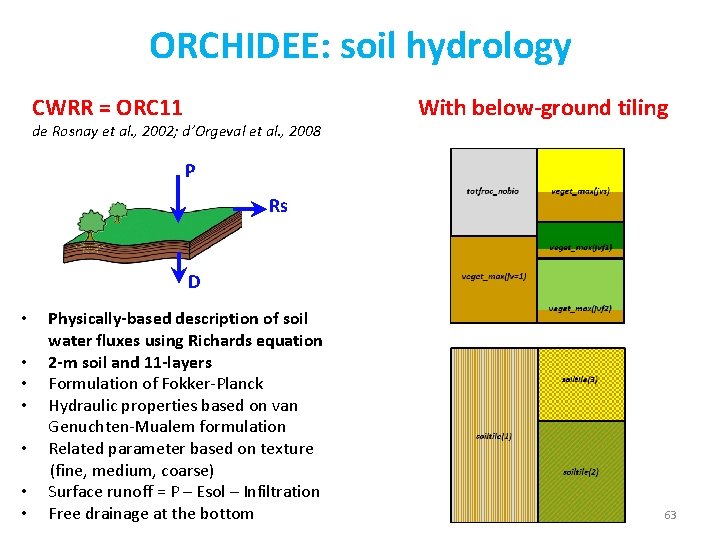
ORCHIDEE: soil hydrology CWRR = ORC 11 de Rosnay et al. , 2002; d’Orgeval et al. , 2008 With below-ground tiling P Rs D Physically-based description of soil water fluxes using Richards equation • 2 -m soil and 11 -layers • Formulation of Fokker‐Planck • Hydraulic properties based on van Genuchten‐Mualem formulation • Related parameter based on texture (fine, medium, coarse) • Surface runoff = P – Esol – Infiltration • Free drainage at the bottom • 63
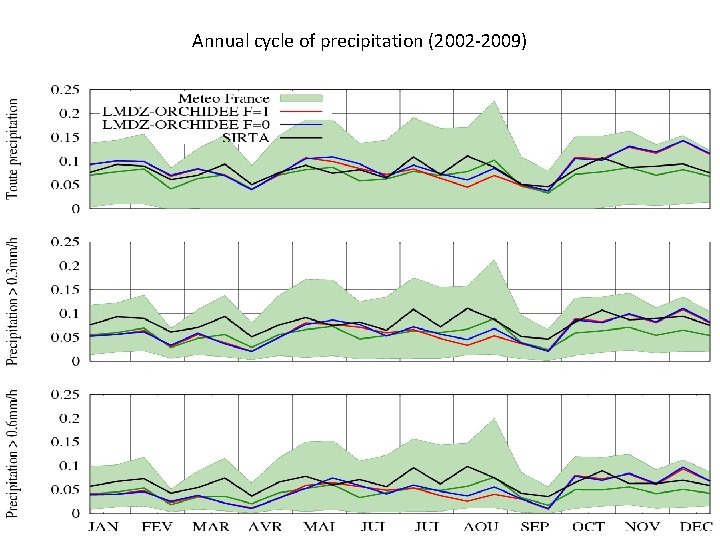
Annual cycle of precipitation (2002‐ 2009)
- Slides: 64