NOx emission estimates during 2014 Youth Olympic Games


 DECS O Satellite observations of")


")

![Whole domain 2013 97% Om. F in [-5, 10] April to October, 2013 70%](https://slidetodoc.com/presentation_image/bcae580422d6408ab729f320a268d391/image-15.jpg "Whole domain 2013 97% Om. F in [-5, 10] April to October, 2013 70%")
![Om. F criterion �Om. F in the interval of [-5, 10] 1 e 15](https://slidetodoc.com/presentation_image/bcae580422d6408ab729f320a268d391/image-16.jpg "Om. F criterion �Om. F in the interval of [-5, 10] 1 e 15")


- Slides: 20
NOx emission estimates during 2014 Youth Olympic Games in Nanjing* J. Ding 1, 2, R. J. van der A 1, B. Mijling 1, P. F. Levelt 1, 2, and N. Hao 3 [1] Royal Netherlands Meteorological Institute (KNMI), De Bilt, the Netherlands [2] Delft University of Technology, Delft, the Netherlands [3] German Aerospace Center (DLR), Oberpfaffenhofen, Germany Correspondence to: J. Ding (jieying. ding@knmi. nl) * Ding, J. , van der A, R. J. , Mijling, B. , Levelt, P. F. , and Hao, N. : NO x emission estimates during the 2014 Youth Olympic Games in Nanjing, Atmos. Chem. Phys. , 15, 9399 -9412, doi: 10. 5194/acp-15 -9399 -2015, 2015
Outline �Introduction �Methods �Improvement of emission estimates �Emission analysis �Conclusions
Introduction Events with emission reductions � 2008 Olympic Games in Beijing � 2010 Asian Games in Guangzhou � 2013 Asian Youth Games in Nanjing � 2014 Youth Olympic Games in Nanjing (“Youth Olympic Games blue sky”) � 2014 Asia-Pacific Economic Cooperation in Beijing (“APEC blue sky”)
Nanjing �Capital of Jiangsu province �Population: 8. 2 million Youth Olympic Games �Date: 16 to 24 August, 2014 �Regulations taken by local government
Period 1 st May - 30 th June Regulations The local government started to shut down the coal -burning factories. 1 st July - 15 th July All coal-burning factories have been shut down. 16 th July - 31 st July The work on one third of construction sites was stopped. The parking fees in downtown increased sevenfold. 1 st August – 15 th August The work on 2000 construction sites was stopped. Heavy-industry factories reduced manufacturing by 20 percent. Vehicles with high emissions were banned from the city. Open space barbecue restaurants were closed. 900 electric buses and 500 taxis have been put into operation. 16 th August-31 st August The work at all construction sites was put on hold.
Methods �DECSO (Daily Emission estimates Constrained by Satellite Observation) DECS O Satellite observations of NO 2 concentration Chemical transport model Inversion method based on extended Kalman filter More details in Mijling and van der A (2012, JGR)
NO 2 satellite observations �OMI �Overpass time: 13: 30 local time �Spatial resolution: 24 x 13 km 2 in nadir till 150 x 28 km 2 at the end of swath Filter: �Cloud radiance fraction larger than 70% �Surface albedo larger than 20% �Clouds below 800 h. Pa � 4 pixels at either side of the swath (after filtering the largest pixel size is 75 x 21 km 2)
Chemical transport model �CHIMERE �Domain: East Asia (18 – 50 o N, 102 – 1320 E ) �Horizontal resolution: 0. 250 x 0. 25 0 �Vertical resolution: 8 layers up to 500 h. Pa �Meteorological data: ECMWF �Initial emission inventory: MEIC (2010) for China, INTEX-B (2006) for outside China
Improvement of Emission estimates Model improvement �New version of CHIMERE model �Old one: CHIMERE V 2006 �Landuse: The Global Land Cover Facility (1994) �New one: CHIMERE V 2013 �Biogenic emissions, new transport schemes, secondary organic aerosol chemistry, updated chemical reaction rates �New landuse data: Glob. Cover Land cover (2009) 1995 2009
Ground measurements �Website: aqicn. org based on China National Urban air quality real-time publish platform �Location: Nanjing People’s government (center of Nanjing) �The only ground measurements we can find have a lot of limitations
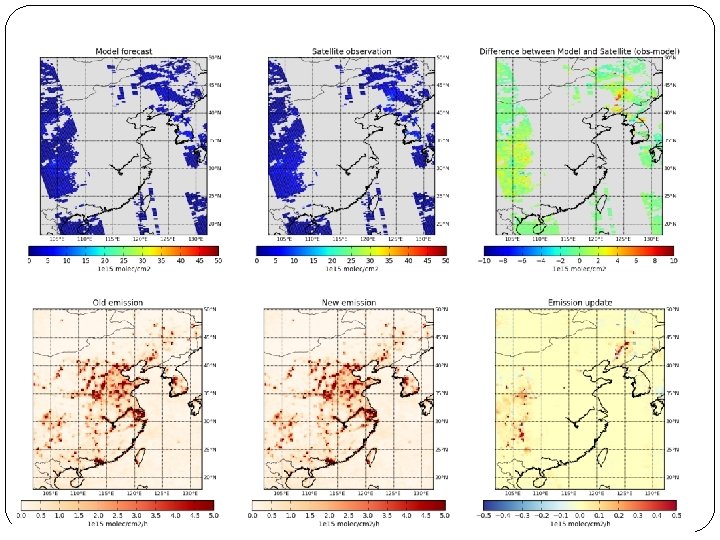
Model comparison
Absolute Observation minus Forecast (Om. F)
Quality control of satellite data
Whole domain 2013 97% Om. F in [-5, 10] April to October, 2013 70% Om. F in [-5, 10] Unrealistic November, 2013 to March, 2014 50% Om. F in [-5, 10]
Om. F criterion �Om. F in the interval of [-5, 10] 1 e 15 molecules/cm 2 For example: CHIMERE runs with DECSO emissions and MEIC emissions In 2013 summer in Nanjing ∆NOx emissions 9. 2 1 e 15 molecules/cm 2/h Om. F of 5 1 e 15 molecules/cm 2 Remove all emissions in Nanjing or ∆NOx column concentration: 4. 8 1 e 15 molecules/cm 2 NOx emission change of 9. 6 1 e 15 molecules/cm 2/h add 2 large-sized coal-fired power plants in a single day
Emission analysis No significant improvement in surface NO 2 concentration during the game period A decrease of 32% in August. But this could be caused by the rainy weather.
Emission reduction A reduction of about 25% A reduction of about 10%
Conclusions � New CHIMERE is better performing than old CHIMERE. � Om. F filtering is necessary to avoid wrong emission estimates. � The OMI observations show a 32% decrease in NO 2 column during the YOG. � DECSO results show NOx emissions have a reduction of at least 25% during the YOG period and afterwards. � The observed NO 2 columns and the derived emissions show different patterns that provide complimentary information.
Thank you. Any questions?