
November 9 2016 Noreference Image Quality Assessment for
November 9, 2016 No-reference Image Quality Assessment for High Dynamic Range Images Debarati Kundu, Deepti Ghadiyaram, Alan C. Bovik and Brian L. Evans The University of Texas at Austin
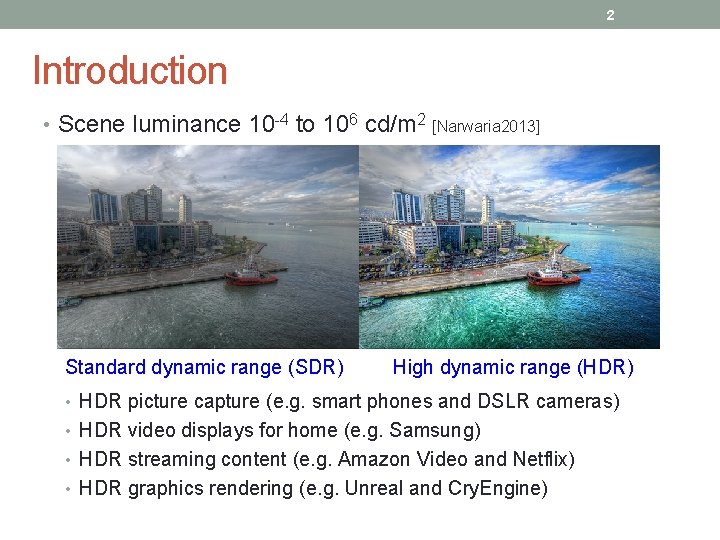
2 Introduction • Scene luminance 10 -4 to 106 cd/m 2 Standard dynamic range (SDR) [Narwaria 2013] High dynamic range (HDR) • HDR picture capture (e. g. smart phones and DSLR cameras) • HDR video displays for home (e. g. Samsung) • HDR streaming content (e. g. Amazon Video and Netflix) • HDR graphics rendering (e. g. Unreal and Cry. Engine)
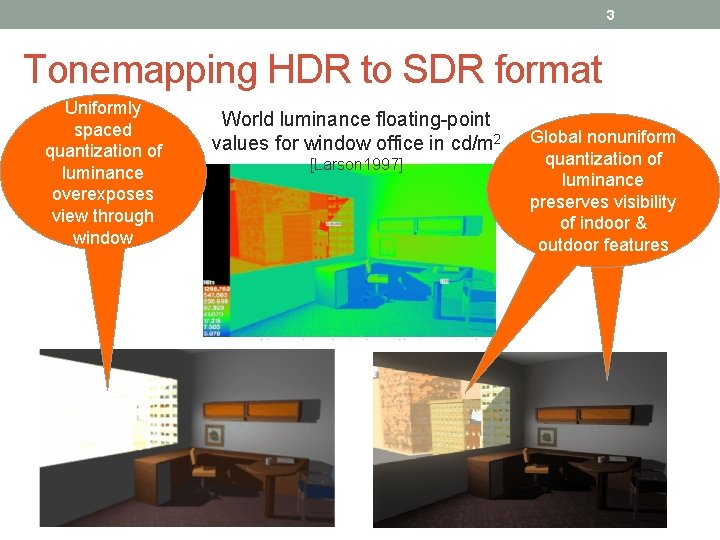
3 Tonemapping HDR to SDR format Uniformly spaced quantization of luminance overexposes view through window World luminance floating-point values for window office in cd/m 2 [Larson 1997] Global nonuniform quantization of luminance preserves visibility of indoor & outdoor features
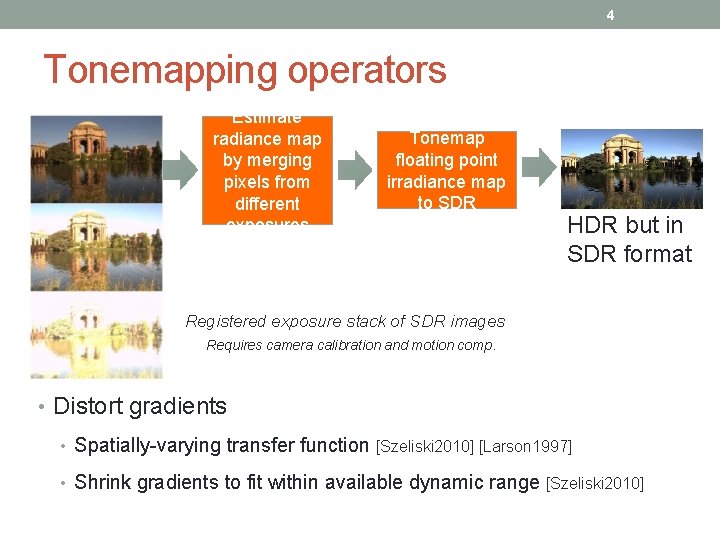
4 Tonemapping operators Estimate radiance map by merging pixels from different exposures Tonemap floating point irradiance map to SDR HDR but in SDR format Registered exposure stack of SDR images Requires camera calibration and motion comp. • Distort gradients • Spatially-varying transfer function [Szeliski 2010] [Larson 1997] • Shrink gradients to fit within available dynamic range [Szeliski 2010]
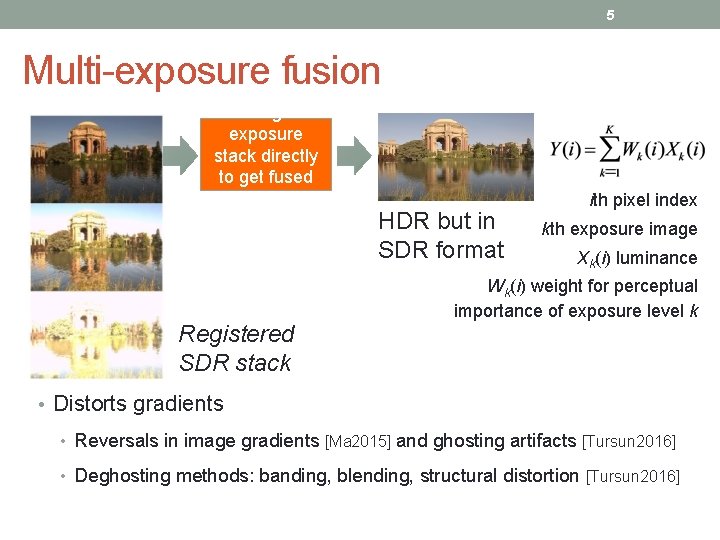
5 Multi-exposure fusion Merge exposure stack directly to get fused image Registered SDR stack HDR but in SDR format ith pixel index kth exposure image Xk(i) luminance Wk(i) weight for perceptual importance of exposure level k • Distorts gradients • Reversals in image gradients [Ma 2015] and ghosting artifacts [Tursun 2016] • Deghosting methods: banding, blending, structural distortion [Tursun 2016]
6 Image Quality Assessment (IQA) • Full reference IQA approaches • Tonemapping synthesizes an irradiance map [Yeganeh 2013] • Multi-exposure fusion does not have single reference image • No-reference IQA using scene statistics • Statistics of pristine pictures occur irrespective of content • Statistics of distorted pictures deviate from these • Previously used in predicting quality in SDR pictures • Contributions • Propose two new no-reference HDR IQA algorithms • Evaluate new algorithms based on crowdsourced HDR scores • Evaluate new algorithms on well-established SDR databases
![http: //signal. ece. utexas. edu/~debarati/ESPL_LIVE_HDR_Database/ ESPL-LIVE HDR database 7 [Debarati 2016] • 1, 811](http://slidetodoc.com/presentation_image_h/128fc414b7d82a37d4bb054167075124/image-7.jpg "http: //signal. ece. utexas. edu/~debarati/ESPL_LIVE_HDR_Database/ ESPL-LIVE HDR database 7 [Debarati 2016] • 1, 811")
http: //signal. ece. utexas. edu/~debarati/ESPL_LIVE_HDR_Database/ ESPL-LIVE HDR database 7 [Debarati 2016] • 1, 811 HDR images from 605 source scenes • 960 x 540 landscape & 540 x 304 portrait orientation • Single stimulus continuous quality scale (0 -100) • 327, 720 raw quality scores from 5, 462 subjects “Surreal” Effect • Images annotated with mean opinion scores (MOS) Distribution of HDR processing methods Sample images Number of images in database
![8 Mean subtracted contrast normalization • MSCN pixels for image [Ruderman 1993] Weighted local](http://slidetodoc.com/presentation_image_h/128fc414b7d82a37d4bb054167075124/image-8.jpg "8 Mean subtracted contrast normalization • MSCN pixels for image [Ruderman 1993] Weighted local")
8 Mean subtracted contrast normalization • MSCN pixels for image [Ruderman 1993] Weighted local mean Original image Weighted local standard deviation Models divisive normalization in retina MSCN image
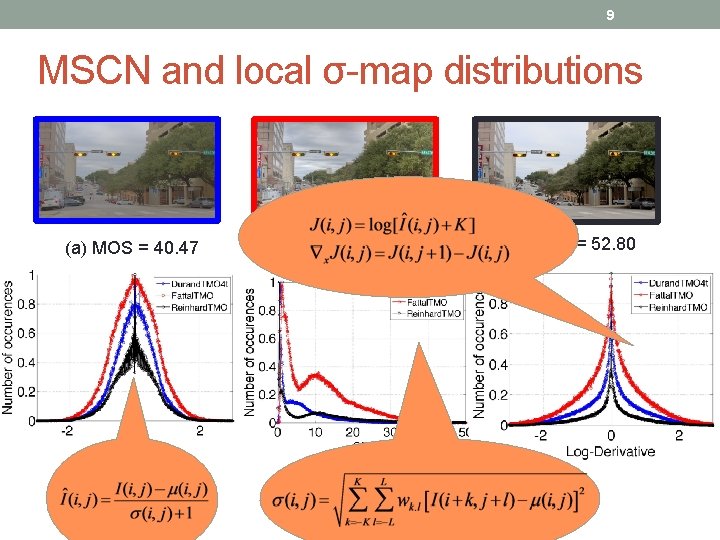
9 MSCN and local σ-map distributions (a) MOS = 40. 47 (b) MOS = 49. 23 (c) MOS = 52. 80
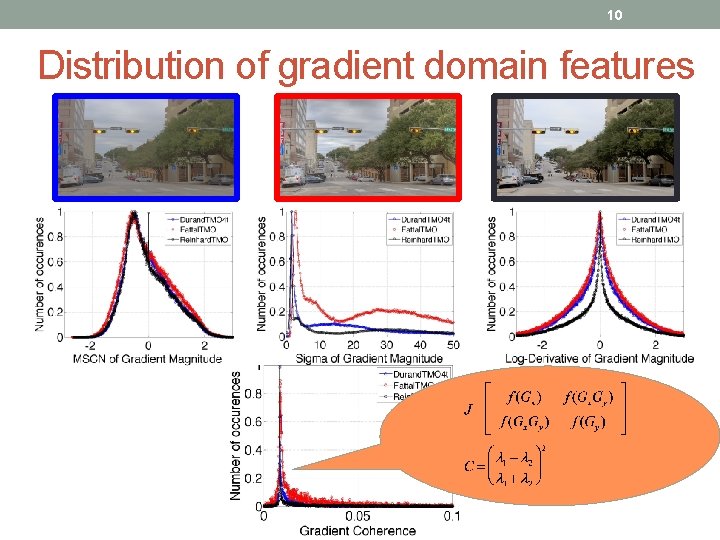
10 Distribution of gradient domain features
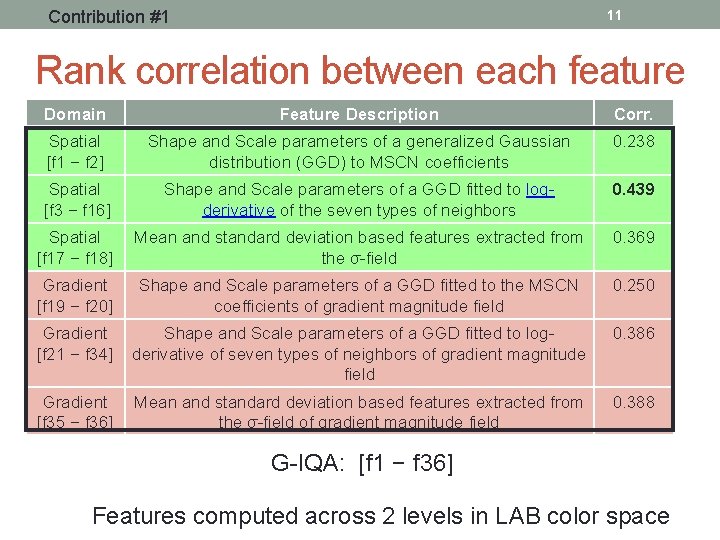
Contribution #1 11 Rank correlation between each feature Domain Feature Description Corr. Spatial [f 1 − f 2] Shape and Scale parameters of a generalized Gaussian distribution (GGD) to MSCN coefficients 0. 238 Spatial [f 3 − f 16] Shape and Scale parameters of a GGD fitted to logderivative of the seven types of neighbors 0. 439 Spatial [f 17 − f 18] Mean and standard deviation based features extracted from the σ-field 0. 369 Gradient [f 19 − f 20] Shape and Scale parameters of a GGD fitted to the MSCN coefficients of gradient magnitude field 0. 250 Gradient [f 21 − f 34] Shape and Scale parameters of a GGD fitted to logderivative of seven types of neighbors of gradient magnitude field 0. 386 Gradient [f 35 − f 36] Mean and standard deviation based features extracted from the σ-field of gradient magnitude field 0. 388 G-IQA: [f 1 − f 36] Features computed across 2 levels in LAB color space
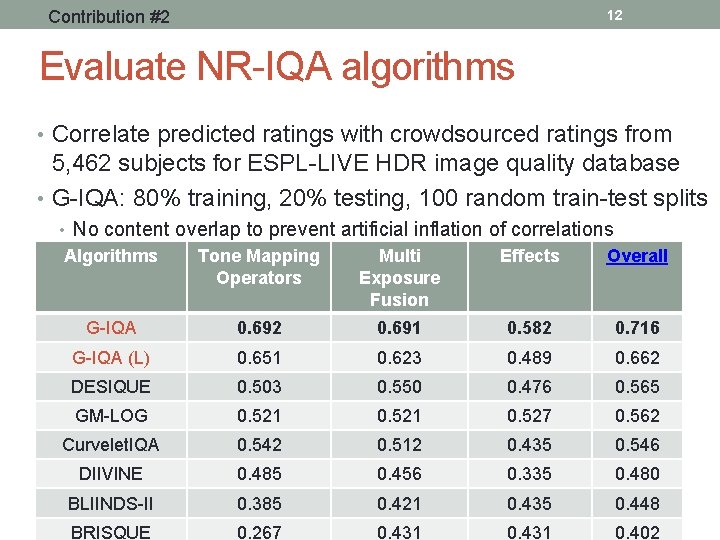
Contribution #2 12 Evaluate NR-IQA algorithms • Correlate predicted ratings with crowdsourced ratings from 5, 462 subjects for ESPL-LIVE HDR image quality database • G-IQA: 80% training, 20% testing, 100 random train-test splits • No content overlap to prevent artificial inflation of correlations Algorithms Tone Mapping Operators Multi Exposure Fusion Effects Overall G-IQA 0. 692 0. 691 0. 582 0. 716 G-IQA (L) 0. 651 0. 623 0. 489 0. 662 DESIQUE 0. 503 0. 550 0. 476 0. 565 GM-LOG 0. 521 0. 527 0. 562 Curvelet. IQA 0. 542 0. 512 0. 435 0. 546 DIIVINE 0. 485 0. 456 0. 335 0. 480 BLIINDS-II 0. 385 0. 421 0. 435 0. 448 BRISQUE 0. 267 0. 431 0. 402
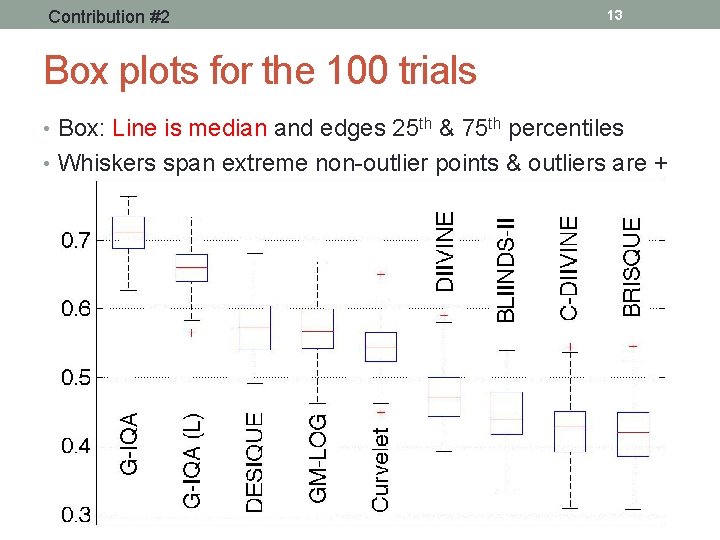
Contribution #2 13 Box plots for the 100 trials • Box: Line is median and edges 25 th & 75 th percentiles • Whiskers span extreme non-outlier points & outliers are +
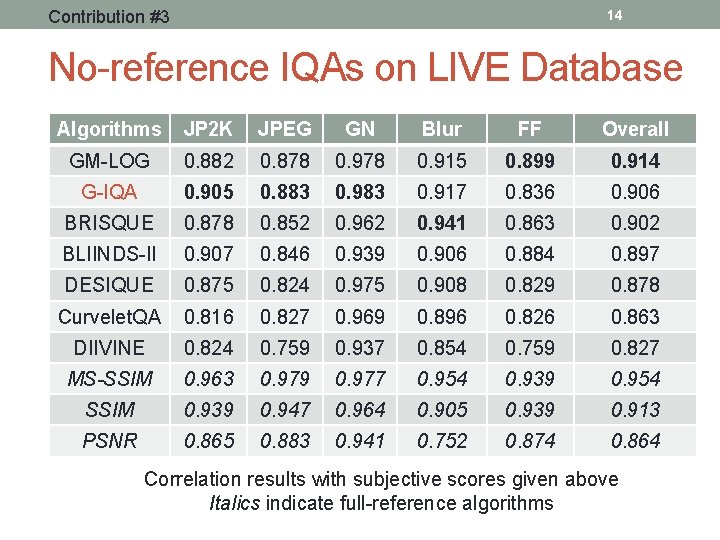
Contribution #3 14 No-reference IQAs on LIVE Database Algorithms JP 2 K JPEG GN Blur FF Overall GM-LOG 0. 882 0. 878 0. 915 0. 899 0. 914 G-IQA 0. 905 0. 883 0. 917 0. 836 0. 906 BRISQUE 0. 878 0. 852 0. 962 0. 941 0. 863 0. 902 BLIINDS-II 0. 907 0. 846 0. 939 0. 906 0. 884 0. 897 DESIQUE 0. 875 0. 824 0. 975 0. 908 0. 829 0. 878 Curvelet. QA 0. 816 0. 827 0. 969 0. 896 0. 826 0. 863 DIIVINE 0. 824 0. 759 0. 937 0. 854 0. 759 0. 827 MS-SSIM 0. 963 0. 979 0. 977 0. 954 0. 939 0. 954 SSIM 0. 939 0. 947 0. 964 0. 905 0. 939 0. 913 PSNR 0. 865 0. 883 0. 941 0. 752 0. 874 0. 864 Correlation results with subjective scores given above Italics indicate full-reference algorithms
15 Conclusion • Proposed two no-reference IQA methods • HDR image formation causes gradient distortion • Use statistics in pixel and gradient domains • Proposed IQA methods correlate well with human scores • ESPL-LIVE HDR subjective image quality database (2016) • LIVE image quality assessment database (2006) Future work • Improve performance of NR-IQA HDR algorithms • Use the methods to improve HDR processing algorithms such as tone-mapping or multi-exposure
![16 References [Debarati 2016] http: //signal. ece. utexas. edu/~debarati/ESPL_LIVE_HDR_Database/ [Larson 1997] G. W. Larson,](http://slidetodoc.com/presentation_image_h/128fc414b7d82a37d4bb054167075124/image-16.jpg "16 References [Debarati 2016] http: //signal. ece. utexas. edu/~debarati/ESPL_LIVE_HDR_Database/ [Larson 1997] G. W. Larson,")
16 References [Debarati 2016] http: //signal. ece. utexas. edu/~debarati/ESPL_LIVE_HDR_Database/ [Larson 1997] G. W. Larson, H. Rushmeier, C. Piatko. “A Visibility Matching Tone Reproduction Operator for High Dynamic Range Scenes”, IEEE Trans. on Visualization and Computer Graphics 3, 4, Oct. 1997, pp. 291 -306. [Ma 2015] K. Ma, K. Zeng, Z. Wang, “Perceptual quality assessment for multi-exposure image fusion, ” IEEE Trans. Image Processing, vol. 24, no. 11, pp. 3345– 3356, Nov 2015. [Nafchi 2014] H. Ziaei Nafchi, A. Shahkolaei, R. Farrahi Moghaddam, M. Cheriet, “Fsitm: A feature similarity index for tone-mapped images, ” IEEE Signal Processing Letters, 2015. [Narwaria 2013] M. Narwaria, M. Perreira Da Silva, P. Le Callet, and R. Pepion, “Tone mapping-based high-dynamic-range image compression: study of optimization criterion and perceptual quality, ” Optical Engineering, vol. 52, no. 10, Oct 2013. [Nasrinpour 2015] 1 H. R. Nasrinpour and N. D. Bruce, “Saliency weighted quality assessment of tone-mapped images, ” Proc. IEEE Int. Conf. Image Proc. , Sep. 2015. [Ruderman 1993] D. L. Ruderman and W. Bialek, “Statistics of natural images: Scaling in the woods, ” Proc. Neural Info. Processing Sys. Conf. and Workshops, 1993. [Szeliski 2010] R. Szeliski, Computer Vision: Algorithms and Applications, 1 st ed. , 2010. [Tursun 2016] O. T. Tursun, A. O. Akyuz, A. Erdem, E. Erdem, “An Objective Deghosting Quality Metric for HDR Images”, Eurographics, vol. 35, 2016. [Yeganeh 2013] H. Yeganeh and Z. Wang, “Objective quality assessment of tone-mapped images, ” IEEE Trans. on Image Processing , vol. 22, no. 2, pp. 657 -667, Feb 2013.
17 Questions?
![18 Multi-exposure fusion distortion [Tursun 2016] Exposure stack for scene with person walking MEF](http://slidetodoc.com/presentation_image_h/128fc414b7d82a37d4bb054167075124/image-18.jpg "18 Multi-exposure fusion distortion [Tursun 2016] Exposure stack for scene with person walking MEF")
18 Multi-exposure fusion distortion [Tursun 2016] Exposure stack for scene with person walking MEF HDR Image + Deghosting Gradient mag & visual difference artifacts
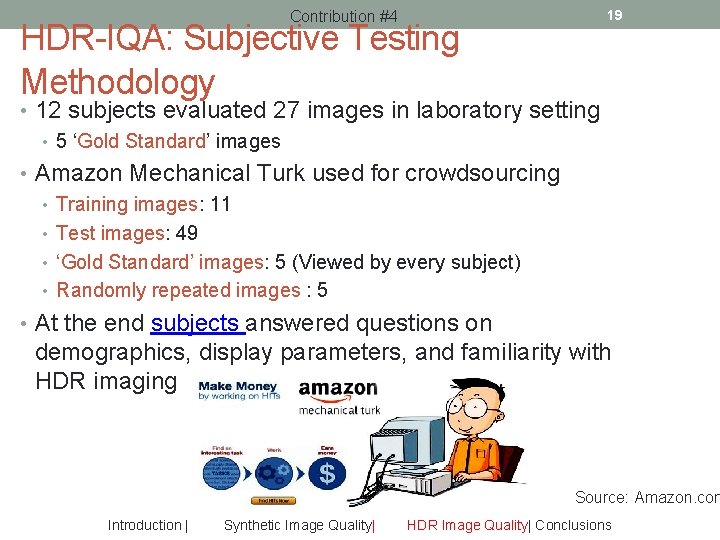
19 Contribution #4 HDR-IQA: Subjective Testing Methodology • 12 subjects evaluated 27 images in laboratory setting • 5 ‘Gold Standard’ images • Amazon Mechanical Turk used for crowdsourcing • Training images: 11 • Test images: 49 • ‘Gold Standard’ images: 5 (Viewed by every subject) • Randomly repeated images : 5 • At the end subjects answered questions on demographics, display parameters, and familiarity with HDR imaging Source: Amazon. com Introduction | Synthetic Image Quality| HDR Image Quality| Conclusions
HDR-IQA: Processing of the raw scores • Subject rejection strategies: Contribution #4 20 • Only subjects with AMT confidence values greater than 0. 75 participated • If scores assigned to multiple copies of the same image differed by more than 25. 5 for three images, scores from that user was rejected • 388 subjects among 5, 462 removed as outliers • Processing of remaining scores: • On an average, every image evaluated by 110 subjects • Mean Opinion Scores: Mean of Z-score for every image • Spans 16. 941 - 68. 502. • Raw MOS scores span 5. 623 – 84. 661 • Consistency with laboratory setting: • Median PLCC between individual scores and MOS values. Details for | Synthetic Image Quality| HDR Image Quality| ‘Gold. Introduction Standard’ images in laboratory setting was. Conclusions 0. 9466
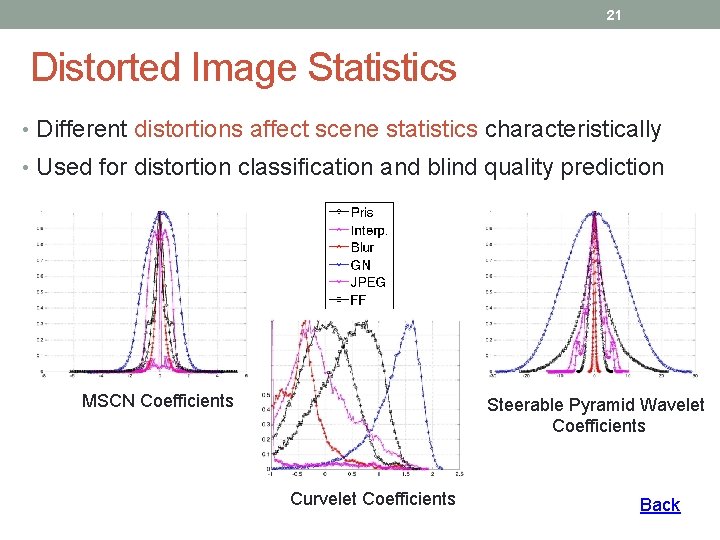
21 Distorted Image Statistics • Different distortions affect scene statistics characteristically • Used for distortion classification and blind quality prediction MSCN Coefficients Steerable Pyramid Wavelet Coefficients Curvelet Coefficients Back
![22 Tone Mapped Quality Index [Yeganeh 2013] • Tonemapping meant to change local intensity](http://slidetodoc.com/presentation_image_h/128fc414b7d82a37d4bb054167075124/image-22.jpg "22 Tone Mapped Quality Index [Yeganeh 2013] • Tonemapping meant to change local intensity")
22 Tone Mapped Quality Index [Yeganeh 2013] • Tonemapping meant to change local intensity & contrast • Structural fidelity modifies Structural Similarity (SSIM) • Penalizes large change in strength in HDR vs. SDR image patch • Local standard deviations nonlinearly mapped via Gaussian CDF • Significant signal strength mapped to 1 • Insignificant signal strength mapped to 0 • Structural fidelity computation over five scales • Naturalness measure of tonemapped SDR image • Distribution of global means in 3000 natural images • Distribution of global standard deviations in 3000 natural images Back
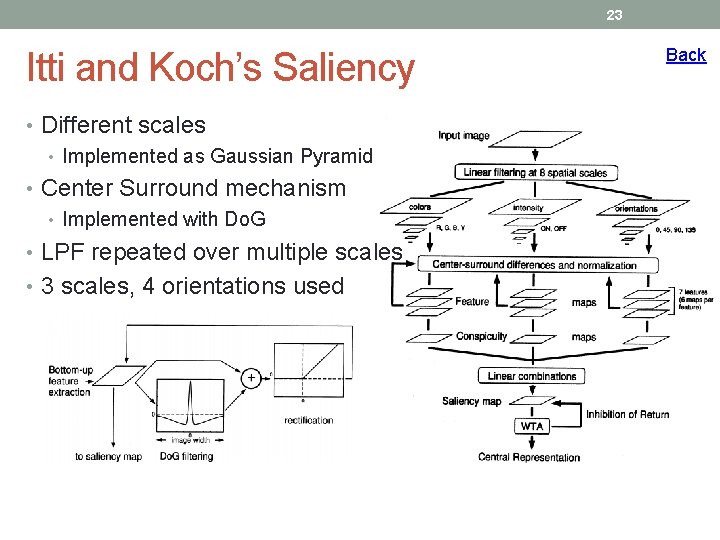
23 Itti and Koch’s Saliency • Different scales • Implemented as Gaussian Pyramid • Center Surround mechanism • Implemented with Do. G • LPF repeated over multiple scales • 3 scales, 4 orientations used Back
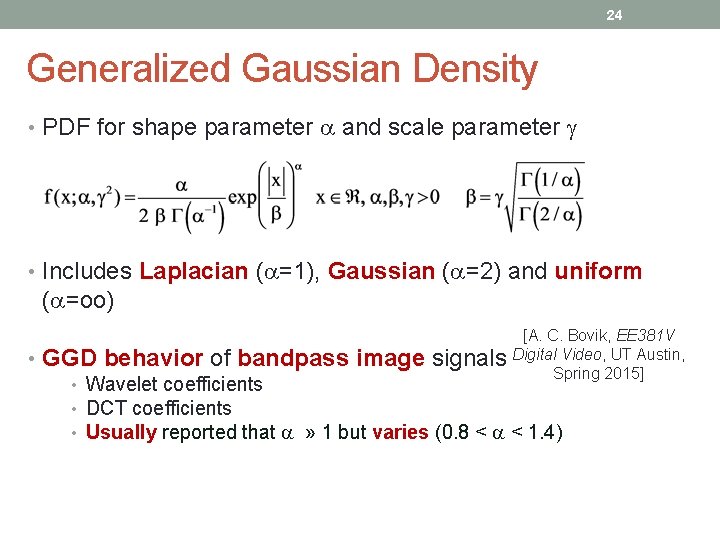
24 Generalized Gaussian Density • PDF for shape parameter a and scale parameter g • Includes Laplacian (a=1), Gaussian (a=2) and uniform (a=oo) [A. C. Bovik, EE 381 V Digital Video, UT Austin, Spring 2015] • GGD behavior of bandpass image signals • Wavelet coefficients • DCT coefficients • Usually reported that a » 1 but varies (0. 8 < a < 1. 4)
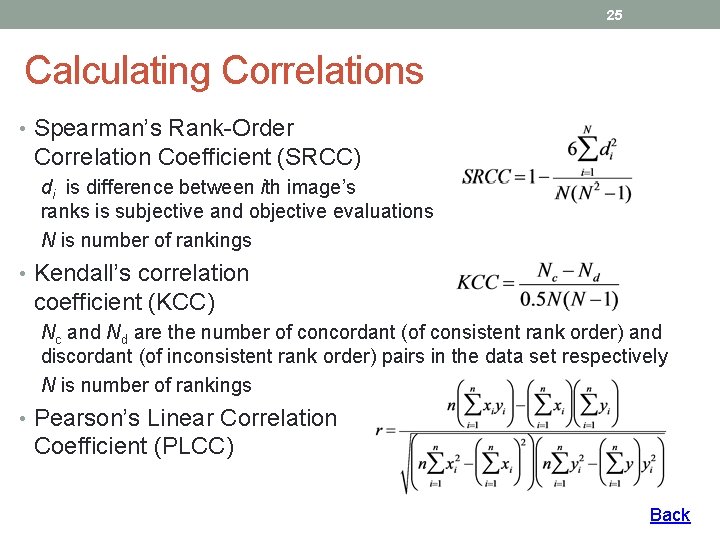
25 Calculating Correlations • Spearman’s Rank-Order Correlation Coefficient (SRCC) di is difference between ith image’s ranks is subjective and objective evaluations N is number of rankings • Kendall’s correlation coefficient (KCC) Nc and Nd are the number of concordant (of consistent rank order) and discordant (of inconsistent rank order) pairs in the data set respectively N is number of rankings • Pearson’s Linear Correlation Coefficient (PLCC) Back

26 Scatter plot of MOS vs IQA scores G-IQA DESIQUE GM-LOG
- Slides: 26