Nottingham Trent University Student Dashboard Ed Foster Student

Nottingham Trent University Student Dashboard Ed Foster, Student Engagement Manager

NTU’s use of learning analytics • Learning analytics • 2013 -14 pilot • Analysis of 2013 -14 pilot year • Next developments

What is learning analytics? • “Analytics marries large data sets, statistical techniques, and predictive modelling. It could be thought of as the practice of mining institutional data to produce ‘actionable intelligence’. – Campbell, De. Blois & Oblinger (2007) • Use in MOOCs – Personalization of learning experience • When to communicate to learners • Which questions are most difficult • Personalized course design • Use in retention and success – Manchester Metropolitan University • Outcomes for students who use the library after 9 pm – 9 am were … • Who was more likely to do their coursework at the last minute? – Males or females? • But what’s the really hard part?

Future adoption of learning analytics? http: //cdn. nmc. org/media/2015 -nmc-horizon-report-HE-EN. pdf

Learning analytics at your institutions • Please say hello to the people around you • Are your universities working on learning analytics? • What are you working on? • Do you have any fears?

Should we be worried about learning analytics? • Privacy • Free will • Learning analytics is potentially very behaviouristic • How will this data actually be used? • So what if we can tell to 0/7% accuracy what the problem is? • Can we change the outcomes? • Should we change the outcomes? • Yes Sophisticated stereotyping/ blaming the student for the problem?

Why were we interested in learning analytics? Ed Foster, Student Engagement Manager Mike Kerrigan, Strategic Data & Intelligence Manager

Why were we interested? • Three different work streams: • HERE Project (part of “What Works? ” Student Retention & Success, 2008 -2012) – Student doubters, weaker connections to their course, tutors and peers – Difficult to bring about institutional change • Internal audit – NTU overall very good at retention, but weak at sharing data with those staff who need it • IS were working speculatively with a range of providers – Can you demonstrate a working model?

Primary interests in the Dashboard Attainment • • Students as agents Can see own grades, and compare self to peers Feedback Tool for academic use • • Reduce barriers to being known by a tutor Space for tutors to make notes & plan Belonging Student Retention • • Promotes virtuous behaviour Early warnings Relationship building Information about support

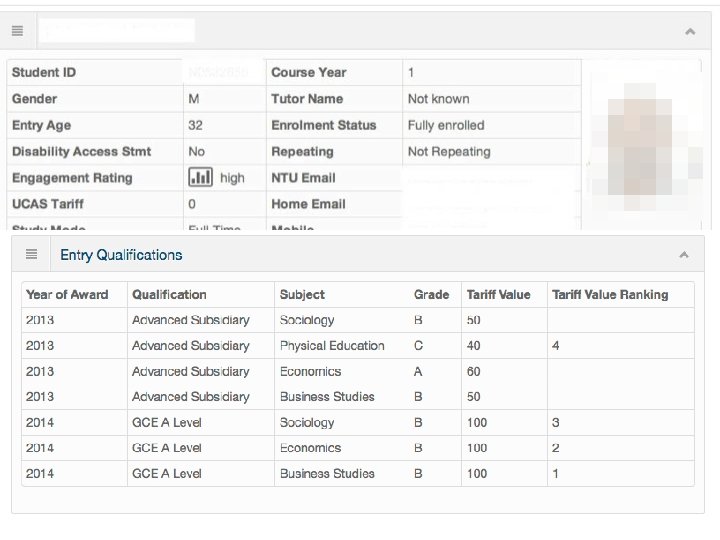
What does the dashboard do? Student biographical info, e. g. enrolment status Can make comments in free text box Staff view Student view Evidence of student engagement • Door swipes • Library book loans • VLE use • Dropbox submissions • Future goals • Attendance • E-resources (where appropriate) NTU Student Dashboard Compares student engagement across the cohort & gives rating Raises alerts!!

Progress • Project Group – Students’ Union, quality assurance, Equality & Diversity, planning, legal services, registry, Information systems, Student Support Services, Schools, Colleges & Community Outreach • Pilot programme (2013 -14) – – – 4 first year courses, 22 staff, 400 students Understand how students and staff use it Explore reactions to using the dashboard Test methodology – does it work? Student focus groups, student surveys • Full implementation (2014 -15) – By Spring 2014, it was felt that there was sufficient benefit to consider full implementation, further evaluation conducted in Nov 2014 – Jan 2015 – Agreed to implement in all academic Schools – Undergraduate & postgraduate

The NTU Student Dashboard


Student Engagement Rating - Cumulative

Student Engagement Rating – week-week

Engagement based on student behaviour

Patterns of disengagement & then withdrawal Three examples of withdrawn first year students 2013/14 Different patterns of withdrawal, some may be more amenable to support/ early warning
![Tutor Notes Arranged to see [student] as attendance was poor. We had an open](http://slidetodoc.com/presentation_image/08bfb6322b575406af2d5fe8d73bec44/image-19.jpg "Tutor Notes Arranged to see [student] as attendance was poor. We had an open")
Tutor Notes Arranged to see [student] as attendance was poor. We had an open and honest discussion about this and I explained to him the relationship between attendance and success! We talked about the barriers to his attendance, which related to too many late nights! Will meet again to review his attendance [tutor name] [student] has not attended my lectures for a few weeks. Emailed him to ask him to attend a one to one tutorial [tutor name]

Evidence from the 2013 -14 pilot Checking the efficacy of the dashboard model

Snapshot of engagement 2013 -14 • A need to explore the relationship between engagement as recorded by the dashboard and retention and success • Average daily engagement from 22 nd Sept – 6 th June – Derived from daily engagement classifications: low, satisfactory, good, high – Includes weekends, Christmas & Easter – For students who departed early, stopped counting on the last day they were fully enrolled • Looked at all undergraduate & postgraduate students (n=25, 216) – Smaller samples for progression from first to second year & final year attainment • Overall student engagement • Engagement for priority groups • Engagement by entry qualification • Engagement by date

Overall average engagement 2013 -14 • Engagement trends differed by mode of study and level of study • For example, 50% of part-time students had low engagement average • To avoid confounding bias, analysis restricted to full-time undergraduates

Relationship between engagement and progression


We tried to pick specific points in time that were relevant to the student experience. Therefore the dates are not evenly distributed. The trend line ignores the Christmas/ early January period. In future analyses we need to separate the Christmas and January.

Relationship between engagement and attainment

Impact of engagement upon attainment • Strong association between engagement and attainment • Although not as clear cut as engagement and progression

Where next?
")
Student Transition Survey • First year survey (23 rd Feb – 7 th March) • This time using questions from the UKES survey for comparison purposes with the sector • Questions about Dashboard – – – How frequently have you used it Has it changed the way you work at all Checking against questions about Belonging relationships with staff Academic performance • Early findings – 90% of students had used the Dashboard at least once – 27% of students reported that they had changed their behaviour in response to the data provided by the Dashboard
 – Mixture of")
Focus groups • Seven with students & staff (January – February) – Mixture of academic, administrative and professional services staff • Main themes – – – – What to do with your engagement score - today Explain Dashboard methodology in the dashboard Revise part-time/ placement/ exchange student methodology Far more communications Access to the dashboard (from emails/ NOW) Additional data sources (electronic resources & attendance data) Further data sources for day to day operations: NECs, AA Relationships between named staff and students Dashboard categories Assessment view Design/ layout/ possible work on visualization Staff notes page Possible periodic reporting to staff/ students

Developments to improve the methodology: new data sources/part time Other developments: e. g. NECs, user interface, feedback, student support services NTU: more communications, staff using the tool, students using the tool Tutorials, 1 -1 s, online support NTU Dash board team Existing data Stuff we’ve not thought of/ lessons learnt

Thank you • Any questions/ thoughts/ ideas?
- Slides: 33