Notice The views expressed here are those of


 Holistic approach to environmental problem solving Future environmental problem solving requires new")


 Indi ca Driver")

 Conditional probability: probability of something occurring when it is")
 = probability of Yunconditional ( probability) P")
 If eco-human connectivity exists, then first step is to disprove")
 Lattice sampling of")


 Housing")


")


- Slides: 31
Notice: The views expressed here are those of the individual authors and may not necessarily reflect the views and policies of the United States Environmental Protection Agency (EPA). Scientists in EPA have prepared the EPA sections, and those sections have been reviewed in accordance with EPA’s peer and administrative review policies and approved for presentation and publication. The EPA contributed funding to the construction of this website but is not responsible for it's contents. Mention of trade names or commercial products does not constitute endorsement or recommendation for use.
Exploring Connections Between Ecological Condition and Human Health: County-Level Aggregation for Maryland John F. Paul National Health and Environmental Effects Research Laboratory U. S. Environmental Protection Agency Research Triangle Park, North Carolina 27711 13 May 2003
Acknowledgements Steve Hedtke Michael Mc. Donald Wayne Munns Hillel Koren Jim Heltshe Allan Marcus
Presentation Outline • Context • Definitions • Working Null Hypothesis • Methods and datasets • Results • Next Steps
Context Public policy continues to evolve in response to new and complex social, economic, & environmental drivers. Science needs to anticipate, understand, assess, and reduce risks to human health and our environment to support mission of Agency (protect human health and safeguard the environment)
Context (cont’d) Holistic approach to environmental problem solving Future environmental problem solving requires new and creative approaches out-of-the-box thinking and risk taking
Long-Term Perspective Provide the Agency with the information, methods & models needed to make informed selections among policy options, identify emerging risks, & minimize unintended consequences
Hypothetical Example: Unintended Consequence of Improved Ecological Conditions on Human Health Outcomes Driver Environmental Issue Policy Unintended Consequence environmental protection surface water quality increased riparian buffers Increased risk of Lyme disease & exposure to fecal pathogens
Definition: Eco-Human Connectivity relationship between ecological systems and human health more than exposure-response link condition of ecological systems with human health not necessarily cause-effect
Starting Point View humans and ecological systems as one overall interacting system Some actions can affect both human health and condition of ecological systems Web of causation exists
Web of Causation Race Stream Condition Economy Land Use Agricultural Practices Transportation Infant Mortalit y Population Housing Social Conditions Income
Web of Causation r to a dic n I A Stressor(s) Indi ca Driver Stressor(s) tor B Indica tor C In di ca to r D Health Effect Xq Infant Mortality Benthic Impairment Ecological Effect X 2
Background for Working Null Hypothesis Independence: two things are independent if the probability of either is the same whether or not the other occurs If there actions that can affect both human health and condition of ecological systems, then the appropriate indicators for human health and condition of ecological systems are not independent
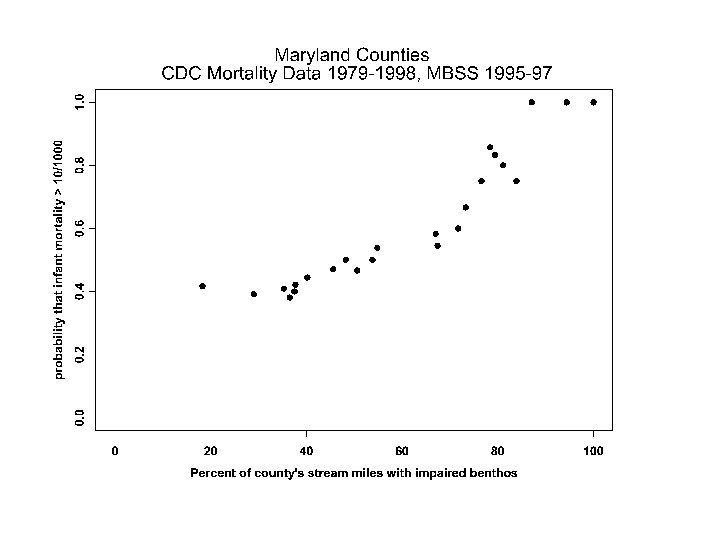
Background for Working Hypothesis (cont’d) Conditional probability: probability of something occurring when it is known that something else has occurred Quantitative measure of eco-human connectivity is an appropriately determined conditional probability For example, probability of occurrence of human health outcome for specified condition of ecological system Or more specifically, probability of higher than normal infant mortality for a county if more than half of streams in the county are impaired
Working Null Hypothesis P ( Y ) = probability of Yunconditional ( probability) P ( Y | X ) = probability of Y if X occursconditional ( probability) Eco-human connectivity null hypothesis: P ( Y | X ) = P ( Y ) or conditional probability equals unconditional probability
Working Null Hypothesis (cont’d) If eco-human connectivity exists, then first step is to disprove the null hypothesis Remainder of presentation is focused on this
Data Bases Used for Analyses Maryland Biological Stream Survey (1995 -97) Lattice sampling of 17 major drainage basins over three-years with probability design � Approximately 300 stream segments sampled each year � Use data for benthic IBI from 1995 -97 Compressed Mortality Data - CDC Wonder (1978 -1998) � Under 1 year of age � All races � Both genders � All causes of death NOAA Coastal Assessment and Data Synthesis System (1990) � Census of agriculture � Fertilizer use and sales � Pesticides � Land Use /Land Cover � Socioeconomics
Why Select Infant Mortality and Stream Condition? Infant mortality has long been considered a sensitive indicator of the impact of socioeconomic disparities on the health of populations (Gortmaker & Wise 1997) Condition of bottom-dwelling communities in streams is integrative of environmental impacts occurring over recent time
Why Maryland? Only state that has reported survey data for stream condition summarized at county level
Income Transportation Population Socioeconomi c Conditions Infant Mortality Housing Agricultural Practices Race Economy Land Use Stream Condition
Income Transportation Population Socioeconomi c Conditions P ( Y | X > Xo) Housing Agricultural Practices Race Economy Infant Mortality (Y) Land Use Stream Condition (X)
Application of Conditional Probability Approach Preliminaries Ability to identify undesired human health outcome level exists, e. g. , infant mortality greater than 10 per 1000 Treat county as fundamental unit – equal weighting Critical concept 50% of stream miles impaired in county means probability of observing impaired streams in county is 50%
The basic underlying question: Is the association real or fantasy? Answer by trying to disprove null hypothesis
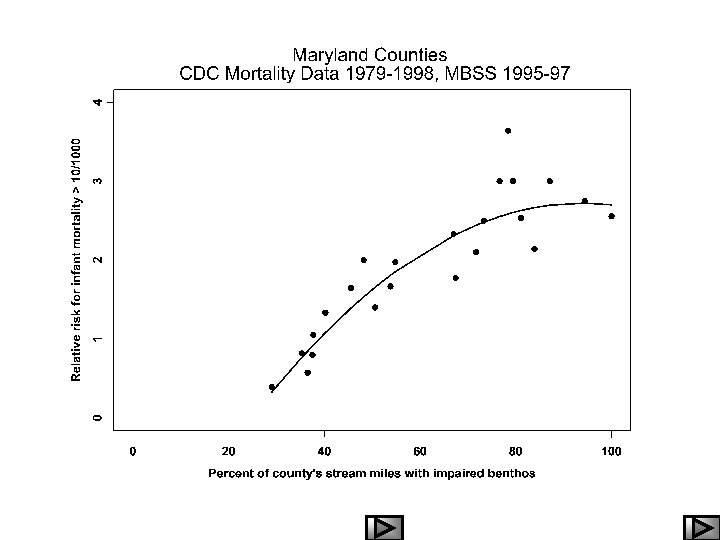
Test null hypothesis for individual stream condition value Can’t use t-test, two sets tested are not independent Result using bootstrap estimation: If greater than 78% of stream miles in county are impaired there is less than 2% chance that value for probability of infant mortality exceeding 10/1000 could have occurred randomly Look at entire range of values to determine when null hypothesis disproved – Bayesian model to account for uncertainty
Bayesian Model Probability of infant mortality > 10/1000 (mean and 95% posterior intervals)
Md: MBSS Pa, WVA: EMAP-SW WVa Md Pa
Where is this all going? Continue evaluation of eco-human connectivity for additional data sets Interesting observations can lead to hypothesis generation Useful for identification of gaps/needs/unidentified problems Web of causation - Possible tool to help target management actions Web of causation - Conceptual model for problem identification/formulation in risk assessment Limitation: County is smallest level of aggregation for mortality data
Healthy Ecosystems – Healthy People Unhealthy Ecosystems – Unhealthy. Streams People – Unhealthy Children
THE END