Notice The views expressed here are those of


 2002 Gotolatin. com")


 • Reserve design • Habitat as")


 Observed (dynamic)")
 Observed (dynamic)")
 Observed (dynamic)")
 most none")


, The National Research")


- Slides: 37
Notice: The views expressed here are those of the individual authors and may not necessarily reflect the views and policies of the United States Environmental Protection Agency (EPA). Scientists in EPA have prepared the EPA sections, and those sections have been reviewed in accordance with EPA’s peer and administrative review policies and approved for presentation and publication. The EPA contributed funding to the construction of this website but is not responsible for it's contents. Mention of trade names or commercial products does not constitute endorsement or recommendation for use.
Life-History Traits and Landscape Patterns: Predicting Population Persistence in the Middle-Atlantic Region © Tom & Pat Leeson, Photo Researchers Inc. Joshua J. Lawler National Research Council, US EPA, Corvallis, OR Nathan Schumaker US EPA, WED NHEERL, Corvallis, OR Denis White US EPA, WED NHEERL, Corvallis, OR
Overview • Reserve selection • Addressing population persistence • Modeling population dynamics
Mohican S. A. Copyright (c) 2002 Gotolatin. com
Reserve-Selection Representation Persistence
Reserve-Selection for Representation • Species richness • Rare species • Complementarity
Reserve-Selection for Representation Priority areas for 769 species
Reserve-Selection for Population Persistence • Redundancy (multiple sites) • Reserve design • Habitat as a surrogate • Accounting for threats • Population Viability Analysis (PVA) feasibility accuracy (minimize edge, maximize connectivity)
Simple Habitat Relationships
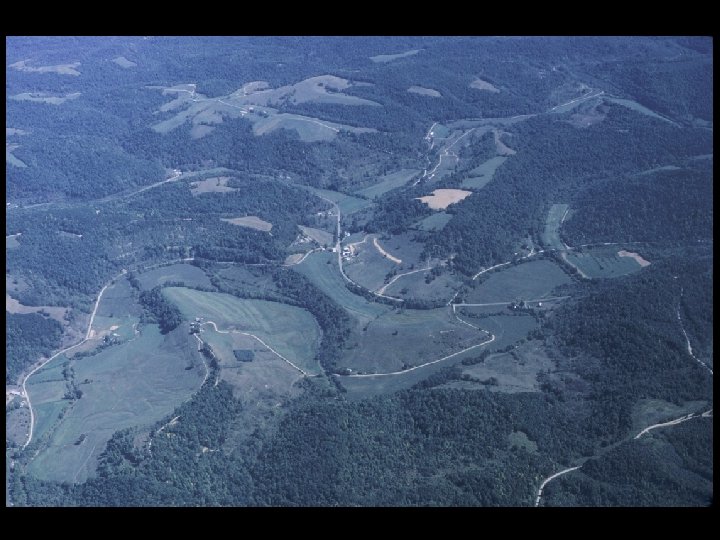
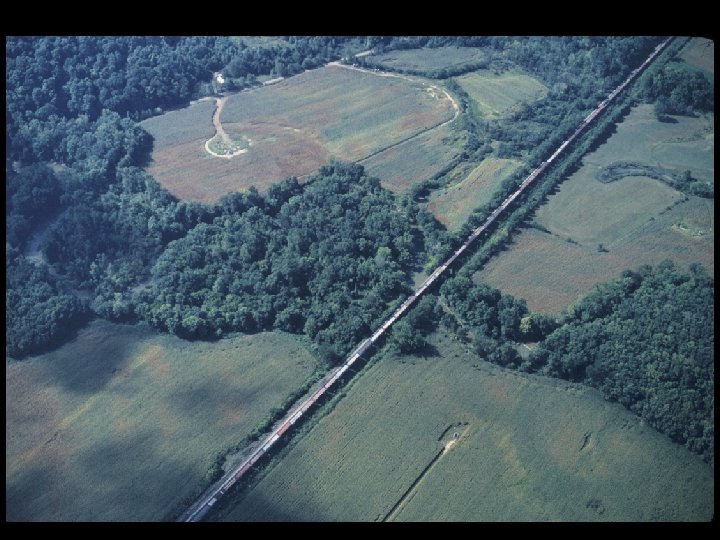
S = survival rates R = reproductive rates M = movement events The site scale is characterized by habitat quality Local population dynamics evolve within groups linked by movement Habitat pattern generates regional population trends
Surrogate Species Northern Goshawk Red-shouldered Hawk Cooper’s Hawk © Tom & Pat Leeson, Photo Researchers Inc. Photo by Denis Oehmke
Model Inputs • land-cover • fecundity • survival • dispersal • habitat relationships • area requirements
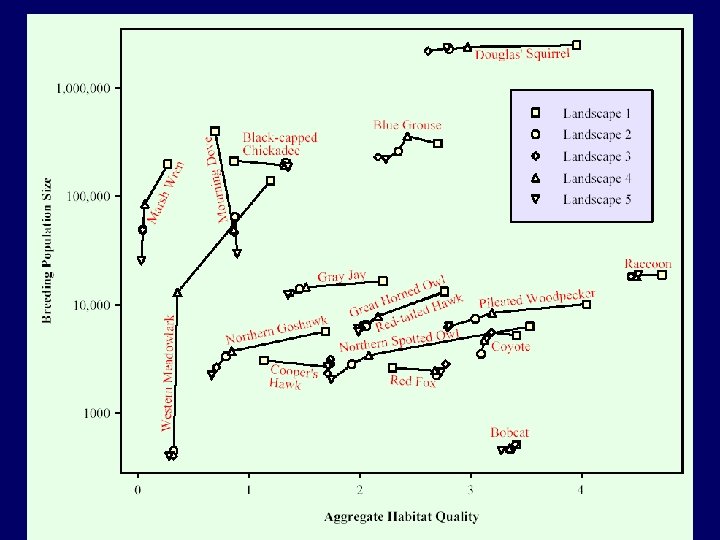
Population size Model Results Year
Model Results Predicted (static) Observed (dynamic)
Model Results Predicted (static) Observed (dynamic)
Model Results Predicted (static) Observed (dynamic)
Mapping Source Habitat Observed (dynamic) most none
Simple Habitat vs. Source Habitat Simple Habitat Best Source Habitat best most worst none
Addressing Persistence in Reserve-Selection Priority areas for 769 species Priority Sites Goshawks most none
Addressing Persistence in Reserve-Selection Priority areas for 769 species Goshawk Priority Sites for Three Hawk Species Red-shouldered Hawk Cooper’s Hawk
Conclusions • Simple habitat relationships will not always be adequate • Spatially explicit models can help to inform reserve selection • A combination of strategies will likely work best • Additional applications • • Linking life history traits and landscape patterns Future scenarios
Acknowledgements Betsy Smith and EPA’s Regional Vulnerability Assessment Program (Re. VA), The National Research Council (NRC), EPA WED Corvallis, and Pilar Hernandez of Nature. Serve
Model Sensitivity Goshawk Red-shouldered Hawk Cooper’s Hawk
Representing Vulnerability Basic General Threats: What areas are heavily impacted by factors likely to threaten the persistence of multiple species?
Three Measures of Vulnerability Development 42% 10% 5% 1% 0% Agriculture 44% 10% 5% 2% 0% Open Mines 9% 2% 1% 0. 5% 0%
Irreplaceability All Species 8. 977 0. 108 0. 021 0. 005 0. 000
Representation and Vulnerability Agriculture Irreplaceability Development Vulnerability Open Mines
Measuring Vulnerability • % urban/suburban • % agriculture • % open mines
Two Methods for Integrating Vulnerability Irreplaceability and Vulnerability Complete Coverage with Vulnerability Constraint
Expected Modeled population change
Simple Habitat Relationships best worst