
Northern Ireland Findings from the Child Welfare Inequalities

- Slides: 20
Northern Ireland Findings from the Child Welfare Inequalities Research Project (CWIP) Dr Lisa Bunting (QUB), Dr Gavin Davidson (QUB) and Claire Mc. Cartan (QUB)
THE NORTHERN IRELAND STUDY • Investigating the relationship between area level deprivation and child welfare interventions (CPR/LAC) • Data accessed via the Honest Broker Service • All open cases at 31 st March 2015 involving children (0 -17 years old) recorded on SOSCARE • Postcode at time of referral linked to Super Output Area (SOA) • SOAs are a small area geography - 890 SOAs with an average population of 2, 000 people.
SOSCARE and Official Statistics • CPR – 100 less in BHSCT • LAC – 200 less in BHSCT and 100 more in SEHSCT and WHSCT • Family or origin postcode? • Aggregate returns? • Manual inclusion of cases not on SOSCARE?
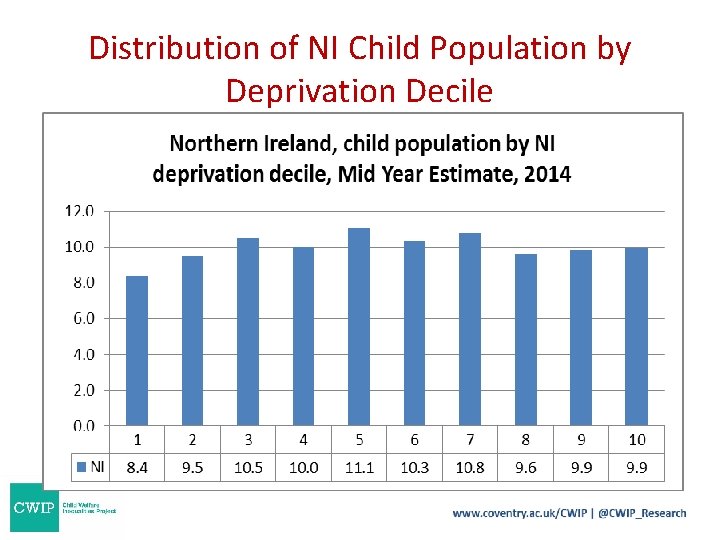
Distribution of NI Child Population by Deprivation Decile
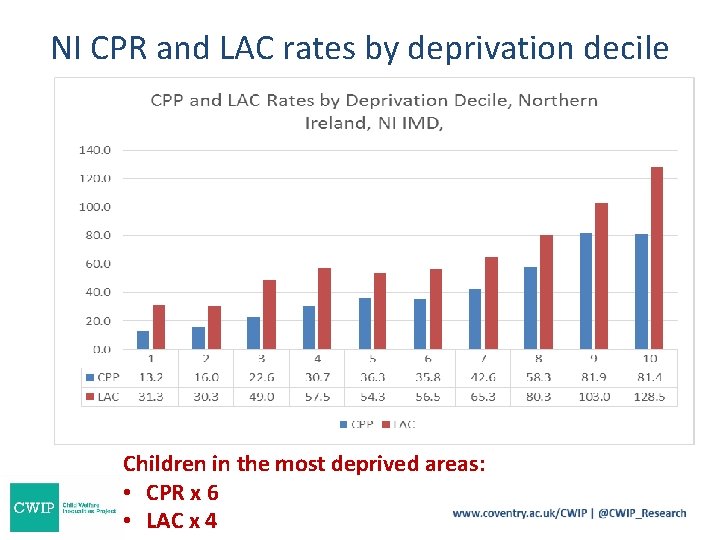
NI CPR and LAC rates by deprivation decile Children in the most deprived areas: • CPR x 6 • LAC x 4
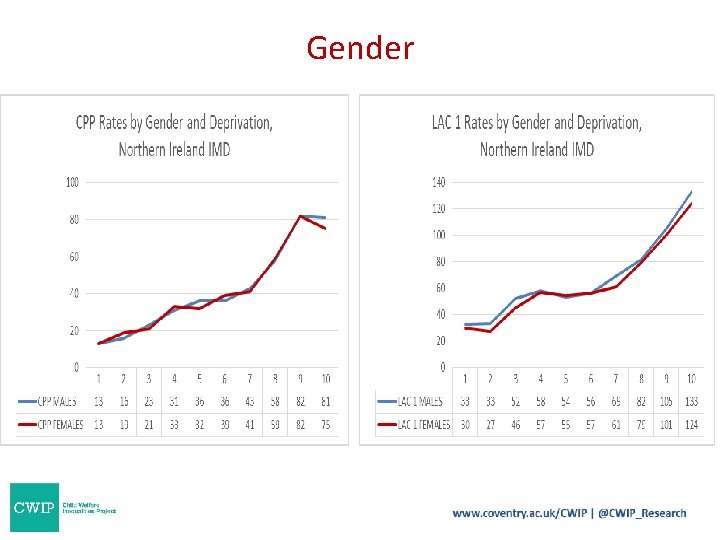
Gender
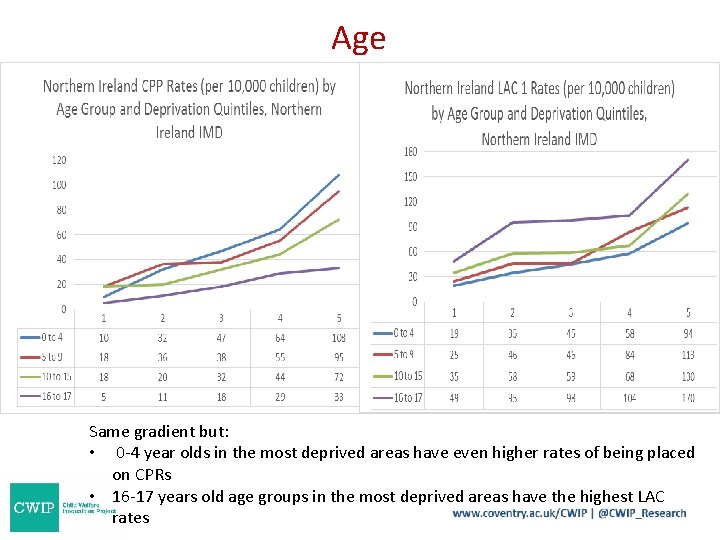
Age Same gradient but: • 0 -4 year olds in the most deprived areas have even higher rates of being placed on CPRs • 16 -17 years old age groups in the most deprived areas have the highest LAC rates
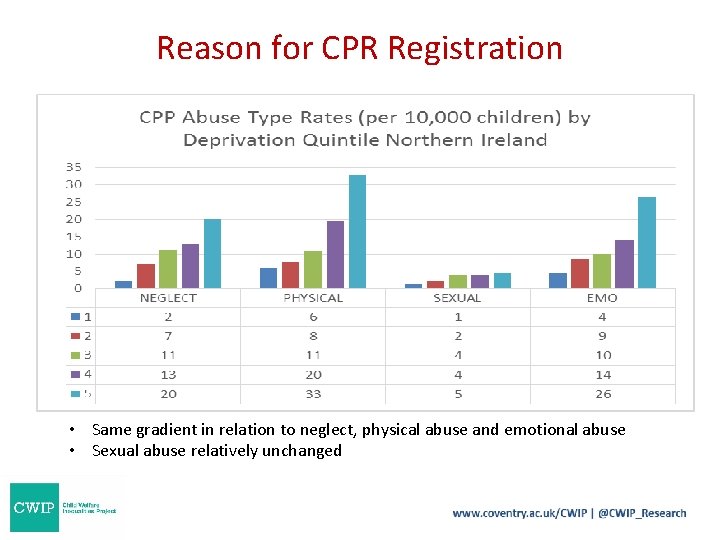
Reason for CPR Registration • Same gradient in relation to neglect, physical abuse and emotional abuse • Sexual abuse relatively unchanged
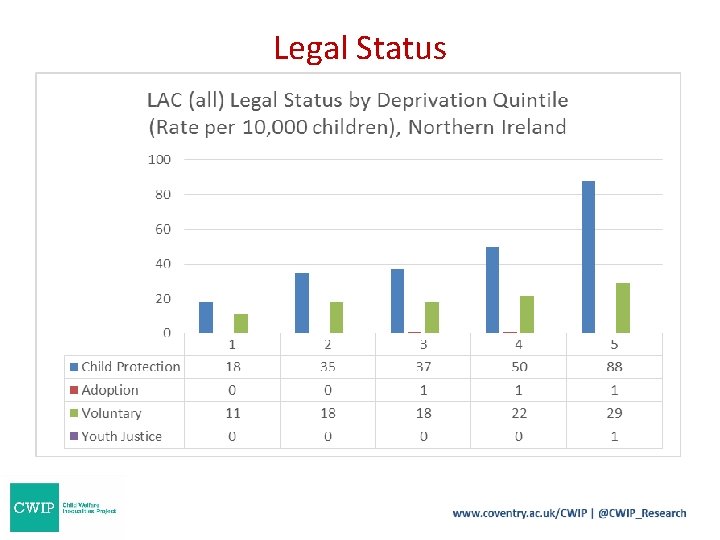
Legal Status
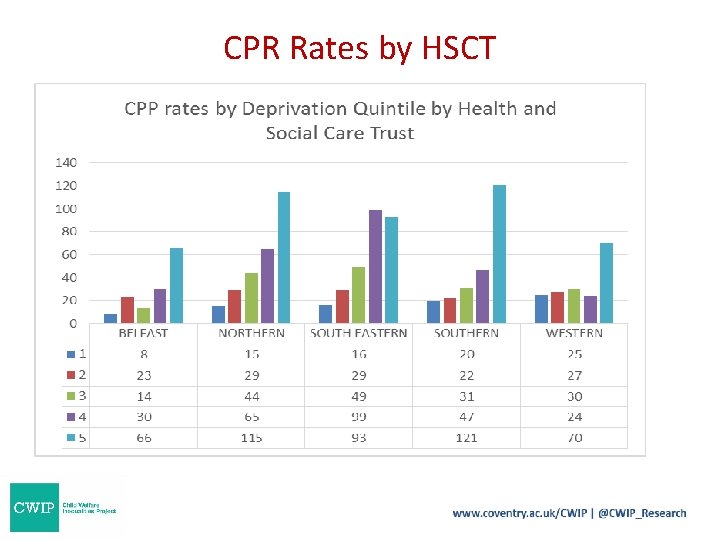
CPR Rates by HSCT
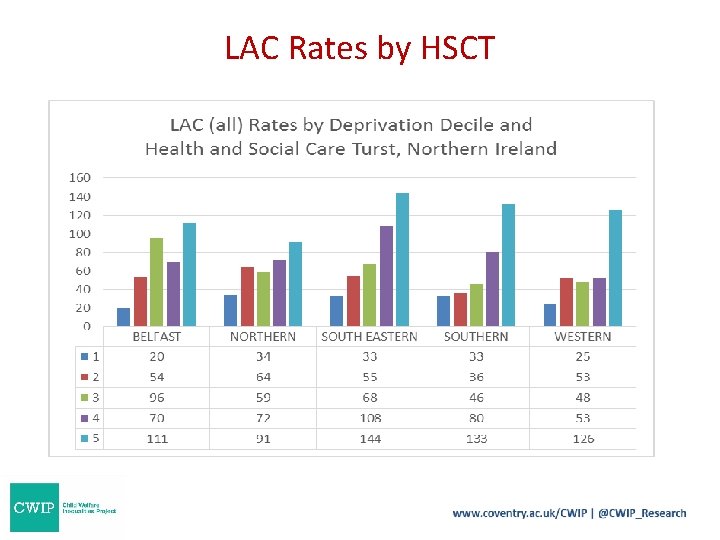
LAC Rates by HSCT
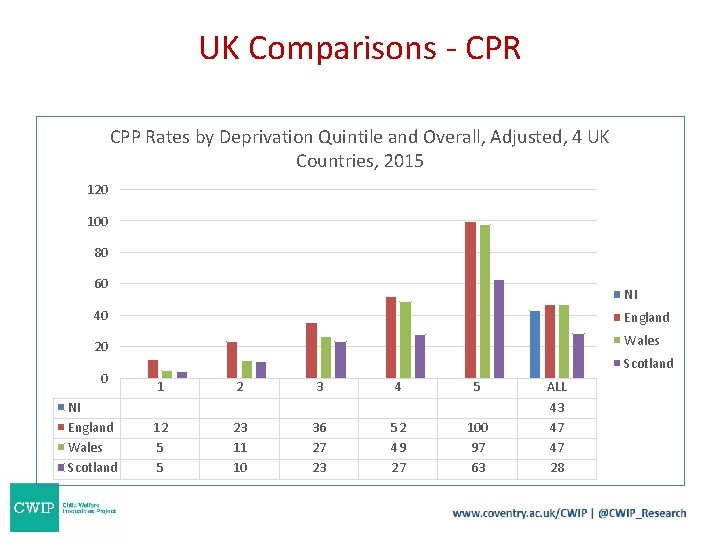
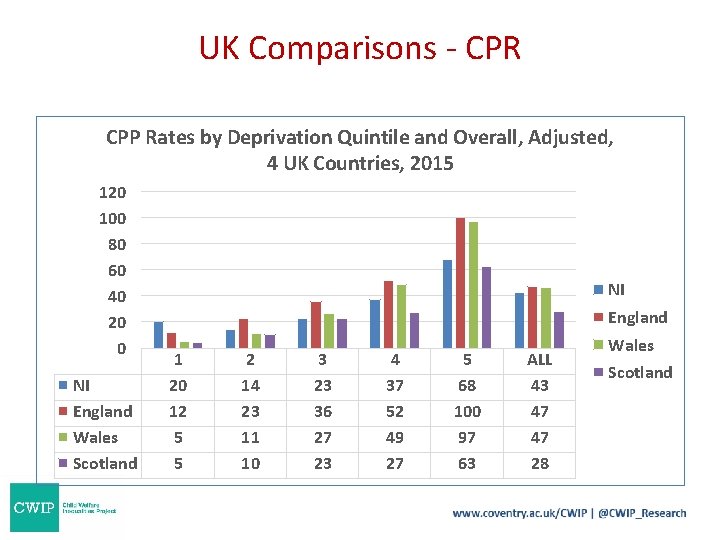
UK Comparisons - CPR CPP Rates by Deprivation Quintile and Overall, Adjusted, 4 UK Countries, 2015 120 100 80 60 NI 40 England 20 Wales 0 NI England Wales Scotland 1 2 3 4 5 12 5 5 23 11 10 36 27 23 52 49 27 100 97 63 ALL 43 47 47 28
UK Comparisons - CPR CPP Rates by Deprivation Quintile and Overall, Adjusted, 4 UK Countries, 2015 120 100 80 60 40 20 0 NI England Wales Scotland NI England 1 20 12 5 5 2 14 23 11 10 3 23 36 27 23 4 37 52 49 27 5 68 100 97 63 ALL 43 47 47 28 Wales Scotland
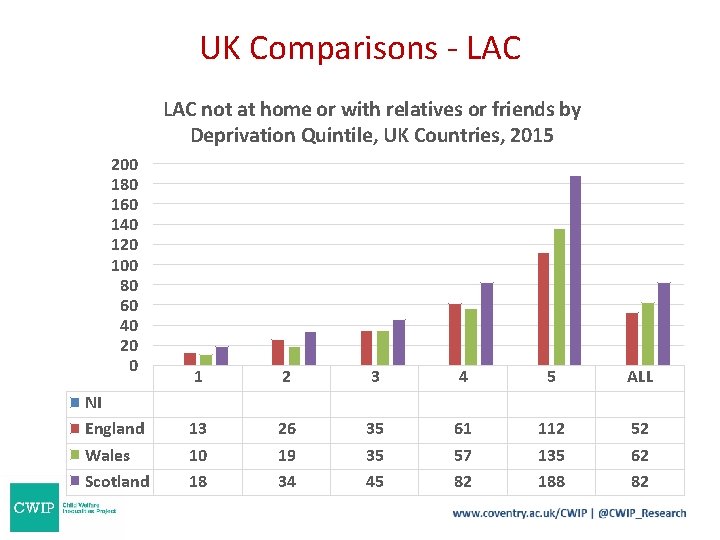
UK Comparisons - LAC not at home or with relatives or friends by Deprivation Quintile, UK Countries, 2015 200 180 160 140 120 100 80 60 40 20 0 NI England Wales Scotland 1 2 3 4 5 ALL 13 10 18 26 19 34 35 35 45 61 57 82 112 135 188 52 62 82
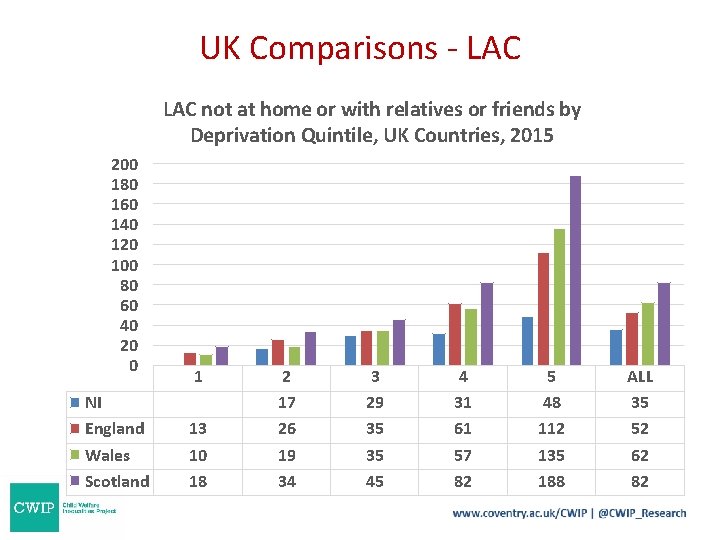
UK Comparisons - LAC not at home or with relatives or friends by Deprivation Quintile, UK Countries, 2015 200 180 160 140 120 100 80 60 40 20 0 NI England Wales Scotland 1 13 10 18 2 17 26 19 34 3 29 35 35 45 4 31 61 57 82 5 48 112 135 188 ALL 35 52 62 82
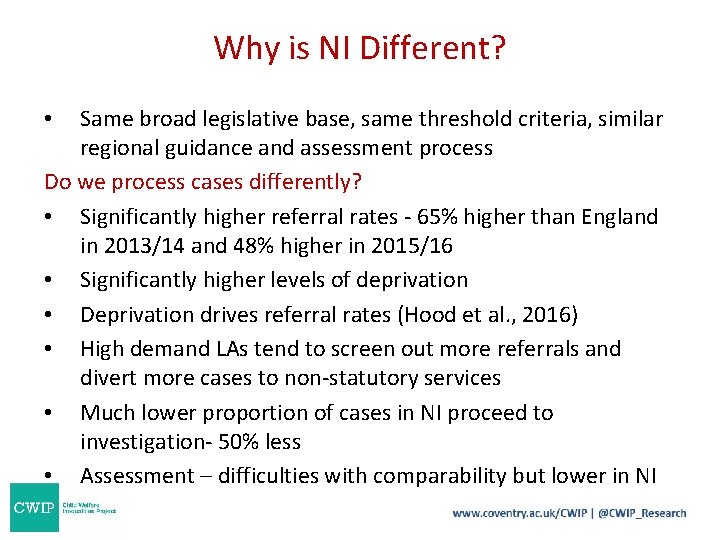
Why is NI Different? Same broad legislative base, same threshold criteria, similar regional guidance and assessment process Do we process cases differently? • Significantly higher referral rates - 65% higher than England in 2013/14 and 48% higher in 2015/16 • Significantly higher levels of deprivation • Deprivation drives referral rates (Hood et al. , 2016) • High demand LAs tend to screen out more referrals and divert more cases to non-statutory services • Much lower proportion of cases in NI proceed to investigation- 50% less • Assessment – difficulties with comparability but lower in NI •
Why is NI Different? Do we have better, more integrated support? Well developed community and voluntary sector • Development of integrated Family Support Hubs since 2009 which cover all of NI • Links with anti-poverty policy, family support and area level initiatives (e. g. neighbourhood renewal areas) Is it attitudinal? • Poverty more widespread? • Better recognition the impact of poverty
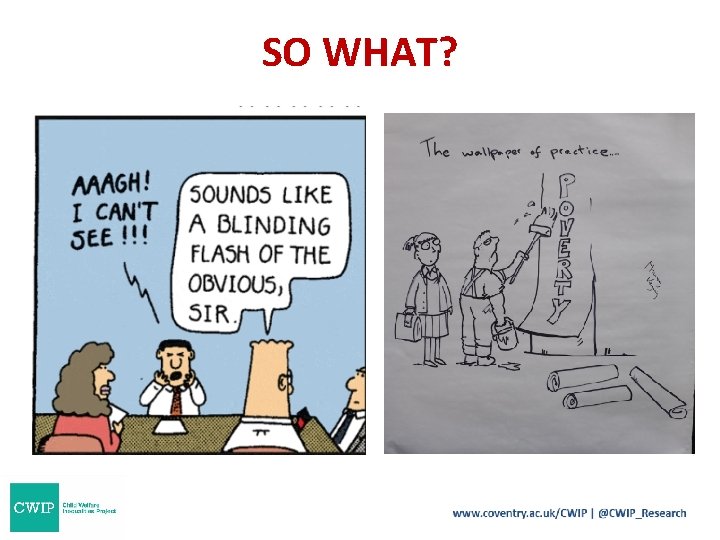
SO WHAT?
Next steps? Policy • Alignment between anti-poverty policies, child protection, family support policies and social work strategies Services/Practice • Continued investment and development of family support hubs • Services which focus on income maximisation and debt relief services Research/Data • Routine collection of data on family background • Extension of case study work to Northern Ireland