North Wales Tidal Lagoon Jim Poole 2 October

North Wales Tidal Lagoon Jim Poole 2 October 2008

Concept T

Tidal Lagoon – Plan View Dam wall Outside Inside Water passing through turbines

Tidal Lagoon – Cross Section Dam Wall Water at different level inside and outside lagoon Sea Bed

Operating Cycle - Simplified Outside Inside Outside

Build up Head Generate Electricity Build up Head

Tidal Lagoon – Operation Step 1: Build up head inside the lagoon by water level falling outside from high tide to low tide T

Tidal Lagoon – Operation Step 2: Generate electricity by emptying lagoon from high tide level to low tide level T

Tidal Lagoon – Operation Step 3: Build up head outside lagoon by water rising from low tide to high tide T

Tidal Lagoon – Operation Step 4: Generate electricity by filling lagoon from low tide level to high tide level T
")
Proposed Location (Indicative)
")
Wind Farms (npower renewables)

For maximum generation n Water transfer takes place at high and low tide The lagoon fills and empties completely over the full tidal range Hence the mean head is equal to half the tidal range

Maximum generation over 2 tidal cycles Potential Energy = 2 g A T 2 = density of sea water g = acceleration due to gravity A = Area of lagoon T = Tidal range For proposed scheme (60 km 2), maximum power = 343 MW

Practical Operation

Practical Operation n Only half the water is exchanged each time the lagoon empties or fills (rather than all of it) The mean head is roughly 1/3 of the tidal range (rather than a half) Hence electricity generated is only 1/3 of that potentially available

MAREC Paper – Headlines n n n Impoundment area: 60 km 2 Mean tidal range: 5. 1 m Mean power output: 110 MW Construction cost: £ 285 m - £ 540 m Net income @ 3 p/k. Wh: £ 25. 9 m/yr Design life: 100 yr (Turbines/Generators: 40 yr) (Mean power output of wind farm covering same area: 168 MW)

Marec Paper – Reference n Evans, S. , Poole, J. E. P. and Williams, K. P. , “The North Wales Offshore Tidal Impoundment Scheme: a Preliminary Study of the Requirements, Constraints and Opportunities”, Third International Conference on Marine Renewable Energy, IMar. EST, (Ed. C. French), Newcastle, July 2004, pp. 97 -107

The "Four-legged Table" A Model for Sustainability Quality of Life Env Soc Ec Nat Res

The "Four-legged Table" Attacking the Gap

Context for North Wales Tidal Lagoon n The global picture n The local area n UK SD framework and energy policy

Global Context n Climate change n Rising sea level n Run-down in supplies of oil and gas n Increased use of renewable energy

Local Area - Environment n n n n Shallow, gently-shelving coastal bay Sea bed predominantly gravely sand Mean spring tidal range: 6. 7 m Mean neap tidal range: 3. 5 m Coastal land below highest tide level Sea wall in Towyn breached in 1990 One significant river – Afon Clwyd

Local Area – Towns n Victorian seaside resorts n “Faded glamour” n n Rhyl contains one of the most deprived electoral wards in Wales Now undergoing some redevelopment

Rhyl

Closed August 2007

April 2004

April 2004

April 2004

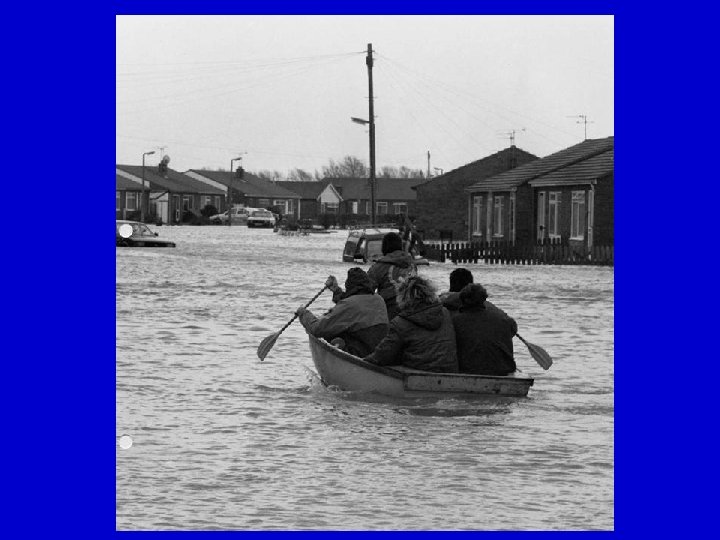
Towyn 1990

Towyn – strengthened defences

Cap’n Noahs Meeting place for North Wales Coast Renewability Trust

Energy Review 2006 General Strategy: n n Save energy Increase generation from renewables – from 4% to 20% n Strengthen EU Emissions Trading Scheme n Streamline planning system

Energy Review 2006 Tidal Impoundment Schemes: n n n Potential to make significant contribution to carbon reductions But generally not competitive Interested in improving understanding of tidal resource
: “We")
UK SD Commission Turning the Tide: Tidal Power in the UK (Oct 2007): “We therefore recommend that the Government investigates options to encourage one or more tidal lagoon demonstration projects. This could take the form of inclusion in the Renewables Obligation, or an open competition to solicit private sector or community interest. The additional expenditure would not need to be large, but the potential benefits could be extensive considering the resource available, both in the UK and internationally”.

Size and Positioning of Tidal Lagoon n Theory n Practice n Options
 For a given shape: n n Construction costs = a L Power")
Theory (1) For a given shape: n n Construction costs = a L Power generated = b L 2 Where a, b are constants, L is the length of the impoundment wall So: n Bigger is better
 All other things being equal: n n Rounder is better (more volume")
Theory (2) All other things being equal: n n Rounder is better (more volume enclosed per unit length of impoundment wall) Shallower is better (less “wasted” height below tidal range)

Practice n n n Consider potential uses Consider potential options for size and location Assess options against uses

Potential Uses n Power generation n Coastal protection n Recreational boating n Marina facilities n Enhancing biodiversity (“atoll”)

Learn from elsewhere

Blyth – Power Generation

Blyth – Energy Research

Barry – Recreational Boating

Swansea Marina

Biodiversity

Size and Positioning Options n Offshore n Inshore n Onshore n Maximum power n Demonstration

Offshore Minimum visual impact River Clwyd

Inshore Better access from coast for recreational purposes

Onshore Response to rising sea levels Doubles as a sea defence

Maximum Power Follows contour lines

Demonstration Part of a wider regeneration scheme

Demonstration - Details Visitor Centre Marina Pier Tramway

Demonstration Scheme

Marks out of Ten? Off In On Max Dem Power generation 5 5 7 10 2 Coastal protection 3 6 10 7 2 Recreational boating Marina 3 6 10 7 2 2 5 10 7 7 Biodiversity 7 7 7 10 3

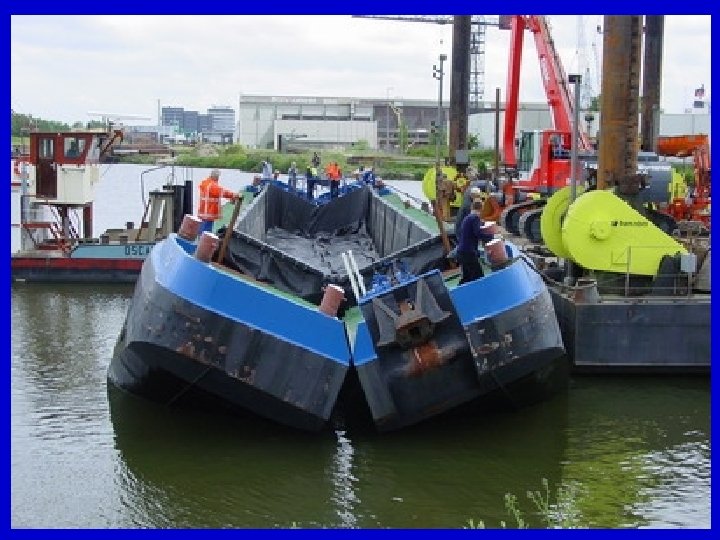
Nature of Construction Options n n Traditional embankment dam Geo-textile containers, filled with sand gravel

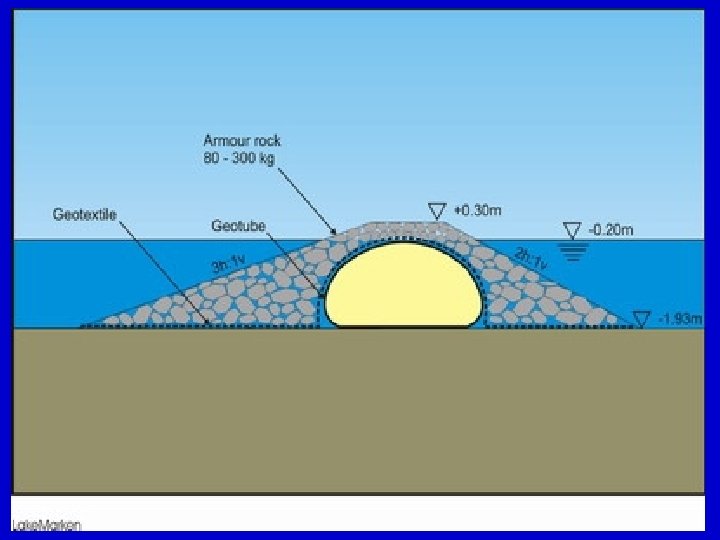
Traditional Embankment Dam Rock Armour Geo-membrane Layer Rubble Fill

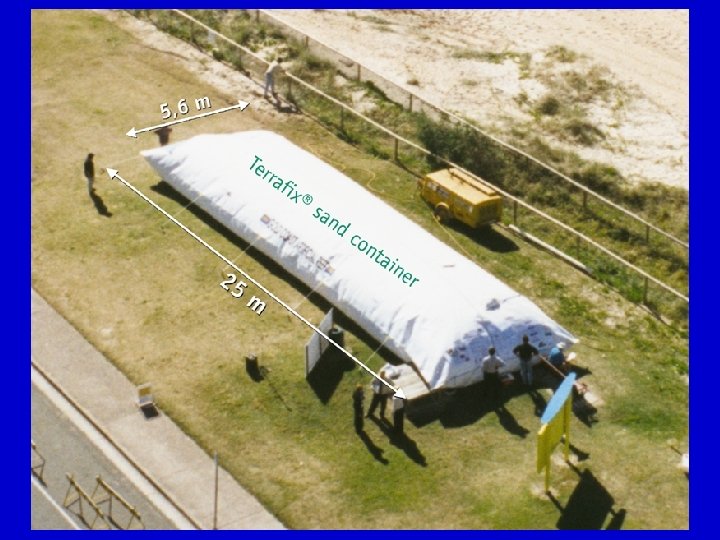
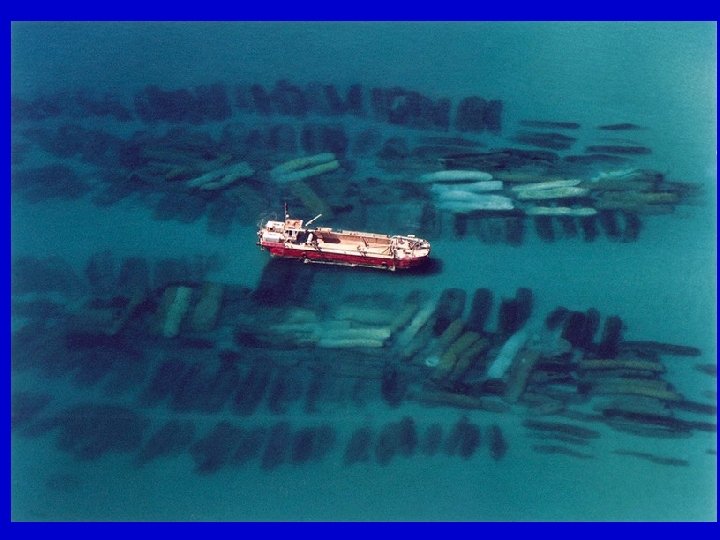
Geo-textile Containers Filled with Sand Gravel
 & Soilfilters Australia pty. ltd. Ten.")
Geo-textile Containers n n ASR ltd. (New Zealand) & Soilfilters Australia pty. ltd. Ten. Cate Geosynthetics (Netherlands)

Links with Southern Hemisphere n n ASR ltd. – New Zealand engineering consultancy, specialising in the design and construction of multi-purpose reefs Soilfilters Australia pty. Ltd – manufacturer of geo-textile containers

Geo-textile Containers Soilfilters Products: n n n “Terrafix” – a non-woven staple fibre geotextile “Softrock” – Terrafix containers filled with sand Example – Narrowneck Reef, Australia


Web Links – ASR ltd. http: //www. asrltd. co. nz/downloads. htm http: //www. soilfilters. com. au/cases/Marine. Coastal/case 004. html www. mountreef. co. nz
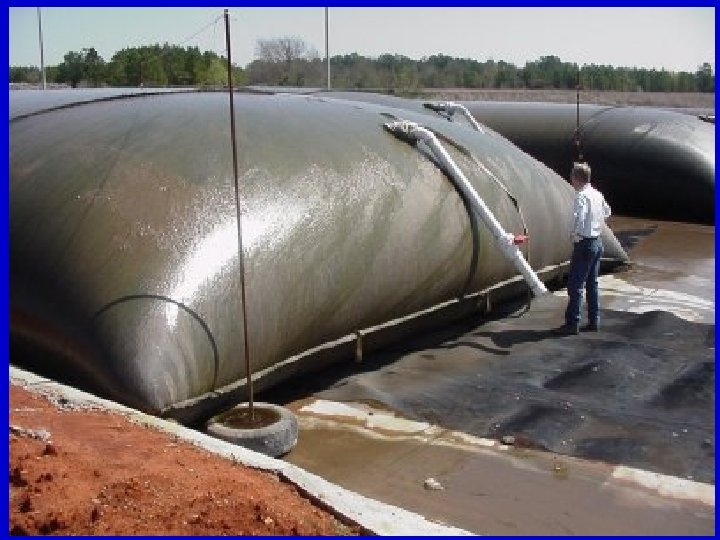
 Geotube (water depth")
Ten. Cate Geosynthetics n n Geocontainer (water depth > 3 metres) Geotube (water depth < 3 metres)
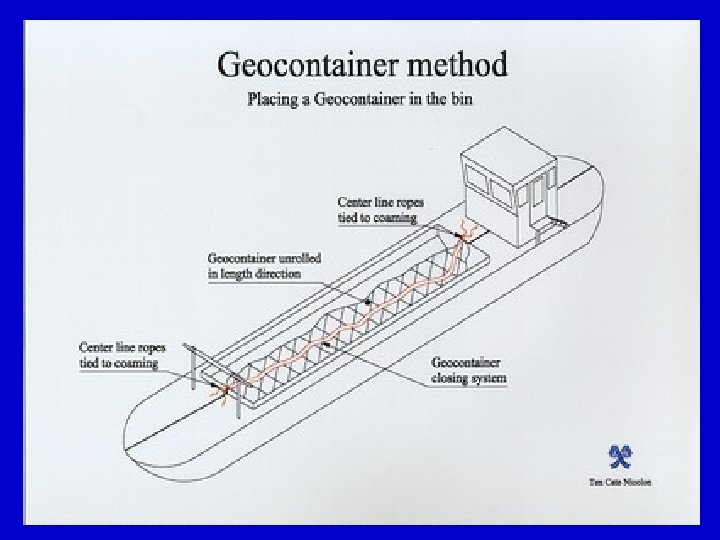


Geotube

Ten. Cate Geosynthetics Web Link http: //www. tencate-nicolon. com/

Geo-textile Containers Advantages n Efficient use of resources n Reduced transport costs n Rapid construction n Potentially reversible n Broader relevance to coastal management at time of rapid climate change

Tidal Lagoons Different Methods of Operation The aim is to extend the period of electricity generation over the tidal cycle
 m = Mass of")
Calculation of Energy Converted E=mgh E = Energy converted (J) m = Mass of water rising or falling (kg) g = Acceleration due to gravity (m/sec 2) h = Height through which water rises or falls (m)
 = T m Density of sea")
Calculation of Energy Converted Taking: Tidal range (T) = T m Density of sea water = 1000 kg/m 3 Acceleration due to gravity (g) = 10 m/sec 2 The energy converted from tidal to electrical has been calculated for 1 m 2 of the lagoon

Fluctuation in sea level with the tides – a sine wave

Build up Head Generate Electricity Build up Head

Option 1: Lagoon fills and empties over full tidal range with transfer taking place at high and low tide.

Level of water inside impoundment
 Mode of generation Option 1 (At")
Net electricity generated per tidal cycle (Joules/metre 2) Mode of generation Option 1 (At high and low tide) T = Tidal Range (m) Electricity generated 10, 000 T 2

Problem with Option 1 A huge amount of electricity would be generated over short periods of time. This would require high installed generating capacity and would not match the pattern of electricity demand. The challenge is to extend the period of generation over the tidal cycle.

Option 2: Lagoon fills and empties over full tidal range, with transfer starting when the head reaches 0. 25 T.

Level of water inside impoundment
 Mode of generation Option 1 (At")
Net electricity generated per tidal cycle (Joules/metre 2) Mode of generation Option 1 (At high and low tide) Option 2 (Starting with head of 0. 25 T) T = Tidal Range (m) Electricity generated 10, 000 T 2 4, 360 T 2

Problem with Option 2 Rapid filling and emptying of lagoon required at either end of the tidal cycle.

Level of water inside impoundment

Problem with Option 2 Rapid filling and emptying of lagoon required at either end of the tidal cycle. The solution is to speed up filling and emptying by active pumping. This can result in a net increase in the electricity generated, since pumping takes place against a low head and generation with a higher head.

Level of water inside impoundment

Conditions for pump storage For all tides the level inside the lagoon would be kept within the range currently observed for a natural spring tide. The water level inside the lagoon is quarter of a cycle out of phase, when compared with the level outside. This mode of operation termed “ECOSTAR”

ECOSTAR Sustainable net Energy Capture Obtainable by Storage for Tidally Amplified Release. Dr Stuart H Anderson, 2006.

Correction for calculating net electricity generation with pump storage The energy for pumping has been multiplied by an arbitrary factor of 1. 25 to reflect lower efficiency when compared with electricity generation.

Option 3: Lagoon fills and empties over full tidal range with active pumping to high and low tide level. This option would be used for spring tides.

Level of water inside impoundment
 Mode of generation Option 1 (At")
Net electricity generated per tidal cycle (Joules/metre 2) Mode of generation Option 1 (At high and low tide) Option 2 (Starting with head of 0. 25 T) Option 3 (Pump storage within T) T = Tidal Range (m) Electricity generated 10, 000 T 2 4, 360 T 2 6, 930 T 2

Option 4: Lagoon fills and empties over full tidal range with active pumping to a level 0. 17 T higher than external high tide and 0. 17 T lower than external low tide level. This option would be used for medium tides.

Level of water inside impoundment
 Mode of generation Option 1 (At")
Net electricity generated per tidal cycle (Joules/metre 2) Mode of generation Option 1 (At high and low tide) Option 2 (Starting with head of 0. 25 T) Option 3 (Pump storage within T) Option 4 (Pump storage of +/- 0. 17 T) T = Tidal Range (m) Electricity generated 10, 000 T 2 4, 360 T 2 6, 930 T 2 9, 020 T 2

Option 5: Lagoon fills and empties over full tidal range with active pumping to a level 0. 5 T higher than external high tide and 0. 5 T lower than external low tide level. This option would be used for neap tides.

Level of water inside impoundment
 Mode of generation Option 1 (At")
Net electricity generated per tidal cycle (Joules/metre 2) Mode of generation Option 1 (At high and low tide) Option 2 (Starting with head of 0. 25 T) Option 3 (Pump storage within T) Option 4 (Pump storage of +/- 0. 17 T) Option 5 (Pump storage of +/- 0. 5 T) T = Tidal Range (m) Electricity generated 10, 000 T 2 4, 360 T 2 6, 930 T 2 9, 020 T 2 12, 660 T 2

Option 6: Lagoon fills and empties over the top half of the tidal range with generation on the ebb tide only. This is the operating method currently proposed for the Severn Barrage.

Level of water inside impoundment
 Mode of generation Option 1 (At")
Net electricity generated per tidal cycle (Joules/metre 2) Mode of generation Option 1 (At high and low tide) Option 2 (Starting with head of 0. 25 T) Option 3 (Pump storage within T) Option 4 (Pump storage of +/- 0. 17 T) Option 5 (Pump storage of +/- 0. 5 T) Option 6 (Generation on ebb tide only) T = Tidal Range (m) Electricity generated 10, 000 T 2 4, 360 T 2 6, 930 T 2 9, 020 T 2 12, 660 T 2 2, 930 T 2
 Mode of generation Option 1 (At")
Mean power output over tidal cycle (MW/km 2) Mode of generation Option 1 (At high and low tide) Option 2 (Starting with head of 0. 25 T) Option 3 (Pump storage within T) Option 4 (Pump storage of +/- 0. 175 T) Option 5 (Pump storage of +/- 0. 5 T) Option 6 (Generation on ebb tide only) T = Tidal Range (m) Mean Power output 0. 224 T 2 0. 098 T 2 0. 155 T 2 0. 202 T 2 0. 283 T 2 0. 065 T 2
 Mode of Operation Tidal")
Worked Example: Electricity generated per tidal cycle (k. J/m 2) Mode of Operation Tidal Range (m) 6 Option 3 (Pump storage within T) Option 4 (Pump storage of 0. 17 T) Option 5 (Pump storage of 0. 5 T) Option 6 (Ebb only generation 9 12 250 560 1, 000 325 730 1, 300 455 1, 025 1, 820 105 235 420
 Mode of Operation Tidal")
Worked Example: Mean power output over tidal cycle (MW/km 2) Mode of Operation Tidal Range (m) 6 Option 3 (Pump storage within T) Option 4 (Pump storage of 0. 17 T) Option 5 (Pump storage of 0. 5 T) Option 6 (Ebb only generation 9 12 5. 6 12. 5 22. 4 7. 3 16. 4 29. 1 10. 2 23. 0 40. 8 2. 4 5. 3 9. 4

Benefits of ECOSTAR operation High rate of energy capture. n More even energy output over lunar cycle. n Generation over a larger proportion of individual tidal cycle. n More flexible operation – potentially better match with energy demand. n

ECOSTAR turbine specification n Generate with low head. n Generate in both directions. n n Pump at similar rates and with similar efficiency. Allow fish to pass without harm.
 for all tides,")
Pump Storage: Recommendations n n n Operate pump storage (Option 3) for all tides, but maintain level inside the impoundment within the overall tidal range occupied by the maximum springs under natural conditions Empty and fill the impoundment at a flow rate equivalent to that operating during a normal maximum spring tide By observing these rules, the overall environmental impact during pump storage will fall within the range occurring under natural conditions – albeit with the largest tides

Generation on ebb and flood tides – with active pumping Spring Tide

Medium Tide

Neap Tide

Way Forward Two-way generation with active pumping. n Construct using local material in geotextile containers. n Consider multiple uses at design stage. n Consider siting onshore to double as a sea defence. n Rhyl ideal as a demonstration site. n
 Minimise energy demands")
Suggested Energy Strategy n n Identify energy demands (amount, time, place) Minimise energy demands Identify energy supplies (amount, time, place) Match supplies to demands

Suggested Energy Strategy To reduce CO 2 emissions by 75%: n n Halve energy demands Of the remaining demand meet half from renewable sources

Tidal Lagoons Predictable energy supply: n Amount n Timing

Tidal Lagoons Even out supply to grid by: n Using different areas around the UK coast n Operating in conjunction with tidal stream turbines

Tidal Lagoons Reduce climate change: … through renewable energy Combat climate change: … through coastal protection

“Do Nothing” is not an option

Strategic Impact Even with a mean output of 110 MW, the North Wales Tidal Lagoon would: n n Save 1 million tonnes CO 2 emissions annually (coal-fired) Contribute 1 TWhr/annum towards Welsh Assembly Government’s target of 4 TWhr/annum from renewables by 2010

Overall Reflections n Think long term n Recognise climate change n Coastal settlements in the front line n Maintain morale of citizens n National policies and local projects depend on each other

Sustainable Development Brundtland Definition: “Development which meets the needs of the present without compromising the ability of future generations to meet their own needs”

Sustainable Development Revised Definition: “Development which meets present needs while striving equally to allow for the needs of future generations” North Wales Coastal Renewability Trust 2005 Conwy County Council 2005

… Please Contact Jim. poole@environment-agency. gov. uk

Web Site http: //www. learningindustries. com/sd
- Slides: 129