
North East London Cancer Inequalities snapshot TCST 8
- Slides: 35
North East London Cancer Inequalities snapshot TCST 8. 10. 19 Supported by and delivering for: London’s NHS organisations include all of London’s CCGs, NHS England Health Education England
01 Picture of the NEL population Transforming London’s health and care together
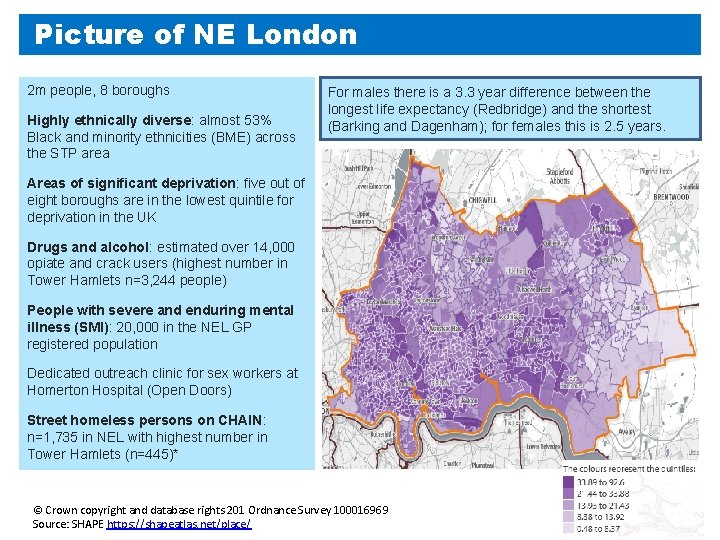
Picture of NE London 2 m people, 8 boroughs Highly ethnically diverse: almost 53% Black and minority ethnicities (BME) across the STP area For males there is a 3. 3 year difference between the longest life expectancy (Redbridge) and the shortest (Barking and Dagenham); for females this is 2. 5 years. Areas of significant deprivation: five out of eight boroughs are in the lowest quintile for deprivation in the UK Drugs and alcohol: estimated over 14, 000 opiate and crack users (highest number in Tower Hamlets n=3, 244 people) People with severe and enduring mental illness (SMI): 20, 000 in the NEL GP registered population Dedicated outreach clinic for sex workers at Homerton Hospital (Open Doors) Street homeless persons on CHAIN: n=1, 735 in NEL with highest number in Tower Hamlets (n=445)* © Crown copyright and database rights 201 Ordnance Survey 100016969 Source: SHAPE https: //shapeatlas. net/place/
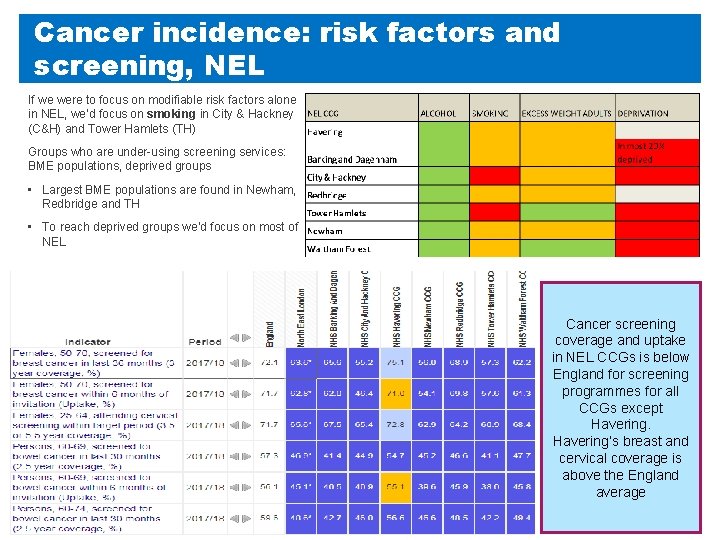
Cancer incidence: risk factors and screening, NEL If we were to focus on modifiable risk factors alone in NEL, we’d focus on smoking in City & Hackney (C&H) and Tower Hamlets (TH) Groups who are under-using screening services: BME populations, deprived groups • Largest BME populations are found in Newham, Redbridge and TH • To reach deprived groups we’d focus on most of NEL Cancer screening coverage and uptake in NEL CCGs is below England for screening programmes for all CCGs except Havering’s breast and cervical coverage is above the England average
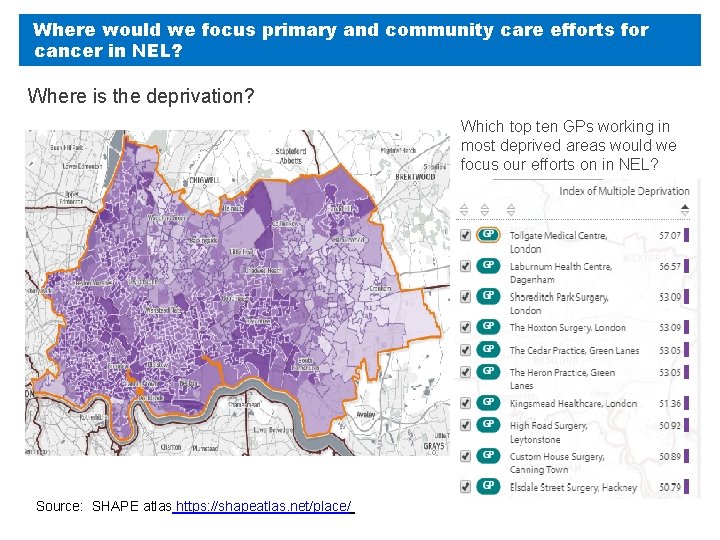
Where would we focus primary and community care efforts for cancer in NEL? Where is the deprivation? Which top ten GPs working in most deprived areas would we focus our efforts on in NEL? Source: SHAPE atlas https: //shapeatlas. net/place/
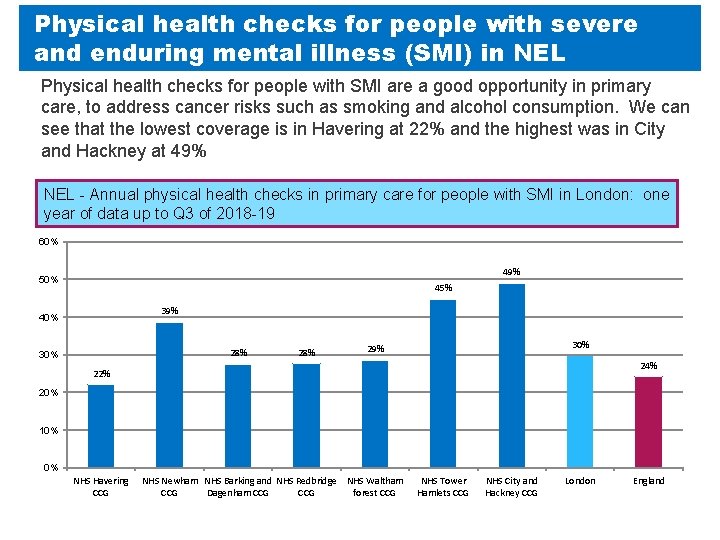
Physical health checks for people with severe and enduring mental illness (SMI) in NEL Physical health checks for people with SMI are a good opportunity in primary care, to address cancer risks such as smoking and alcohol consumption. We can see that the lowest coverage is in Havering at 22% and the highest was in City and Hackney at 49% NEL - Annual physical health checks in primary care for people with SMI in London: one year of data up to Q 3 of 2018 -19 60% 49% 50% 45% 39% 40% 28% 30% 29% 24% 22% 20% 10% 0% NHS Havering CCG NHS Newham NHS Barking and NHS Redbridge NHS Waltham CCG Dagenham CCG forest CCG NHS Tower Hamlets CCG NHS City and Hackney CCG London England
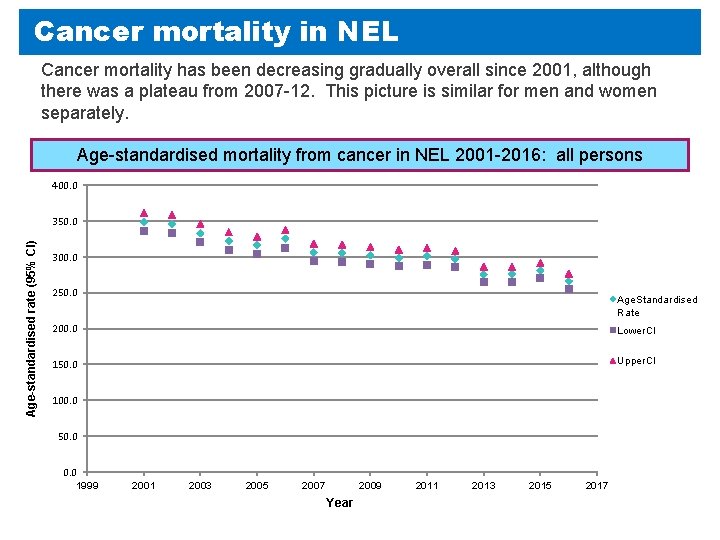
Cancer mortality in NEL Cancer mortality has been decreasing gradually overall since 2001, although there was a plateau from 2007 -12. This picture is similar for men and women separately. Age-standardised mortality from cancer in NEL 2001 -2016: all persons 400. 0 Age-standardised rate (95% CI) 350. 0 300. 0 250. 0 Age. Standardised Rate 200. 0 Lower. CI 150. 0 Upper. CI 100. 0 50. 0 1999 2001 2003 2005 2007 2009 Year 2011 2013 2015 2017
Summary – NEL population and cancer prevention For cancer prevention through modifiable risk factors, we would focus on reducing smoking in Tower Hamlets and City & Hackney With particular BME communities living in Redbridge Newham Tower Hamlets and larger Muslim communities in the latter two boroughs, a focus in these areas may help to reach these communities for cancer screening For key locations to include in STP inequalities plans we could include inpatient mental health beds at NELFT: Foxglove Ward, Mayflower Community Hospital, Ainslie Rehabilitation Unit, Waltham Forest Rehabilitation Services, the Alistair Farquharson Centre, Thurrock Community Hospital and Goodmayes Hospital. Inpatient beds at ELFT are located at Homerton Hospital, Mile End Hospital, Wolfson House Green Lanes. Physical health checks in people with SMI: Havering has the lowest coverage at 22% of people having checks yearly in primary care
02 Early diagnosis of cancer in NEL Transforming London’s health and care together
Early diagnosis content • • Screening and deprivation Stage at diagnosis Emergency presentations for cancer One year survival
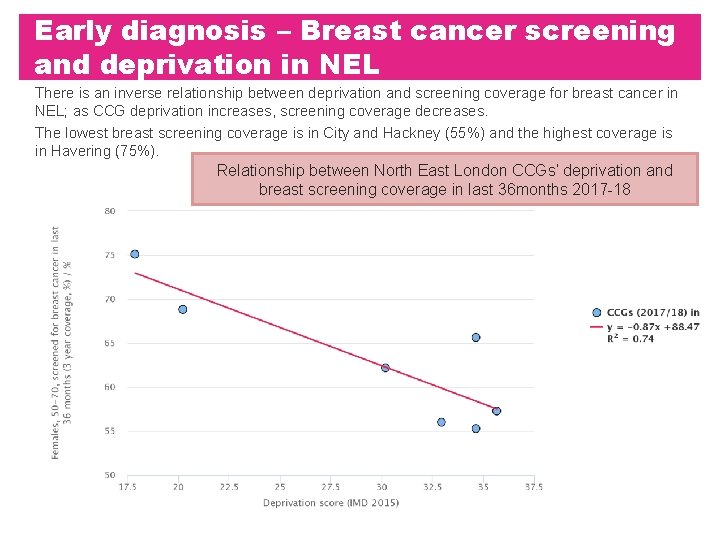
Early diagnosis – Breast cancer screening and deprivation in NEL There is an inverse relationship between deprivation and screening coverage for breast cancer in NEL; as CCG deprivation increases, screening coverage decreases. The lowest breast screening coverage is in City and Hackney (55%) and the highest coverage is in Havering (75%). Relationship between North East London CCGs’ deprivation and breast screening coverage in last 36 months 2017 -18
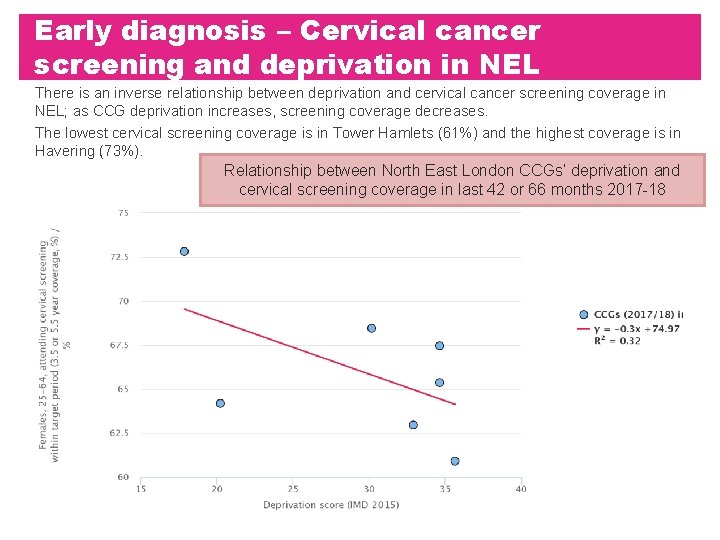
Early diagnosis – Cervical cancer screening and deprivation in NEL There is an inverse relationship between deprivation and cervical cancer screening coverage in NEL; as CCG deprivation increases, screening coverage decreases. The lowest cervical screening coverage is in Tower Hamlets (61%) and the highest coverage is in Havering (73%). Relationship between North East London CCGs’ deprivation and cervical screening coverage in last 42 or 66 months 2017 -18
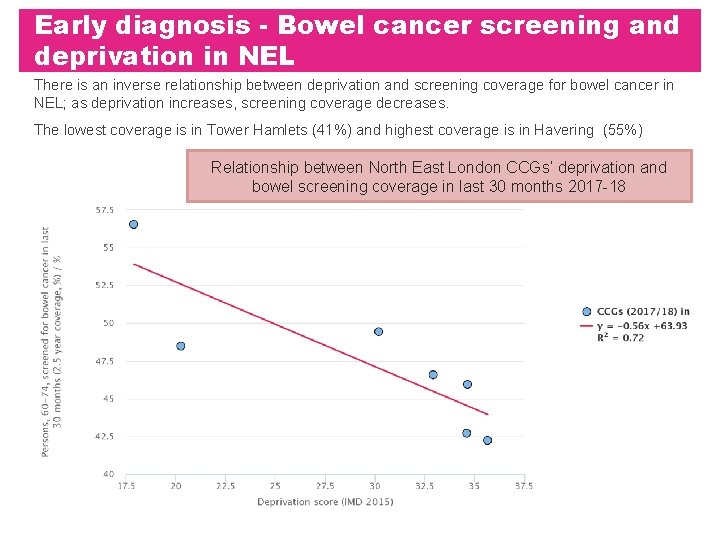
Early diagnosis - Bowel cancer screening and deprivation in NEL There is an inverse relationship between deprivation and screening coverage for bowel cancer in NEL; as deprivation increases, screening coverage decreases. The lowest coverage is in Tower Hamlets (41%) and highest coverage is in Havering (55%) Relationship between North East London CCGs’ deprivation and bowel screening coverage in last 30 months 2017 -18
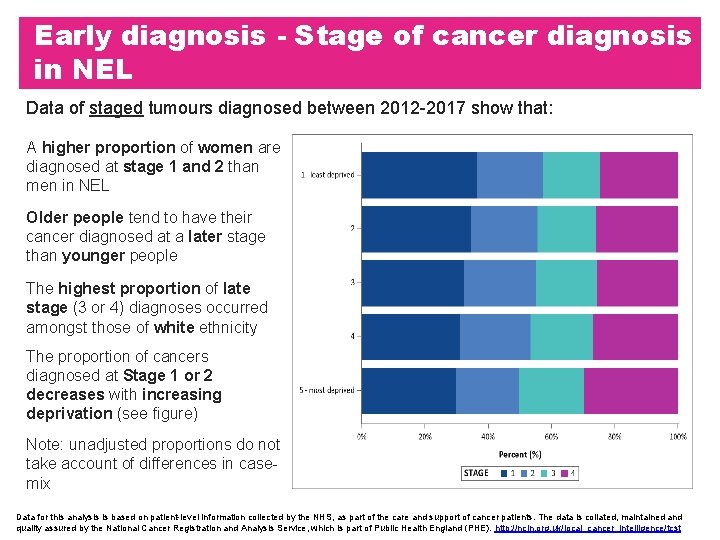
Early diagnosis - Stage of cancer diagnosis in NEL Data of staged tumours diagnosed between 2012 -2017 show that: A higher proportion of women are diagnosed at stage 1 and 2 than men in NEL Older people tend to have their cancer diagnosed at a later stage than younger people The highest proportion of late stage (3 or 4) diagnoses occurred amongst those of white ethnicity The proportion of cancers diagnosed at Stage 1 or 2 decreases with increasing deprivation (see figure) Note: unadjusted proportions do not take account of differences in casemix Data for this analysis is based on patient-level information collected by the NHS, as part of the care and support of cancer patients. The data is collated, maintained and quality assured by the National Cancer Registration and Analysis Service, which is part of Public Health England (PHE). http: //ncin. org. uk/local_cancer_intelligence/tcst
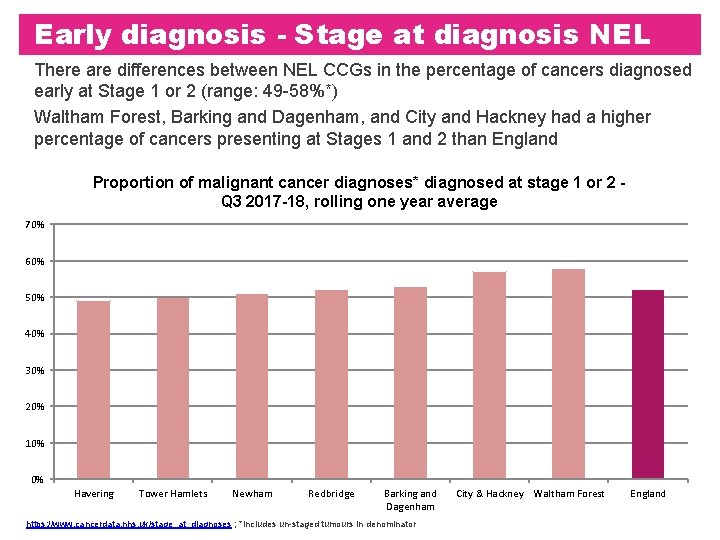
Early diagnosis - Stage at diagnosis NEL There are differences between NEL CCGs in the percentage of cancers diagnosed early at Stage 1 or 2 (range: 49 -58%*) Waltham Forest, Barking and Dagenham, and City and Hackney had a higher percentage of cancers presenting at Stages 1 and 2 than England Proportion of malignant cancer diagnoses* diagnosed at stage 1 or 2 Q 3 2017 -18, rolling one year average 70% 60% 50% 40% 30% 20% 10% 0% Havering Tower Hamlets Newham Redbridge Barking and Dagenham https: //www. cancerdata. nhs. uk/stage_at_diagnoses ; *Includes un-staged tumours in denominator City & Hackney Waltham Forest England
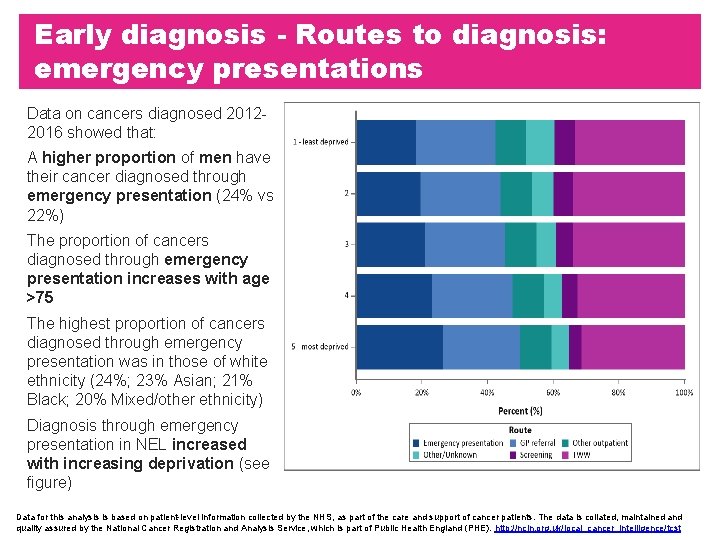
Early diagnosis - Routes to diagnosis: emergency presentations Data on cancers diagnosed 20122016 showed that: A higher proportion of men have their cancer diagnosed through emergency presentation (24% vs 22%) The proportion of cancers diagnosed through emergency presentation increases with age >75 The highest proportion of cancers diagnosed through emergency presentation was in those of white ethnicity (24%; 23% Asian; 21% Black; 20% Mixed/other ethnicity) Diagnosis through emergency presentation in NEL increased with increasing deprivation (see figure) Data for this analysis is based on patient-level information collected by the NHS, as part of the care and support of cancer patients. The data is collated, maintained and quality assured by the National Cancer Registration and Analysis Service, which is part of Public Health England (PHE). http: //ncin. org. uk/local_cancer_intelligence/tcst
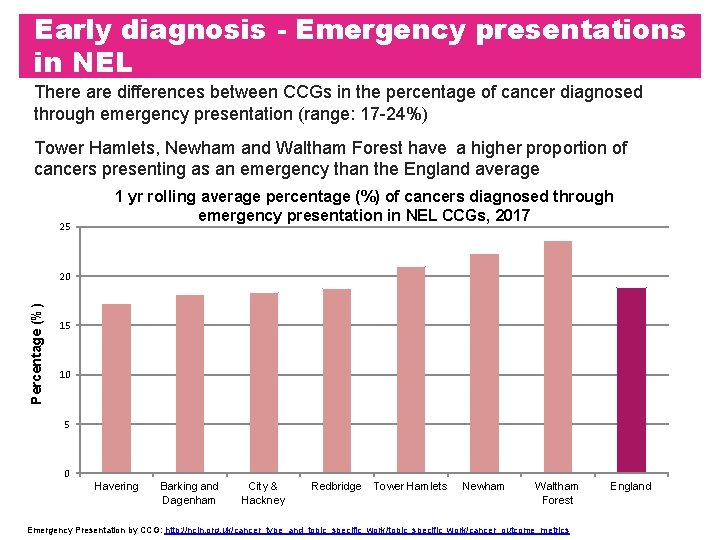
Early diagnosis - Emergency presentations in NEL There are differences between CCGs in the percentage of cancer diagnosed through emergency presentation (range: 17 -24%) Tower Hamlets, Newham and Waltham Forest have a higher proportion of cancers presenting as an emergency than the England average 25 1 yr rolling average percentage (%) of cancers diagnosed through emergency presentation in NEL CCGs, 2017 Percentage (%) 20 15 10 5 0 Havering Barking and Dagenham City & Hackney Redbridge Tower Hamlets Newham Waltham Forest Emergency Presentation by CCG: http: //ncin. org. uk/cancer_type_and_topic_specific_work/cancer_outcome_metrics England
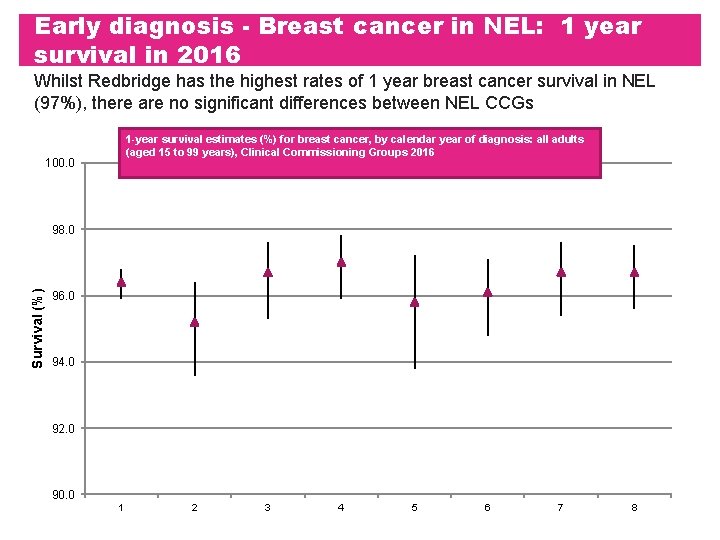
Early diagnosis - Breast cancer in NEL: 1 year survival in 2016 Whilst Redbridge has the highest rates of 1 year breast cancer survival in NEL (97%), there are no significant differences between NEL CCGs 1 -year survival estimates (%) for breast cancer, by calendar year of diagnosis: all adults (aged 15 to 99 years), Clinical Commissioning Groups 2016 100. 0 Survival (%) 98. 0 96. 0 94. 0 92. 0 90. 0 1 2 3 4 5 6 7 8
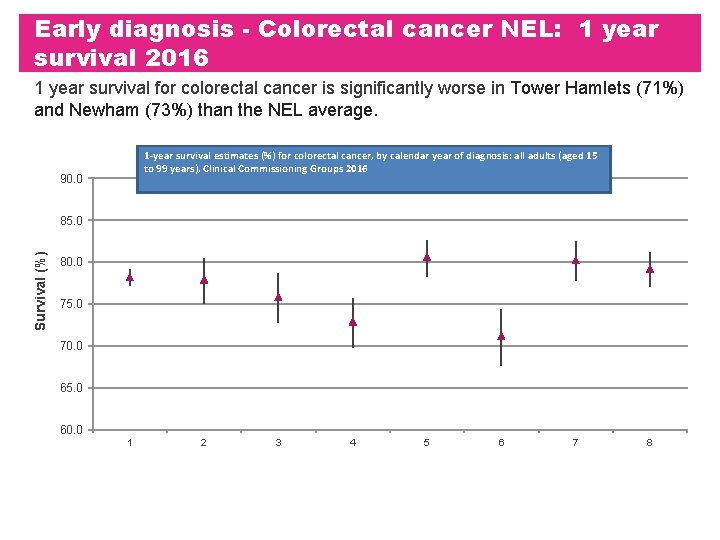
Early diagnosis - Colorectal cancer NEL: 1 year survival 2016 1 year survival for colorectal cancer is significantly worse in Tower Hamlets (71%) and Newham (73%) than the NEL average. 1 -year survival estimates (%) for colorectal cancer, by calendar year of diagnosis: all adults (aged 15 to 99 years), Clinical Commissioning Groups 2016 90. 0 Survival (%) 85. 0 80. 0 75. 0 70. 0 65. 0 60. 0 1 2 3 4 5 6 7 8
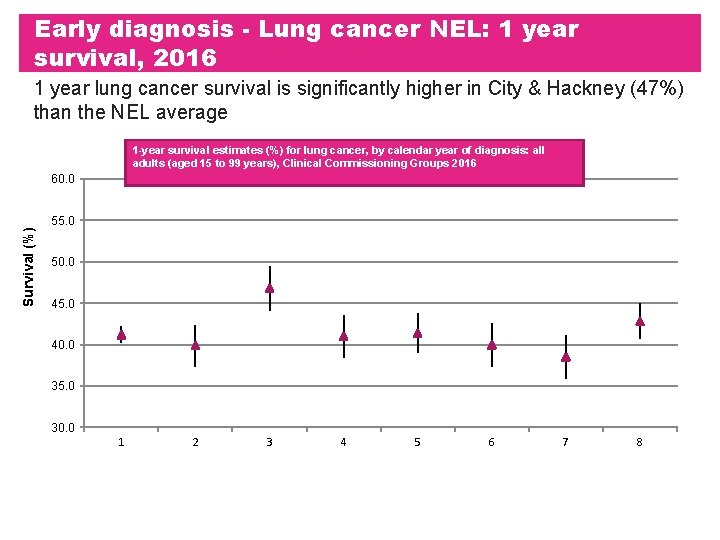
Early diagnosis - Lung cancer NEL: 1 year survival, 2016 1 year lung cancer survival is significantly higher in City & Hackney (47%) than the NEL average 1 -year survival estimates (%) for lung cancer, by calendar year of diagnosis: all adults (aged 15 to 99 years), Clinical Commissioning Groups 2016 Survival (%) 60. 0 55. 0 50. 0 45. 0 40. 0 35. 0 30. 0 1 2 3 4 5 6 7 8
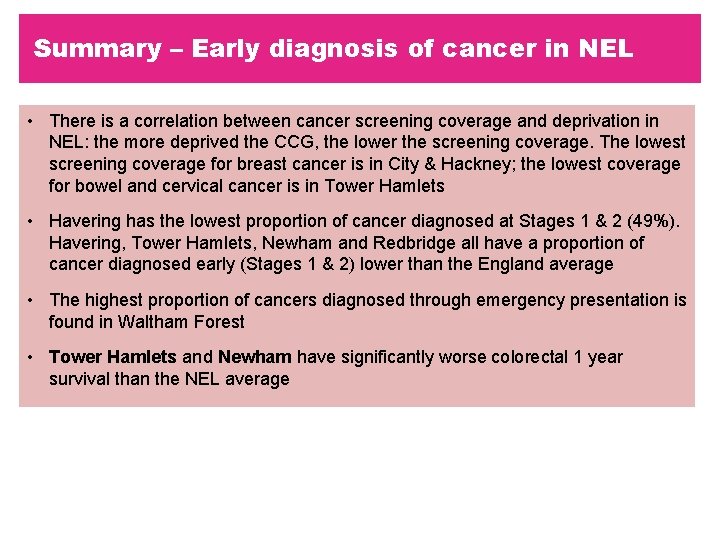
Summary – Early diagnosis of cancer in NEL • There is a correlation between cancer screening coverage and deprivation in NEL: the more deprived the CCG, the lower the screening coverage. The lowest screening coverage for breast cancer is in City & Hackney; the lowest coverage for bowel and cervical cancer is in Tower Hamlets • Havering has the lowest proportion of cancer diagnosed at Stages 1 & 2 (49%). Havering, Tower Hamlets, Newham and Redbridge all have a proportion of cancer diagnosed early (Stages 1 & 2) lower than the England average • The highest proportion of cancers diagnosed through emergency presentation is found in Waltham Forest • Tower Hamlets and Newham have significantly worse colorectal 1 year survival than the NEL average
03 Cancer treatment in NEL Transforming London’s health and care together
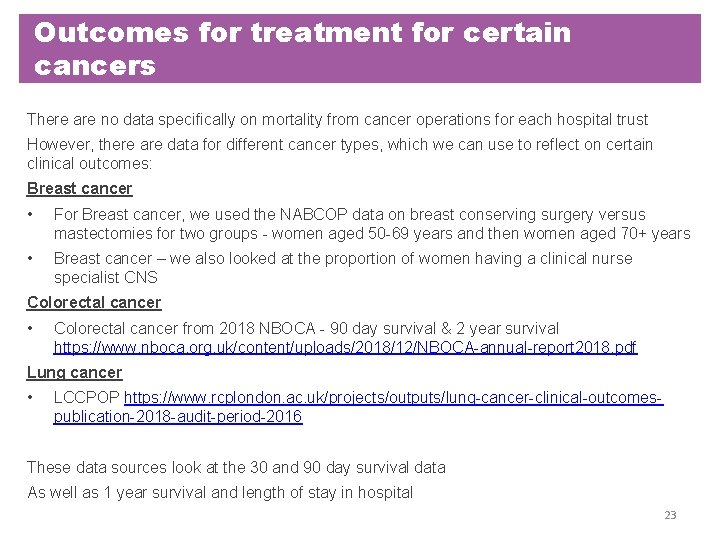
Outcomes for treatment for certain cancers There are no data specifically on mortality from cancer operations for each hospital trust However, there are data for different cancer types, which we can use to reflect on certain clinical outcomes: Breast cancer • For Breast cancer, we used the NABCOP data on breast conserving surgery versus mastectomies for two groups - women aged 50 -69 years and then women aged 70+ years • Breast cancer – we also looked at the proportion of women having a clinical nurse specialist CNS Colorectal cancer • Colorectal cancer from 2018 NBOCA - 90 day survival & 2 year survival https: //www. nboca. org. uk/content/uploads/2018/12/NBOCA-annual-report 2018. pdf Lung cancer • LCCPOP https: //www. rcplondon. ac. uk/projects/outputs/lung-cancer-clinical-outcomespublication-2018 -audit-period-2016 These data sources look at the 30 and 90 day survival data As well as 1 year survival and length of stay in hospital 23
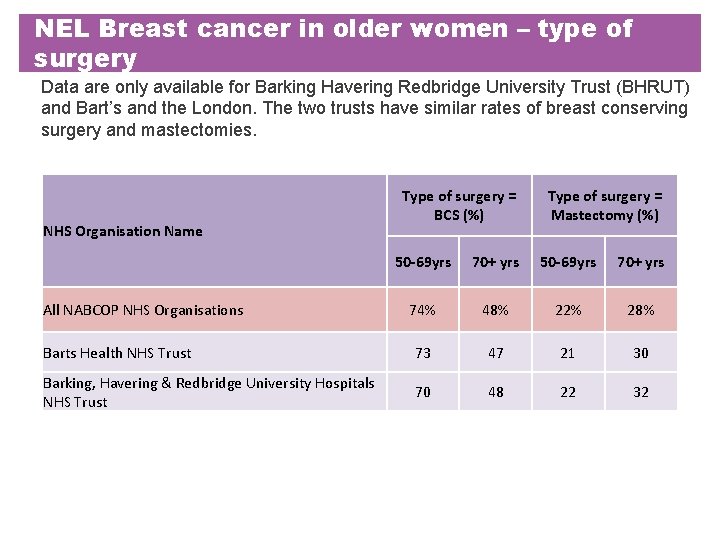
NEL Breast cancer in older women – type of surgery Data are only available for Barking Havering Redbridge University Trust (BHRUT) and Bart’s and the London. The two trusts have similar rates of breast conserving surgery and mastectomies. NHS Organisation Name Type of surgery = BCS (%) Type of surgery = Mastectomy (%) 50 -69 yrs 70+ yrs 74% 48% 22% 28% Barts Health NHS Trust 73 47 21 30 Barking, Havering & Redbridge University Hospitals NHS Trust 70 48 22 32 All NABCOP NHS Organisations
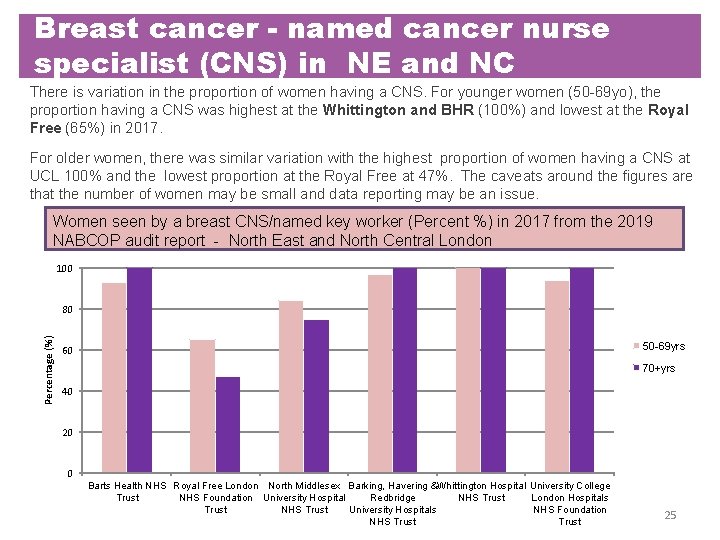
Breast cancer - named cancer nurse specialist (CNS) in NE and NC There is variation in the proportion of women having a CNS. For younger women (50 -69 yo), the proportion having a CNS was highest at the Whittington and BHR (100%) and lowest at the Royal Free (65%) in 2017. For older women, there was similar variation with the highest proportion of women having a CNS at UCL 100% and the lowest proportion at the Royal Free at 47%. The caveats around the figures are that the number of women may be small and data reporting may be an issue. Women seen by a breast CNS/named key worker (Percent %) in 2017 from the 2019 NABCOP audit report - North East and North Central London 100 Percentage (%) 80 50 -69 yrs 60 70+yrs 40 20 0 Barts Health NHS Royal Free London North Middlesex Barking, Havering &Whittington Hospital University College Trust NHS Foundation University Hospital Redbridge NHS Trust London Hospitals Trust NHS Trust University Hospitals NHS Foundation NHS Trust 25
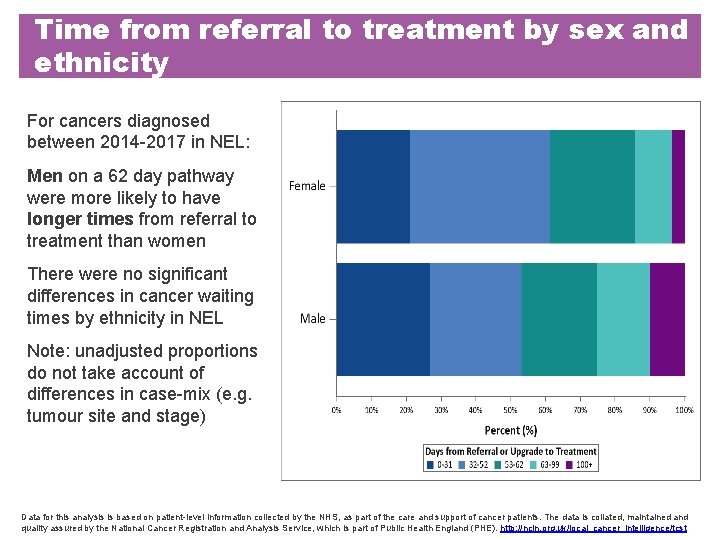
Time from referral to treatment by sex and ethnicity For cancers diagnosed between 2014 -2017 in NEL: Men on a 62 day pathway were more likely to have longer times from referral to treatment than women There were no significant differences in cancer waiting times by ethnicity in NEL Note: unadjusted proportions do not take account of differences in case-mix (e. g. tumour site and stage) Data for this analysis is based on patient-level information collected by the NHS, as part of the care and support of cancer patients. The data is collated, maintained and quality assured by the National Cancer Registration and Analysis Service, which is part of Public Health England (PHE). http: //ncin. org. uk/local_cancer_intelligence/tcst
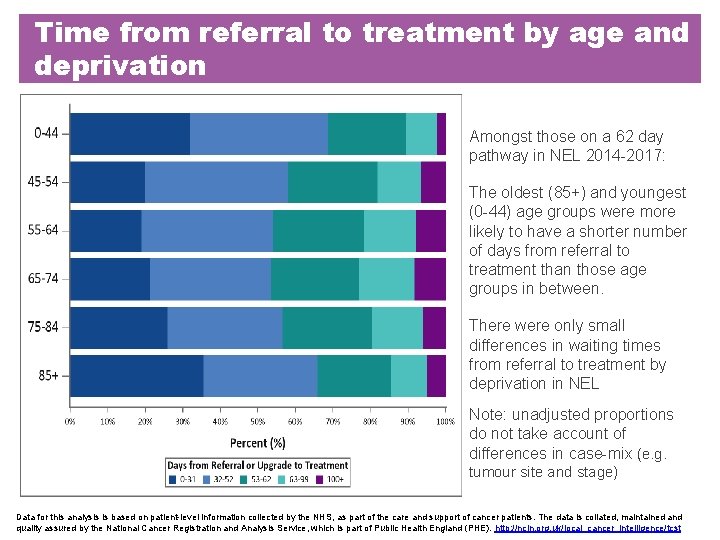
Time from referral to treatment by age and deprivation Amongst those on a 62 day pathway in NEL 2014 -2017: The oldest (85+) and youngest (0 -44) age groups were more likely to have a shorter number of days from referral to treatment than those age groups in between. There were only small differences in waiting times from referral to treatment by deprivation in NEL Note: unadjusted proportions do not take account of differences in case-mix (e. g. tumour site and stage) Data for this analysis is based on patient-level information collected by the NHS, as part of the care and support of cancer patients. The data is collated, maintained and quality assured by the National Cancer Registration and Analysis Service, which is part of Public Health England (PHE). http: //ncin. org. uk/local_cancer_intelligence/tcst
Summary – cancer treatment NEL • NABCOP breast audit data show that use of breast conserving surgery in older women at BHRUT and Bart’s is similar to the national picture • There is good access to breast clinical nurse specialists (CNS) at Bart’s and BHRUT • Women on a 62 day Cancer Waiting Times pathway had a shorter time to treatment than men
04 Personalised care for cancer NEL Transforming London’s health and care together
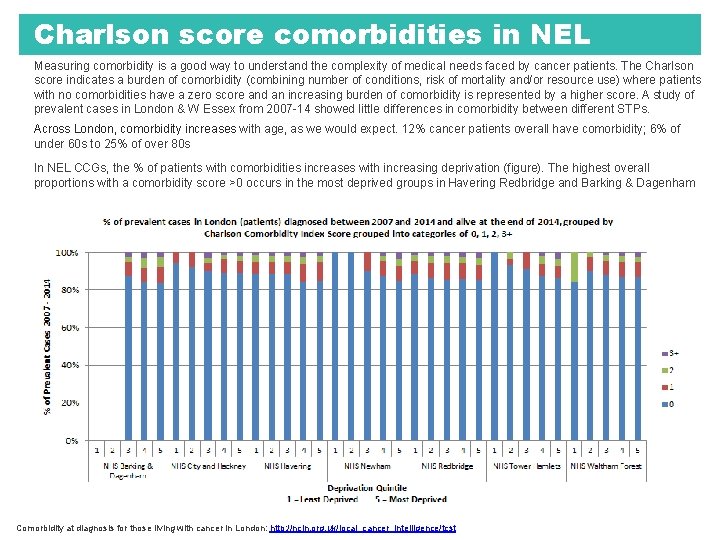
Charlson score comorbidities in NEL Measuring comorbidity is a good way to understand the complexity of medical needs faced by cancer patients. The Charlson score indicates a burden of comorbidity (combining number of conditions, risk of mortality and/or resource use) where patients with no comorbidities have a zero score and an increasing burden of comorbidity is represented by a higher score. A study of prevalent cases in London & W Essex from 2007 -14 showed little differences in comorbidity between different STPs. Across London, comorbidity increases with age, as we would expect. 12% cancer patients overall have comorbidity; 6% of under 60 s to 25% of over 80 s In NEL CCGs, the % of patients with comorbidities increases with increasing deprivation (figure). The highest overall proportions with a comorbidity score >0 occurs in the most deprived groups in Havering Redbridge and Barking & Dagenham Comorbidity at diagnosis for those living with cancer in London: http: //ncin. org. uk/local_cancer_intelligence/tcst
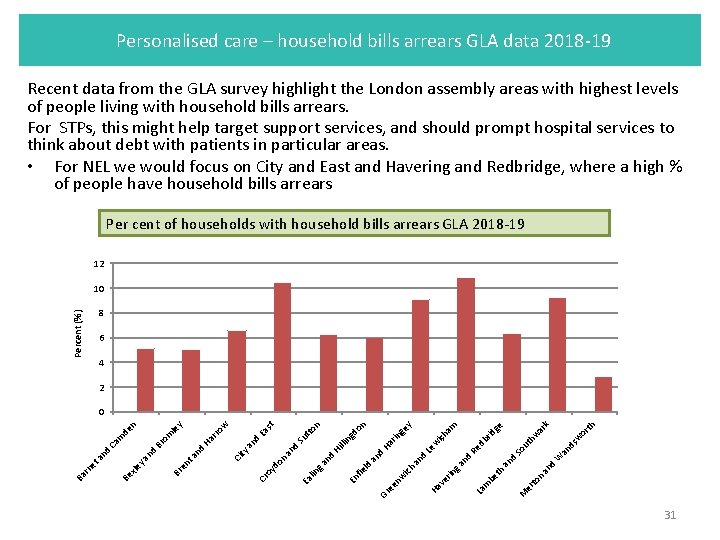
Personalised care – household bills arrears GLA data 2018 -19 Recent data from the GLA survey highlight the London assembly areas with highest levels of people living with household bills arrears. For STPs, this might help target support services, and should prompt hospital services to think about debt with patients in particular areas. • For NEL we would focus on City and East and Havering and Redbridge, where a high % of people have household bills arrears Per cent of households with household bills arrears GLA 2018 -19 12 10 Percent (%) 8 6 4 2 or w ds an n to er M m be th an d W So Re nd La th k db ut h w rid ar ge am rin ve Ha nw ee Gr ga an ich ld ie En f ish w Le d d an nd ga in Ea l ge y Ha llin Hi d an n do oy Cr rin gd tto Su d an ty Ci on n t Ea s w rro Ha nd ta en Br nd ya xle Be Ba rn et an d Br Ca m om de le y n 0 31
Psycho-oncology in NEL Psycho-oncology is a ‘multi-disciplinary speciality focusing on the psychological and mental health care of people affected by cancer, carers and families, contributing through direct and indirect care to improving clinical outcomes, patient experience and quality of life’ (The Psychological impact of cancer: commissioning recommendations, pathway and service specifications on psychosocial support for adults affected by cancer. TCST May 2018) There is access to Psychological support for cancer patients at each of the acute trusts in NEL
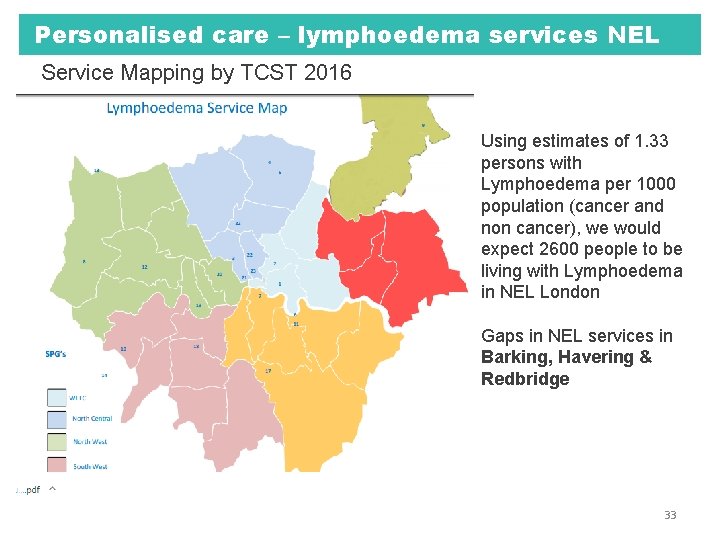
Personalised care – lymphoedema services NEL Service Mapping by TCST 2016 Using estimates of 1. 33 persons with Lymphoedema per 1000 population (cancer and non cancer), we would expect 2600 people to be living with Lymphoedema in NEL London Gaps in NEL services in Barking, Havering & Redbridge 33
Summary personalised care in NEL • Comorbidity in cancer patients in NEL is highest in deprived groups in Barking & Dagenham and Havering • Household bills arrears are high in NEL, especially in City and East and Havering and Redbridge assembly areas • There are gaps in lymphoedema services Barking, Havering and Redbridge
All the work we do with our partners moves us closer towards our goal to make London the healthiest global city. • www. healthylondon. org • england. healthylondon@nhs. net • @healthy. LDN 35