North Alaska Peninsula Photo by Philip Tschersich Title

North Alaska Peninsula Photo by Philip Tschersich Title By slide Port& Moller photo Bob w/ Murphy Elisa Russ North Aleutian Basin Energy-Fisheries March 18 -19, 2008 Port Moller

Port Heiden Pop. 100 Nelson Lagoon Pop. 83 Cold Bay Pop. 78 Image: NASA False Pass Pop. 57 Port Moller Seasonal Pop. 150 Sand Point Pop. 918 King Cove Pop. 790 3

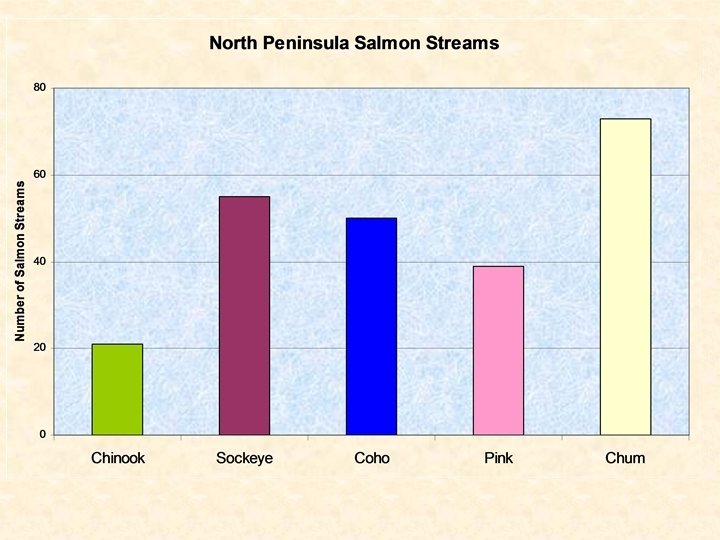
Salmon harvest: 1988 -2007 avg = 2. 6 million

1988 -2007 Average Escapement: Approx. 1. 8 million salmon

Permits fished averaged 241 and ranged from 365 to 138 Total salmon fishery value: 20 -year average ~ $13. 26 million

North Alaska Peninsula Herring Fishing Areas Alaska CCaa HH er e ppee enre SSee dned nni ia enee avvi anna inn dnd MM ol o lell r e. Br a. Bya s ys Po Prot rt. H Heid eie dne n 1
 North Alaska Peninsula Sac Roe Herring Harvest and Biomass Estimates,")
Biomass and Harvest (t) North Alaska Peninsula Sac Roe Herring Harvest and Biomass Estimates, 1984 -2007 In 1992, a total of 28, 812 tons of herring were observed 20 Year average of 3, 534 tons of herring 3

Shellfish Fisheries of the Eastern Bering Sea and Bristol Bay

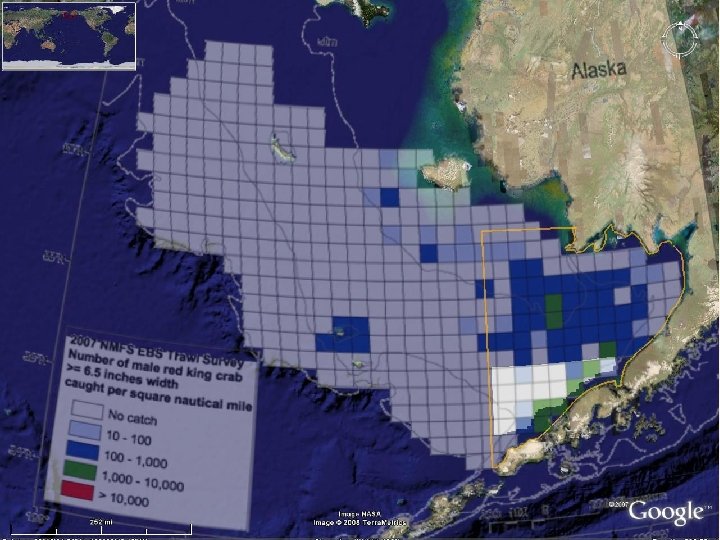
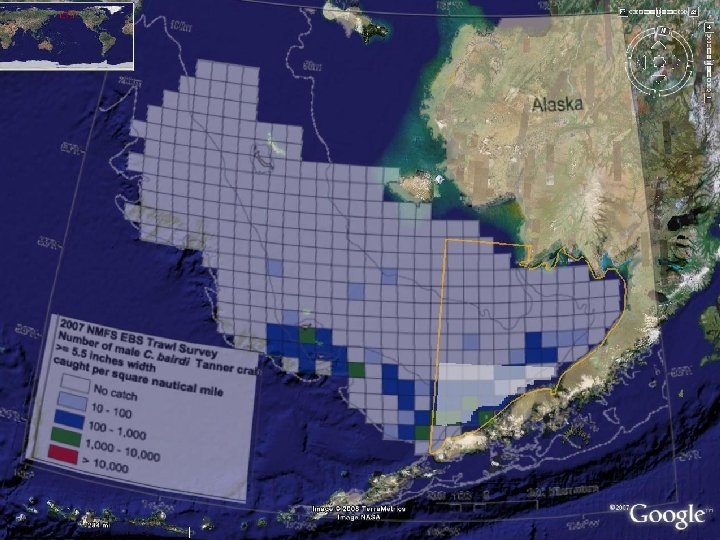
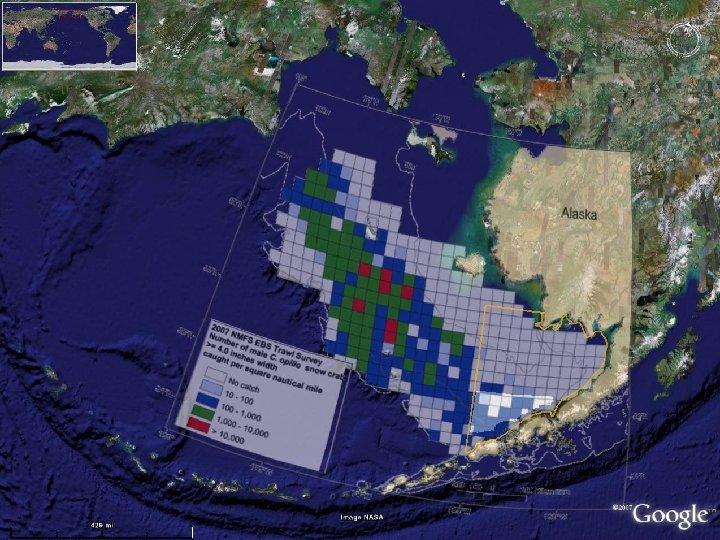
Three major fisheries Bristol Bay red king crab 1998 -2007 average harvest: 13. 8 million pounds 1998 -2007 average fishery value: $62 million Bering Sea Tanner crab 2005 -2007 average harvest: 0. 8 million pounds 2005 -2007 average fishery value: $1. 9 million note: fishery closed 1997 -2004. Bering Sea snow crab 1998 -2007 average harvest: 68. 8 million pounds 1998 -2007 average harvest: $66. 5 million

2007 Red King Crab Survey Catch Density

2007 Tanner Crab Survey Catch Density

2007 Snow Crab Survey Catch Density

North Aleutian Basin Planning Area Cinder River SCHA Port Heiden SCHA Cape Seniavin Proposed Final Program Area Port Moller SCHA Izembek SGR

Photo by Philip Tschersich The End. Sockeyesalmon behindthe the. Bear Riverweir
- Slides: 18