North Africa and Southwest Asia Economic Geography Natural


")


- Slides: 31
North Africa and Southwest Asia Economic Geography
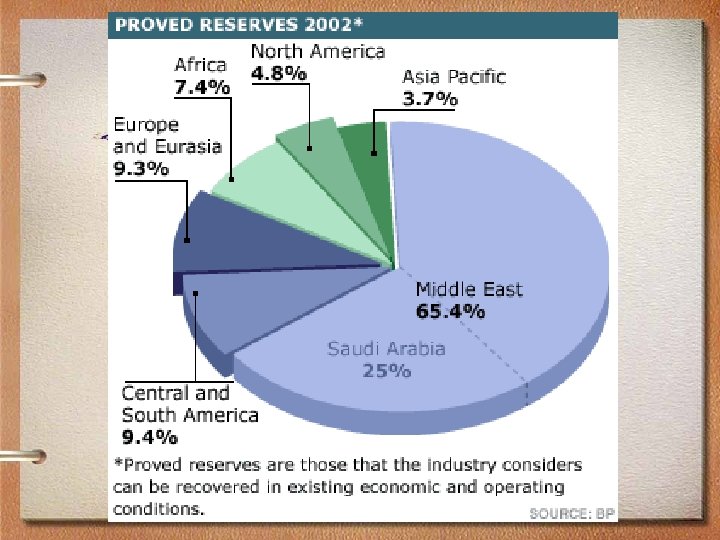
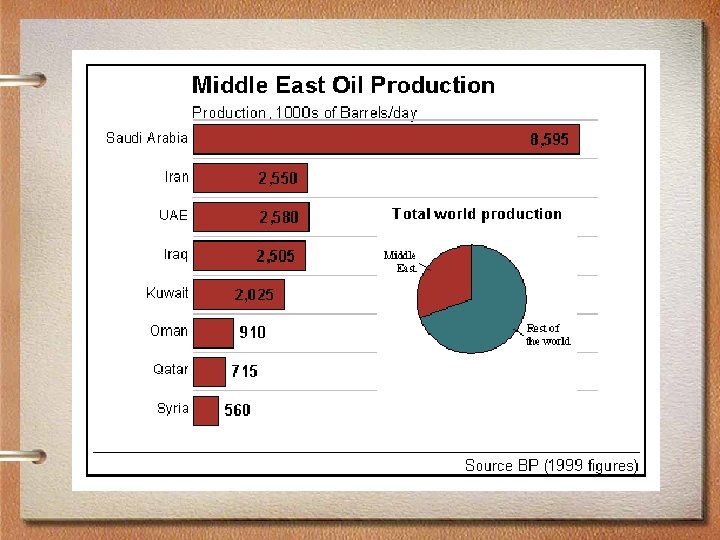
Natural Resources • Oil is the major resource in this region. • Many countries in this region are members of OPEC (Organization of Petroleum Exporting Countries). • OPEC sets the price and production of oil and has members all over the world.
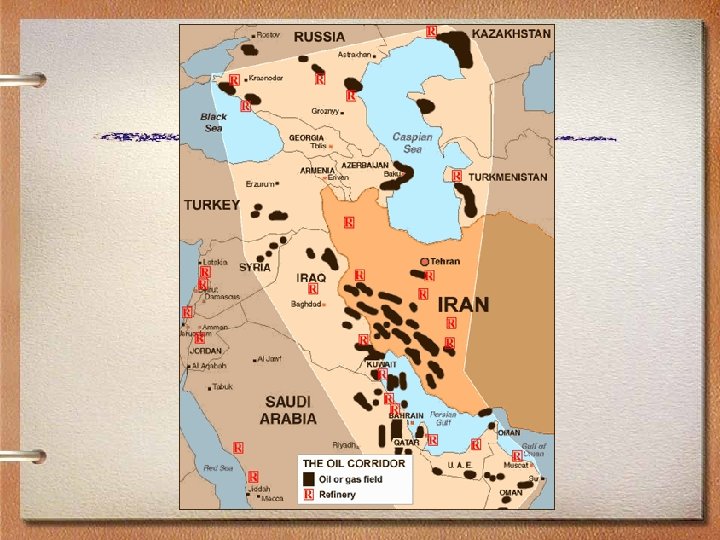
Countries With Oil Countries with oil Saudi Arabia Iraq Iran UAE Kuwait Qatar Libya Countries that have very little oil Israel Turkey Jordan Lebanon Syria Morocco Afghanistan
Natural Resources • There are positive and negative effects from oil revenues. Some countries have used oil money to build infrastructure such as schools, telecommunication systems, and hotels to attract tourists. However, oil fluctuates on the world market so it makes it difficult to plan for the future.
Positive and Negative Positive/Oil Negative/Oil 1. Oil is valuable 2. Oil money is used to build infrastructure 3. People have a high GDP per capita 1. Oil fluctuates on the world market 2. Oil will run out eventually
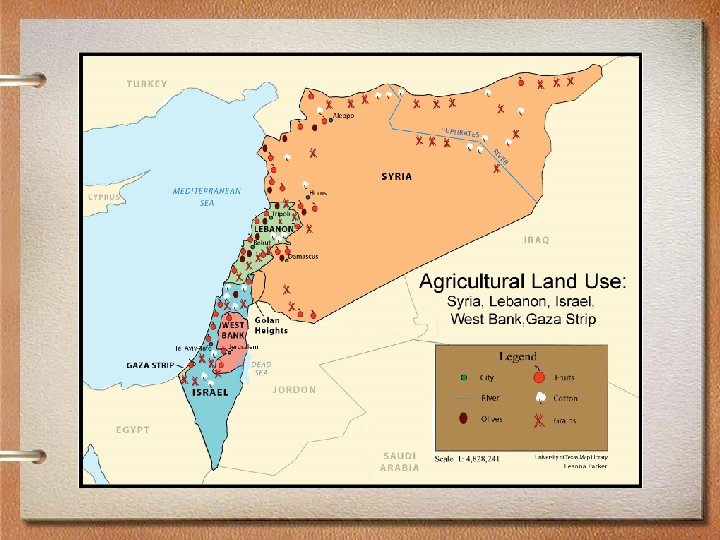
Natural Resources • The most important resource in this region is fresh water. These countries need water to irrigate crops. Some countries have major rivers such as Turkey, Iraq, Israel, Syria, and Egypt. • Other countries get fresh water by converting salt water from the ocean into fresh water in a process called desalinization. This process is expensive and requires capital investment.
Natural Resources • Other resources that are found in this area are: phosphates, copper, coal, citrus products, and cotton.
Economic Activity • Primary - Resources are gathered (farming, hunting, fishing, timber falling, mining) • Secondary - Resources are processed or manufactured into goods. • Tertiary - The service industry (distributing, advertising, transportation, government employees, banking, retail sales)
Economic Activity • This region is highly dependant on primary economic activity. A. Oil drilling B. Agriculture (People grow foods in irrigated areas along rivers and on the Mediterranean Coast) C. Pastoralism (Nomadic Herding - People raise herds of goats, sheep, and cattle)
Guest Workers • Countries with oil have small populations. The labor shortage is filled by guest workers from south and east Asian countries such as India, Philippines, Pakistan, and Indonesia.
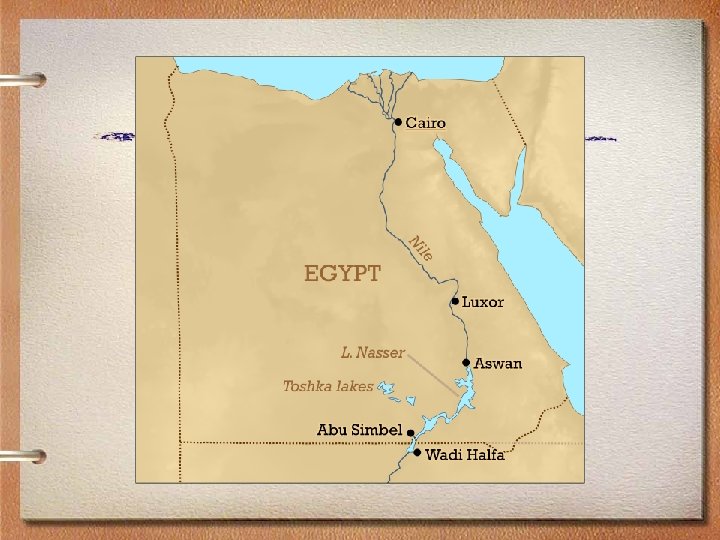
Agriculture • Agriculture in this region is limited to areas near rivers or areas that can be irrigated. Areas with significant agriculture are: A. Near the Nile River in Egypt B. Near the Tigris and Euphrates Rivers in Turkey and Iraq C. Heavily irrigated areas in Israel near the Jordan River
Kibbutz in Israel
Aswan High Dam • The Aswan High Dam on the Nile River was completed in 1970. The dam was built to: A. Stop seasonal flooding on the Nile River. B. Provide hydroelectric power for Egypt. C. Provide a steady source of water for irrigation.
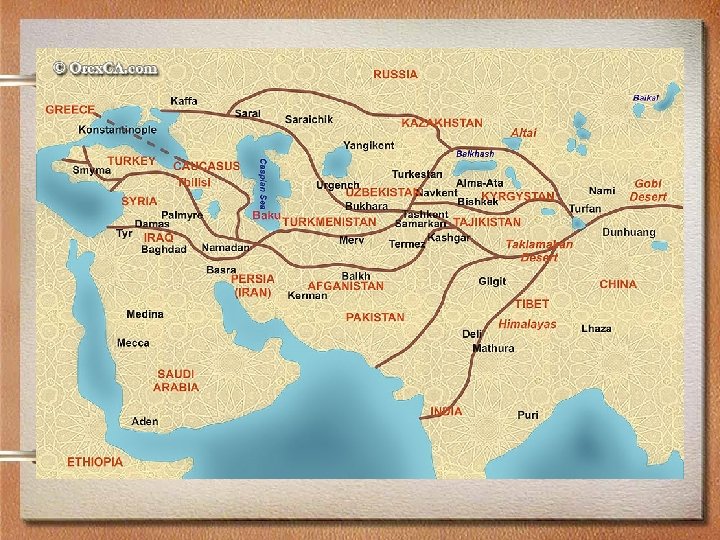
Trade Important to Region • Trade has always been important to this region because it is halfway between Europe and Asia. A. The Silk Road linked China to Europe B. Trade routes crossed the Sahara Desert and linked Sub-Saharan Africa to Europe
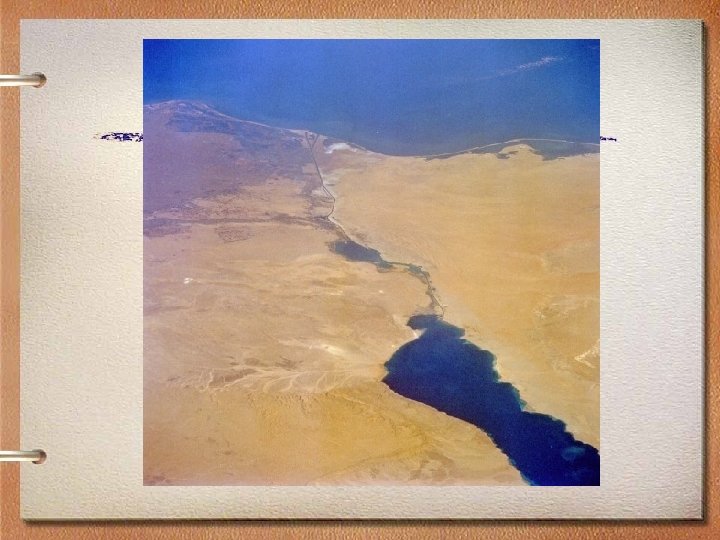
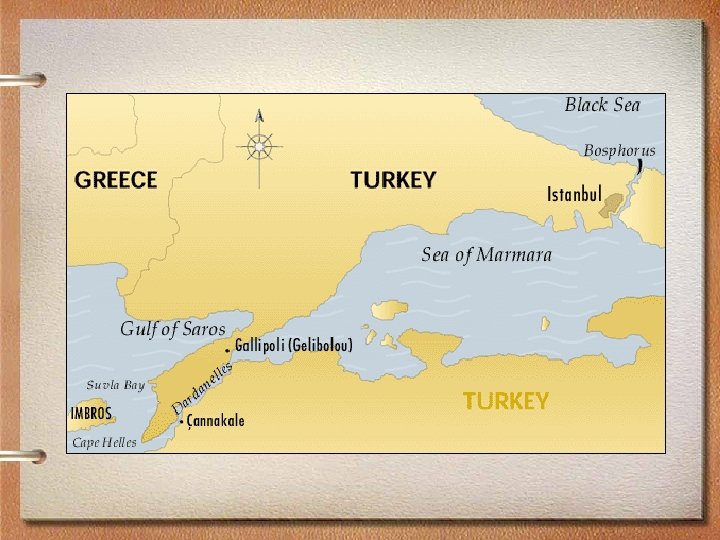
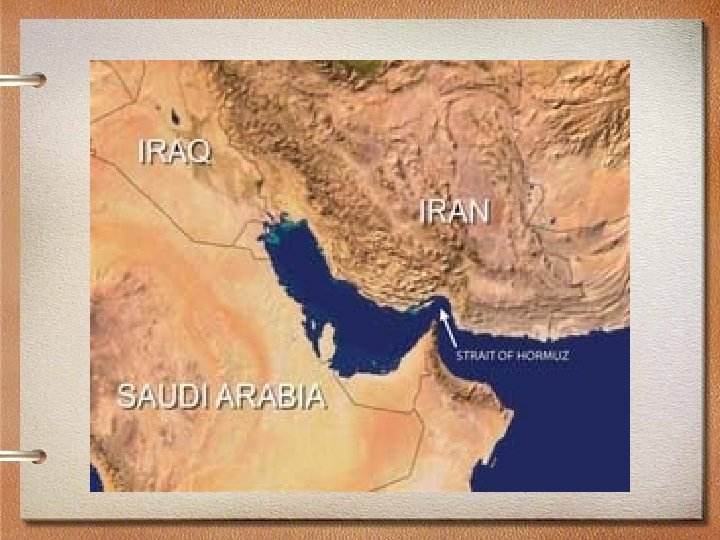
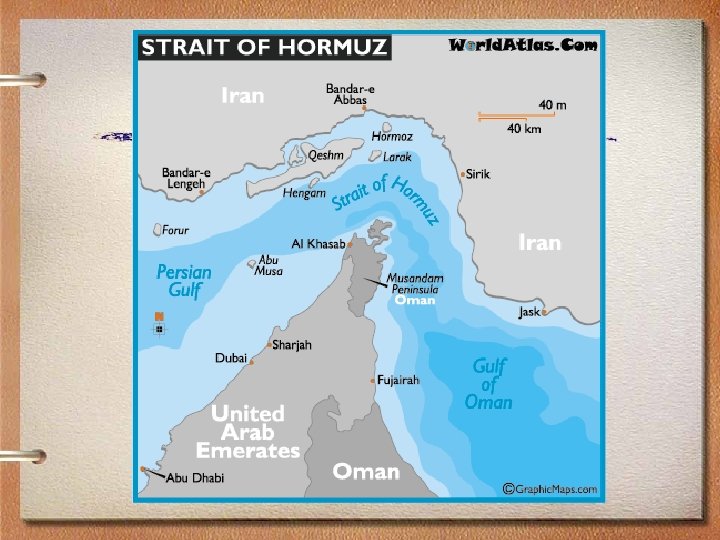
Contemporary Trade Routes • This area has many important trade routes or sealanes such as: A. The Bosporus and Dardanelles connect the Black Sea and the Mediterranean Sea B. The Suez Canal connects the Mediterranean Sea to the Red Sea C. The Strait of Hormuz connects the Persian Gulf to the Arabian Sea and Indian Ocean
Suez Canal • The Suez Canal connects the Mediterranean Sea to the Red Sea. • The Suez Canal is owned by the Suez Canal Authority, a state owned company. • The average toll for a ship passing through the canal is 150, 000 dollars.
Tourism • Some countries in this region make money from tourism. A. People visit Egypt to see the pyramids B. People visit Jerusalem to see holy sites (Dome of the Rock, Western Wall, Church of the Holy Sepulchre) C. People visit Mecca (The Hajj)
Developed or Developing? • This region has a wide range of per capita income and levels of development. High GDP Per Capita Israel - 26, 600 Saudi Arabia - 19, 800 UAE - 37, 000 Qatar - 87, 000 Kuwait - 55, 900 Low GDP Per Capita Iraq - 3, 700 Iran - 11, 700 Lebanon - 10, 300 Syria - 4, 700
Developed or Developing? • Countries are rated by economic indicators and standards of living. This area has some countries with relatively high standards of living and other countries that are very poor. Analyze the countries on the next slide based on standards of living.
Standards of Living Country A Country B Pop. Growth Rate 3. 83% 2. 18% GDP per capita 37, 000 77. 9% 75. 89 13. 11 4, 700 79. 6% 70. 9 26. 78 Literacy Rate Life Expectancy Infant Mortality