Normal Distributions Upon the completion of this lesson

Normal Distributions Upon the completion of this lesson, you will be able to: * Explain the characteristics of a normal probability distribution. ** Solve problems using tables of the normal distribution

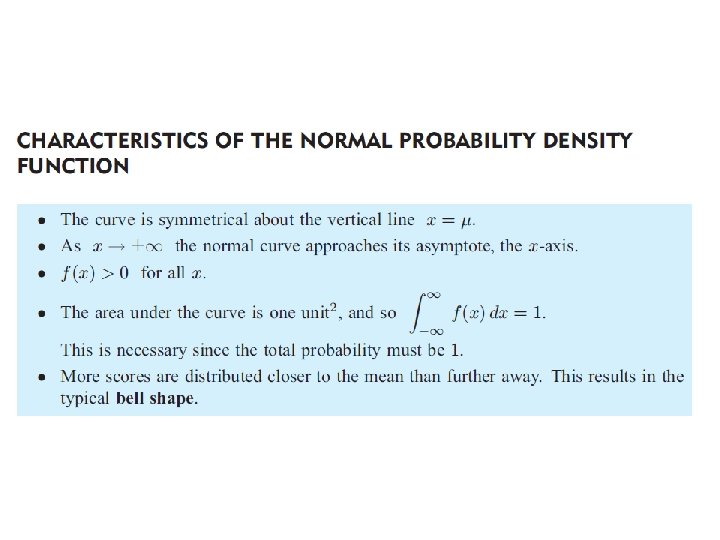
Normal Distributions 1. is used for Continuous probability distribution. 2. is bell-shaped. The normal curve is bell-shaped

Camel or mountain shaped

3. Area under the curve equals 1.

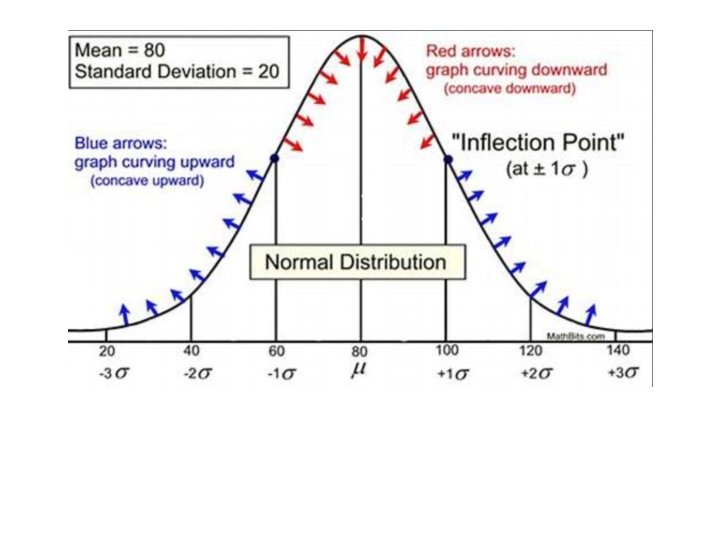
4. is unimodal. Normal curve has a single peak at the exact centre of the distribution. The arithmetic mean, median, and mode of the distribution are equal and located at the peak.

5. The curve is symmetrical about the line x = mean …thus half the area under the curve is above the mean and half is below it.

6. The normal probability distribution is asymptotic. i. e. the curve gets closer and closer to the x-axis but never actually touches it.

7. Normal curve has inflection point. Notice that the normal curve is curving downwards from the center (mean) to points that are one standard deviation on either side of the mean. At those points, the normal curve begins to turn upward.
 completely determine a normal distribution Mean - µ and")
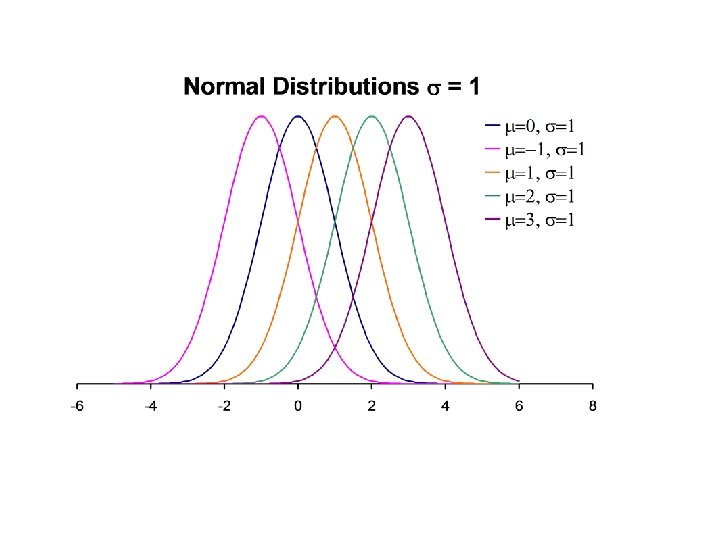
8. Two characteristic values (numbers) completely determine a normal distribution Mean - µ and Standard deviation Larger mean

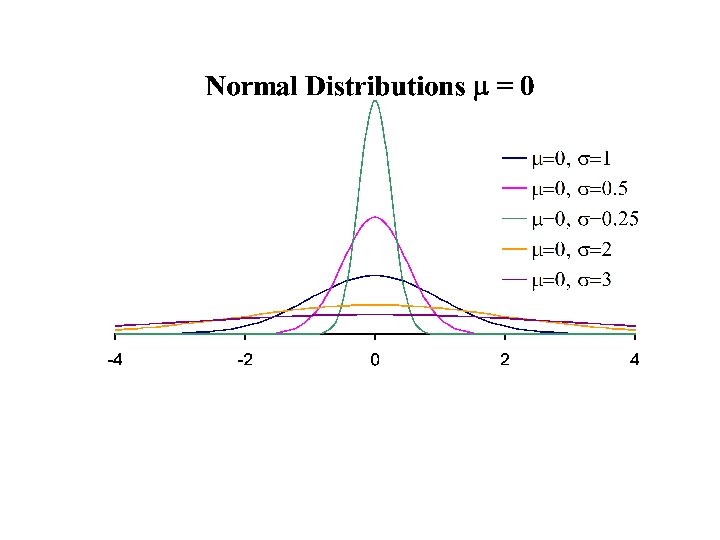
Smaller standard deviation • As s increases, the curve flattens & spreads out • As s decreases, the curve gets taller and thinner

9. Probability = Area • How is this done mathematically? To overcome the need for calculus, we rely on technology (GDC) or on a table of areas for the standard normal distribution
 • Is a normal distribution with = 0 and")
Standard Normal Probability Distribution (SNPD) • Is a normal distribution with = 0 and = 1 • It is customary to use the letter z to represent a variable whose distribution is described by the standard normal curve (or z curve).
 Curve Areas • For any number z*,")
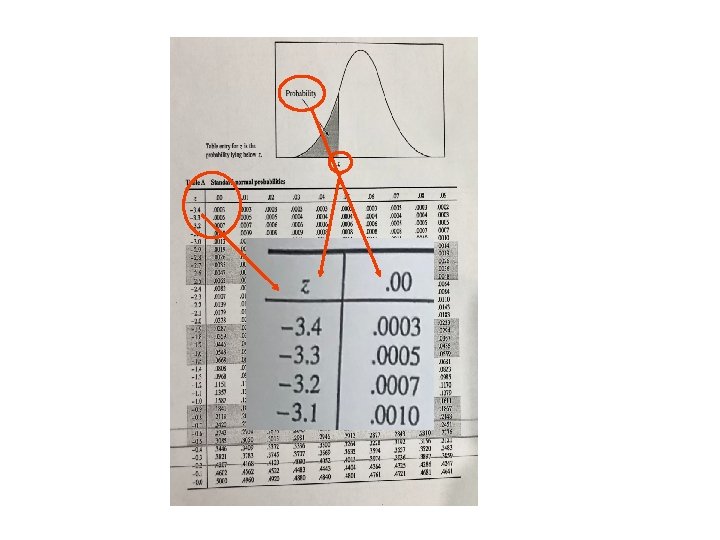
Using the Table of Standard Normal (z) Curve Areas • For any number z*, from -3. 89 to 3. 89 and rounded to two decimal places, the Table I provided gives the area under the z curve and to the left of z*. P(z <Toz*) = P(z < z*) use the table: Where • Find the correct row and column (see the following example) the letter z is used to represent a random variable • The number at the intersection of that row and column is the whose distribution is the standard normal distribution. probability

Do you remember the empirical rule?
 Answer: 0. 8643")
Example: Find p(Z < 1. 10) Answer: 0. 8643

Suppose we are interested in the probability that z* is less than -1. 62. In the table of areas: . 0526 P(z < -1. 62) = • Find the row labeled -1. 6 • Find the column labeled 0. 02 • Find the intersection of the row and column -1. 7 -1. 6 -1. 5 . 0446. 0548. 0668 . 0436. 0537. 0655 . 0427. 0526. 0643 … … . 02 … . 01 … . 00 … … z* . 0418. 0516. 0618

Suppose we are interested in the probability that z* is less than 2. 31. P(z < 2. 31) =. 9896 2. 2 2. 3 2. 4 . 9861. 9893. 9918 . 9864. 9896. 9920 . 9868. 9898. 9922 … … . 02 … . 01 … . 00 … … z* . 9871. 9901. 9925

Suppose we are interested in the probability that z* is greater than 2. 31. The Table of Areas gives the area to the P(z > 2. 31) = LEFT of the z*. 1 -. 9896 =. 0104 To find the area to the right, subtract 2. 2 2. 3 2. 4 . 9861. 9893. 9918 . 9864. 9896. 9920 . 02 … . 01 … . 00 … … z* . 9868. 9898. 9922 … … the value in the table from 1 . 9871. 9901. 9925

Try Me: Using the standard normal tables, find P(0. 54 < z < 1. 61). P(Z<1. 61)=0. 9463 P(Z<. 54)=0. 7054 P(0. 54 < z < 1. 61)= 0. 9463 - 0. 7054 = 0. 2409

Question of the day! Why the table gives only for the possible values of z between -3. 49 and 3. 49? How about outside of this range?


Class work
")
Class work: Using the standard normal tables, find the proportion of observations (z values) from a standard normal distribution that satisfies -1. 37 < z < 2. 34, that is find P(-1. 37 < z < 2. 34). P(Z<2. 34)=0. 9904
=0. 9904 P(-1. 37 < z < 2. 34) P(Z<-1. 37)=0. 0853 =")
P(Z<2. 34)=0. 9904 P(-1. 37 < z < 2. 34) P(Z<-1. 37)=0. 0853 = 0. 9051 = 0. 9904 0. 0853

Areas under the Normal Curve Between: 68. 26% 95. 44% 99. 74% -1 -2 -3
- Slides: 30