Normal Distributions Empirical Rule and Standard Normal Distribution

Normal Distributions, Empirical Rule and Standard Normal Distribution

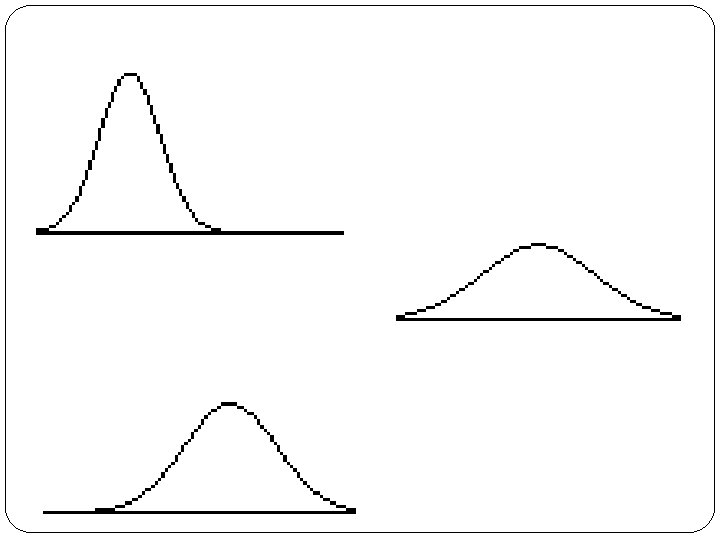
Normal Curves to describe normal distributions �Symmetric �Single peaked �Bell shaped

Points of Inflection and Standard Deviation in a Normal Curve Point of Inflection

The distribution of heart disease death rates, per 100, 000 people, in 19 developed Western countries is close to this normal distribution. What is the mean and median heart disease death rate per 100, 000 people? 2. The standard deviation is approximately what value? a) 10 b)25 c) 60 d)100 1.

Notation Because the density curve is an idealized description of data, we need to distinguish between the mean and standard deviation of the density curve and the mean and standard deviation, s, computed from the actual observations. The mean of an idealized distribution is µ and the standard deviation σ.
 shorthand for a normal distribution with mean µ and standard")
Shorthand Notation �N(µ, σ) shorthand for a normal distribution with mean µ and standard deviation σ
 vocabulary scores for")
Normal Distributions The distribution of Iowa Test of Basic Skills (ITBS) vocabulary scores for 7 th grade students in Gary, Indiana, is close to Normal. Suppose the distribution is N(6. 84, 1. 55). a) Sketch the Normal density curve for this distribution. b) What percent of ITBS vocabulary scores are less than 3. 74? c) What percent of the scores are between 5. 29 and 9. 94?

Empirical Rule 1 standard deviation, σ 2 standard deviations, 2σ 3 standard deviations, 3σ

Examples: Suppose ACT scores are normally distributed with and What proportion scored between 20 and 26? What proportion scored between 23 and 26? What proportion scored between 17 and 20? What proportion scored above 29? What proportion scored below 14?

Examples: Suppose ACT scores are normally distributed with and What score would you need to get in order to score in the top 50%? What score would you need to get in order to score in the top 2. 5%?

Examples: Suppose ACT scores are normally distributed with and What proportion scored below 21?

Normal Population The scores of a reference population on the Wechsler Intelligence Scale for Children are normally distributed with µ = 100 and σ = 15 What scores would represent a 50 th percentile? (An observations percentile is the percent of the distribution that is at or to the left of the observation. ) Approximately what percent of the scores would range from 70 to 130? A score in what range would represent the top 16% of scores?

Normal Curve Applet Exercises �The average performance of women on the SAT, especially the math part, is lower than that of men. The reason for the gender gap is controversial. In 2000, women’s scores on the math SAT followed a normal distribution with mean 498 and a standard deviation 109. The mean for men was 533. What percent of women scored higher than the male mean?

Normal Curve Applet Exercises �Changing the mean of a normal distribution by a moderate amount can greatly change the percent of observations in the tails. Suppose that a college is looking for applicants with SAT math scores 700 and above. �Women’s scores that year had a normal distribution with mean 498 and standard deviation 109. What percent of women scored 700 or better? �In 2000, the scores of men on the math followed a normal distribution with mean 533 and standard deviation 115. What percent scored 700 or better?
 look like?")
What does the distribution of the z – scores (Standard Normal Distribution) look like? q. Standardizing does not change the shape of the distribution of a variable. q. Standardizing changes the center by making the mean 0. q. Standardizing changes the spread by making the standard deviation 1.

Because all Normal distributions are the same when we standardize, we can find areas under any Normal curve from a single table. Definition: The Standard Normal Table A is a table of areas under the standard Normal curve. The table entry for each value z is the area under the curve to the left of z. Suppose we want to find the proportion of observations from the standard Normal distribution that are less than 0. 81. We can use Table A: Z . 00 . 01 . 02 0. 7 . 7580 . 7611 . 7642 0. 8 . 7881 . 7910 . 7939 0. 9 . 8159 . 8186 . 8212 Normal Distributions � The Standard Normal Table P(z < 0. 81) =. 7910

Example, p. 117 Curve Find the proportion of observations from the standard Normal distribution that are between 1. 25 and 0. 81. - Normal Distributions �Finding Areas Under the Standard Normal Can you find the same proportion using a different approach? 1(0. 1056+0. 2090) = 1 – 0. 3146
 Ans: 0. 1587 2. P(z < 0.")
Standard Normal Calculations 1. P(z < -1) Ans: 0. 1587 2. P(z < 0. 75) Ans: 0. 7734 3. P(z > 1. 23) Ans: 0. 1093 4. P(-1 < z < 1) Ans: 0. 6826 5. P(-2 < z < 2) Ans: 0. 9544 6. 7. 8. P(z > 3) Ans: 0. 0013 P(z < k) = 0. 90, find k. Ans: k = 1. 28 Find the IQR for the standard normal distribution. Ans: ~1. 35

How to Solve Problems Involving Normal Distributions State: Express the problem in terms of the observed variable x. Plan: Draw a picture of the distribution and shade the area of interest under the curve. Do: Perform calculations. • Standardize x to restate the problem in terms of a standard Normal variable z. • Use Table A and the fact that the total area under the curve is 1 to find the required area under the standard Normal curve. Conclude: Write your conclusion in the context of the problem. Normal Distributions � Normal Distribution Calculations

� Normal Distribution Calculations Normal Distributions When Tiger Woods hits his driver, the distance the ball travels can be described by N(304, 8). What percent of Tiger’s drives travel between 305 and 325 yards? Using Table A, we can find the area to the left of z=2. 63 and the area to the left of z=0. 13. 0. 9957 – 0. 5517 = 0. 4440. About 44% of Tiger’s drives travel between 305 and 325 yards.

IQ scores are normally distributed with m = 100 and s = 16. 1. What percent of the scores are less than 108? Ans: 0. 6915 2. What percent of the scores are greater than 120? Ans: 0. 1057

IQ scores are normally distributed with m = 100 and s = 16. 3. What percent of the scores are between 90 and 115? Ans: 0. 5598 4. What score would you need in order to be at the 90 th percentile? Ans: ~120. 5

The amount of soda dispensed by a machine is normally distributed with m = 10 oz. and s = 0. 05 1. What percent of the cups contain less than 9. 9 oz. ? Ans: 0. 0228 2. What percent of the cups contain more than 9. 97 oz. ? Ans: 0. 7257 3. What percent of the cups contain between 10. 03 and 10. 08 oz. ? Ans: 0. 2195

Normal Distribution Calculations Cautions! �From the viewpoint of statistics, in contrast to that of probability, we always think of our models as approximations rather than truth. �Consider the SAT N(505, 110) , it can give reasonable accurate answers to interesting questions. However, it does not work very well in the extreme tails. �For example, calculate the number of students in a population of 100, 000 who score 835 or better.
- Slides: 25