Normal distribution FAISAL BIN DEHAISH Outlines Normal distribution

Normal distribution FAISAL BIN DEHAISH

Outlines Normal distribution Standard normal distribution Find probability when known z score Find z score from known areas Conversion to Standard normal distribution. Sampling distribution of sample mean

Normal distribution The normal distribution is the most important probability distribution in statistics because it fits many natural phenomena. For example, heights, blood pressure, measurement error, and IQ scores follow the normal distribution. It is also known as the Gaussian distribution. The normal distribution is a probability function that describes how the values of a variable are distributed.

Normal distribution has the following properties: Bell shaped curve Symmetrical 50% μ
 68% of the")
68 -95 -99. 7 Rule for Normal Distributions (Empirical rule ) 68% of the area under the curve within ± 1σ of μ 95% of the area under the curve within ± 2σ of μ 99. 7% of the area under the curve within ± 3σ of μ 7: NORMAL PROBABILITY DISTRIBUTIONS 5

Example: 68 -95 -99. 7 Rule Wechsler adult intelligence scores: Normally distributed with μ = 100 and σ = 15; X ~ N(100, 15) 68% of scores within μ ± σ = 100 ± 15 = 85 to 115 95% of scores within μ ± 2σ = 100 ± (2)(15) = 70 to 130 99. 7% of scores in μ ± 3σ = 100 ± (3)(15) = 55 to 145 6

Standard Normal Distribution The standard normal distribution has the following properties: ◦ mean equal to 0. ◦ standard deviation equal to 1. ◦ The total area under its density curve is equal to 1.

Standard Normal Distribution In this section we will develop a skill to : 1. Find Areas ( or probabilities ) corresponding to various regions under the graph. 2. Find z scores that correspond to areas under the graph.

Probabilities of the Standard Normal Distribution we have been using "X" to denote the variable of interest (e. g. , X=BMI, X=height, X=weight). However, when using a standard normal distribution, we will use "Z" to refer to a variable in the context. Z score: the distance along the horizontal scale of the standard normal distribution ( corresponding to the number of standard deviations above or below the mean ) Z indicates how many standard deviations away from the mean the point x lies. Area: the region under the curve.
 P ( z")
NORMAL DISTRIBUTION STANDARD NORMAL DISTRIBUTION P ( x > a ) P ( z > a ) P ( x < a ) P ( z < a ) P ( a < x < b ) P ( a < z < b )

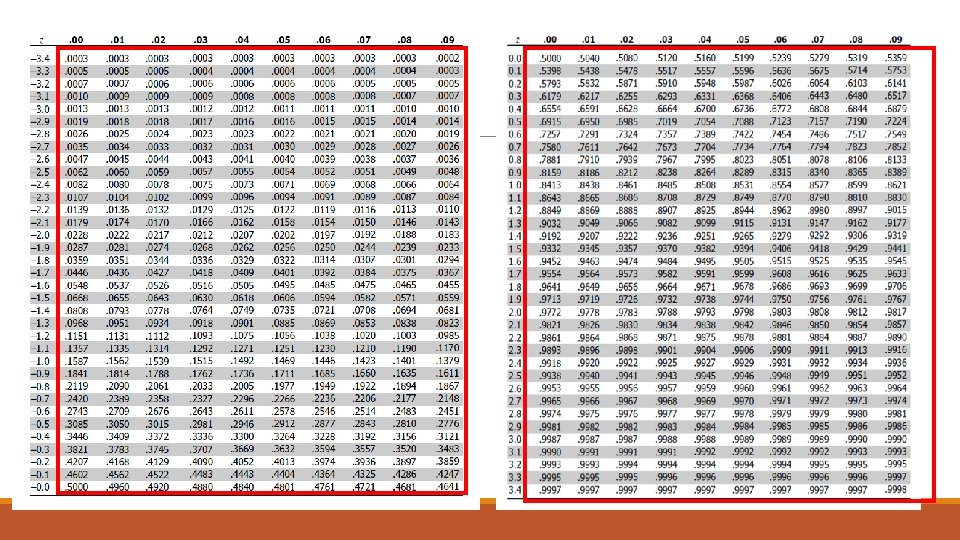
Finding probabilities when given Z Score You can manually find areas by Z score table or technology.

Find values on the right of the mean in this ztable. Table entries for z represent the area under the bell curve to the left of z. Positive scores in the Z-table correspond to the values which are greater than the mean.

Find values on the left of the mean in this negative Z score table. Table entries for z represent the area under the bell curve to the left of z. Negative scores in the z-table correspond to the values which are less than the mean

NOTE This table designed only for Standard normal distribution. Which is a normal distribution with a mean of 0 and a standard deviation of 1. The table is in two pages, POSITIVE scores and NEGATIVE scores. Each value in the body of the table is a CUMULATIVE are from the left up to a vertical boundary above a specific z score.

Example 1 A result of a bone density test score is normally distributed with a mean of 0 and a standard deviation of 1. A randomly selected adult undergoes a bone density test. Find the probability that this person has a bone density test score Less than 1. 27. Answer: the probability that this person has a bone density test score Less than 1. 27 is 0. 8980

Example 2 Using the same bone density test from the previous example, find the probability that a randomly selected person has a result above -1. 00. Answer: The probability that a randomly selected person has a result above -1. 00 is 0. 8413

Example 3 A bone density test reading between -1. 00 and -2. 50 indicates that the subject has Osteopenia. Which is a bone loss. Find the probability that a randomly selected subject has a reading between 1. 00 and -2. 50. a. Area = ?

Answer • Step 1 : Find the area of z = -1. 00 • Step 2 : Find the are of z = -2. 50 • Step 3 : 0. 1587 – 0. 0062 = 0. 1525 The probability that a randomly selected subject has a bone density reading between -1. 0 and -2. 50 is 0. 1525

Finding Z score from known areas • In many cases , we need a method for reversing the format given a known area or probability, find the corresponding z score. In such cases it is really important to avoid confusion between z score and areas. • Remember that z score are distance along the horizontal scale , but areas or probabilities are regions under density curve.

Example 1. Search in the body table for an area of 0. 025. The result is z = -1. 96. 2. Search in the body table for an area of 0. 975. The result is z = 1. 96

Special Cases Usually select the larger value when the area falls in between two table values. Special Cases should be considered. 0. 9500 falls between 1. 64 and 1. 65. An area of 0. 9999 is not in the table

To work with any NON-STANDARD NORMAL DISTRIBUTION with a mean different from 0 and or a standard deviation different from 1. The key is a simple conversion formula, which allows us to STANDARDIZE any normal distribution. So that x values can be transformed to z score. Then the methods of the preceding section can be used.
 P ( z")
NORMAL DISTRIBUTION STANDARD NORMAL DISTRIBUTION P ( x > a ) P ( z > a ) P ( x < a ) P ( z < a ) P ( a < x < b ) P ( a < z < b )

Example We noted that a pulse rates of adult males are normally distributed with a mean of 69. 6 bpm and a standard deviation of 11. 3 bpm. Find the proportion of adult males with a pulse rate greater than 100 bpm. Answer: Step one, convert a pulse rate of 100 bpm to its z score

• Step two , find the cumulative area to the left of z = 2. 69. The cumulative area is 0. 9964. • Step three, because the total area under the curve is 1, 1 – 0. 9964 = 0. 0036

Sampling distribution A sampling distribution is a probability distribution of a statistic obtained through a large number of samples drawn from a specific population. The sampling distribution of a given population is the distribution of frequencies of a range of different outcomes that could possibly occur for a statistic of a population. Each sample has its own sample mean and the distribution of the sample means is known as the sample distribution. Not just the mean can be calculated from a sample. Other statistics, such as the standard deviation, variance, proportion

Types of sampling distribution: 1. Sampling distribution of the mean. 2. Sampling distribution of the proportion. 3. Sampling distribution of the variance.

Sampling distribution of the sampling mean Example:

Sampling Distribution of the sample mean
")
The value of the mean of the population ( 4, 5, 9 ) is 6. Using the previous tables, we could calculate the mean of the sample values and we get 6. Because the means of the sample means is equal to the mean of the population, We can conclude that the values of the sample mean do target the value of the population mean.
- Slides: 31