Normal Approximation to a Discrete in particular Binomial
 Distribution")
Normal Approximation to a Discrete (in particular Binomial) Distribution

• Calculator needed!

 Distribution")
Normal Approximation to a Discrete (in particular Binomial) Distribution

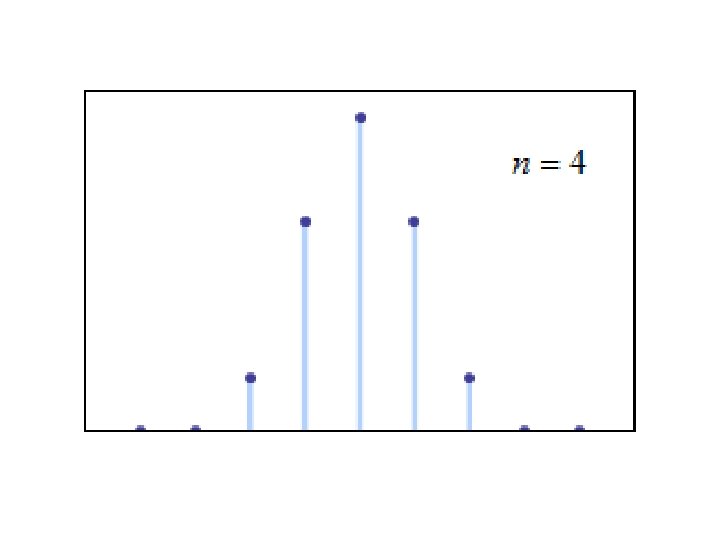
Using the Normal Distribution to Approximate a Discrete Distribution Suppose the probability distribution of a Often, a probability histogram can be well approximated by a discrete random variable x is displayed in anthe normal curve. If so, it is customary to say that x has approximately distribution. Suppose thisbelow. bar is centered at normal x = 6. The bar actually begins at histogram The probability of a particular value is 5. 5 and ends at 6. 5. Theses endpoints will be used in calculations. the area of the rectangle centered at This is called a continuity correction. that value. 6

Correction for Continuity

Example: Using a Correction for Continuity Use the correction for continuity to convert each of the following binomial intervals to a normal distribution interval. 1. The probability of getting between 270 and 310 successes, inclusive.

2. The probability of getting less than 63 successes.

3. The probability of getting at least 157 but less than 420 successes

When BPD can be approximated well by Normal?

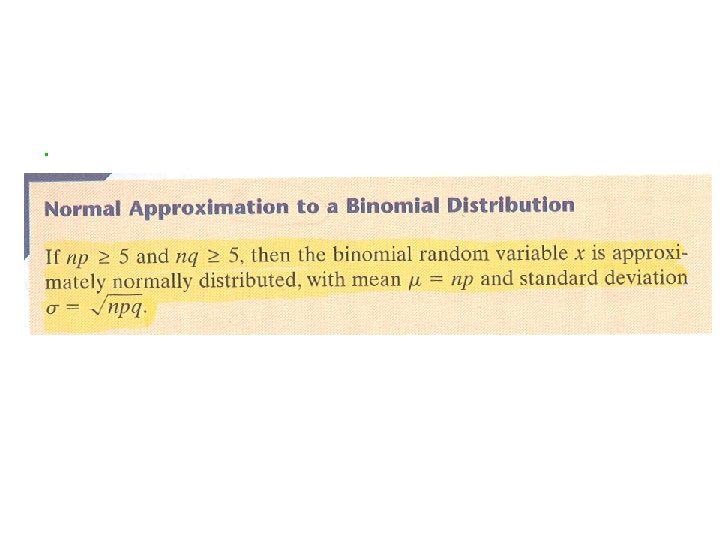
When BPD can be approximated well by Normal? When “n” is sufficiently large!!!! How large? Rule of thumb:

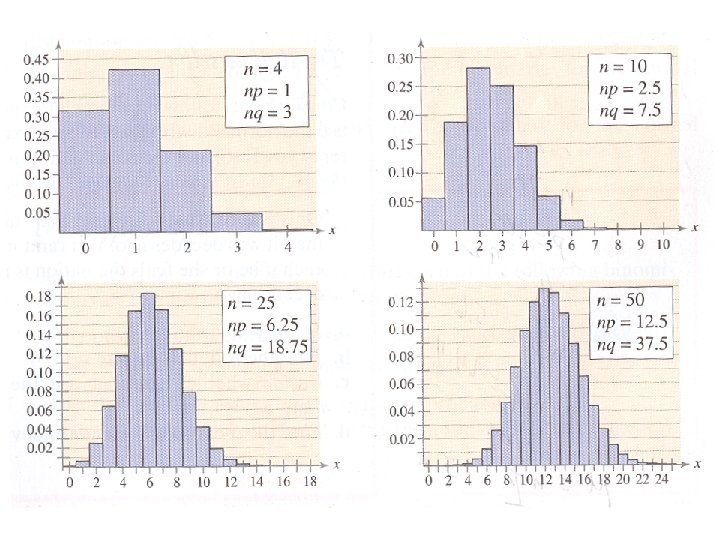
To see why this rule of thumb is valid, look at the following slide and binomial distributions for p = 0. 25 and n = 4, 10, 25 and 50. as n increases, the histogram approaches a normal curve. Notice that

https: //homepage. divms. uiowa. edu/~ mbognar/applets/binnormal. html

• http: //onlinestatbook. com/stat_sim/normal_ap prox/index. html

Normal Approximation to a Binomial Distribution Let x be a random variable based on n trials and success probability p, so that: If n and p are such that: np > 10 and n (1 – p) > 10 then x has an approximately normal distribution.

Example-1: Decide whether you can use the normal distribution to approximate 93% of Shenzhen Foreign Language school students want the winter schedule to remain the same through out the year. You randomly select 65 SFLS and ask each if he or she want the winter schedule to remain the same. In this binomial experiment, n = 65, p = 0. 93 and q = 0. 07, so: np = 65(0. 93) = 60. 45 and nq = 65(0. 07) = 4. 55 Because nq 10, you cannot use the normal distribution to approximate the distribution of x.

Example-2: Premature babies are born before 37 weeks, and those born before 34 weeks are most at risk. A study reported that 2% of births in the United States occur before 34 weeks. Suppose that 1000 births are randomly selected and that the number of these births Since both are greater than that occurred prior to 34 weeks, x, is to be 10, the distribution of x can determined. be approximated by Can the distribution of xabe approximated by normal distribution np = 1000(. 02) = 20 > 10 a normal distribution? n(1 – p) = 1000(. 98) = 980 > 10 Find the mean and standard deviation for the approximated normal distribution.

m = 20 and s = 4. 427 What is the probability the number of Look up thesethat values in the table and the prior to 34 babies in the sample ofsubtract 1000 born probabilities. weeks will be between 10 and 25 To(inclusive)? find the shaded area, standardize the. 8925 -. 0089 =. 8836 endpoints. P(10 < x < 25) =

Try Me: Twenty-nine percent of Chinese say they are confident that passenger trips to the moon will occur during their lifetime. You randomly select 200 Chinese and ask if he or she thinks passenger trips to the moon will occur in his or her lifetime. What is the probability that at least 50 will say yes?
 Very well b)")
Quick survey I feel I understand this chapter, Probability Distribution a) Very well b) With some review, I’ll be good c) Not really d) Not at all

Home-work Due-Monday Page-128+ 35 43 48 51 57 62 66 70 -72

Test/Presentation? If Test, -Only MCQ -20 -Wednesday If Presentation, -to be done in groups -Tuesday -5 -10 min presentation -Monday period will be for prep

Presentation

ch-7 Test on Tuesday Presentation ---Tuesday

Topics for presentation 1. Mean and s. d of -linear function - linear combination 2. BPD 3. GPD 4. NPD 5. Assessing Normality 6. Approximation of BPD by NPD

Presentation! • Each group will got one topic to teach your peers and 5 opportunities to be taught in unforgettable way! • * 5 -10 minutes

Every member of the group should participate in some way. Due- Tuesday, Monday class will be prep for your presentation! Mark- /10+10 (Class participation/Homework) Format: ppt or video or poster or Aurasma or ? Needless to say don’t make your presentation “dry”.
- Slides: 30