Nonlinear Regression KNNL Chapter 13 Nonlinear Relations wrt


 model: • g 0 ≡")


")


- Slides: 14
Nonlinear Regression KNNL – Chapter 13
Nonlinear Relations wrt X – Linear wrt bs
Nonlinear Regression Models
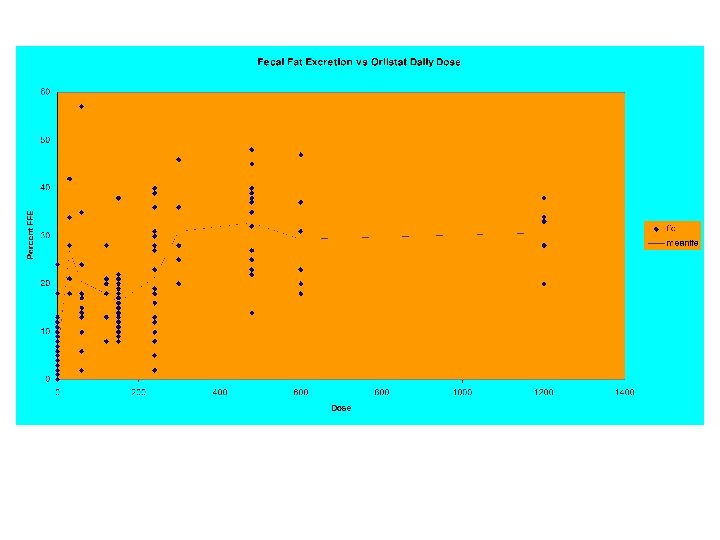
Data Description - Orlistat • 163 Patients assigned to one of the following doses (mg/day) of orlistat: 0, 60, 120, 150, 240, 300, 480, 600, 1200 • Response measured was fecal fat excretion (purpose is to inhibit fat absorption, so higher levels of response are considered favorable) • Plot of raw data displays a generally increasing but nonlinear pattern and large amount of variation across subjects
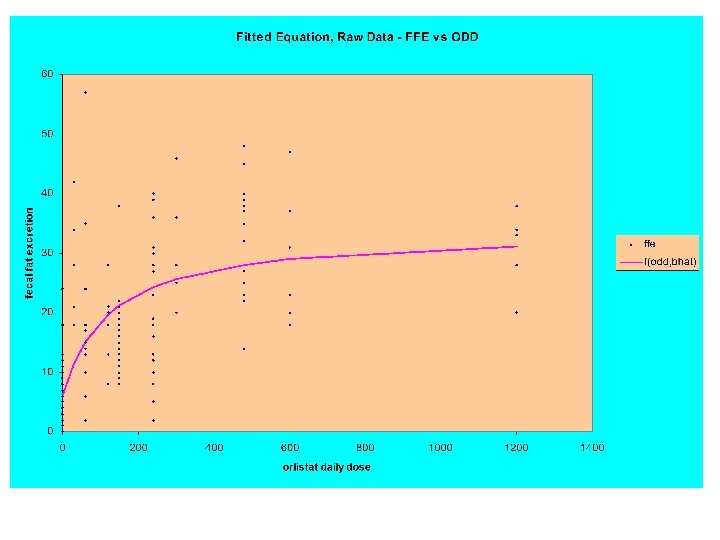
Nonlinear Regression Model - Example Simple Maximum Effect (Emax) model: • g 0 ≡ Mean Response at Dose 0 • g 1 ≡ Maximal Effect of Orlistat (g 0+ g 1 = Maximum Mean Response) • g 2 ≡ Dose providing 50% of maximal effect (ED 50)
Nonlinear Least Squares
Nonlinear Least Squares
Estimated Variance-Covariance Matrix
Orlistat Example • Reasonable Starting Values: • • – g 0: Mean of 0 Dose Group: 5 – g 1: Difference between highest mean and dose 0 mean: 33 -5=28 – g 2: Dose with mean halfway between 5 and 33: 160 Create Vectors Y and f (g 0) Generate matrix F(g 0) Obtain first “new” estimate of g Continue to Convergence
Orlistat Example – Iteration History (Tolerance =. 0001)
Variance Estimates/Confidence Intervals Parameter Estimate Std. Error 95% CI g 0 6. 12 1. 08 (3. 96 , 8. 28) g 1 27. 62 3. 48 (20. 66 , 34. 58) g 2 124. 7 47. 31 (30. 08 , 219. 32)
Notes on Nonlinear Least Squares For small samples: • When errors are normal, independent, with constant variance, we can often use the tdistribution for tests and confidence intervals (software packages do this implicitly) • When the extent of nonlinearity is extreme, or normality assumptions do not hold, should use bootstrap to estimate standard errors of regression coefficients