Non Imaging In Vivo Red Cell Survival Red


 withdraw 20 ml of")


 of")
- Slides: 9
Non Imaging In Vivo Red Cell Survival
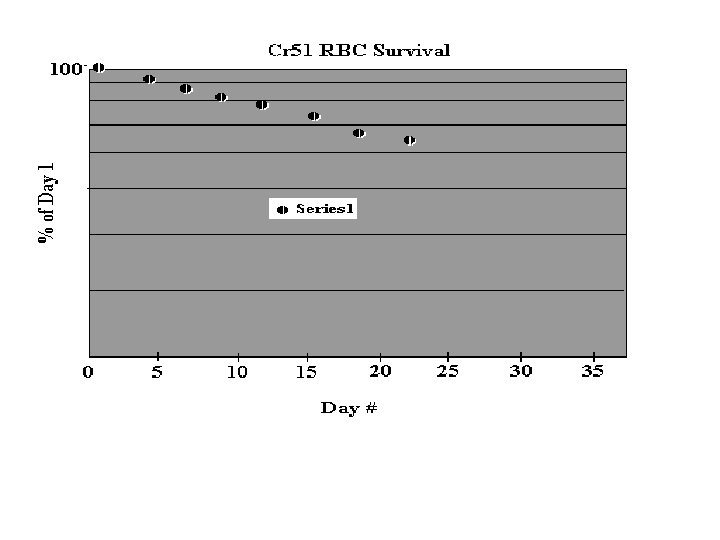
Red Cell Survival Test done to determine the rate of disappearance of labeled red blood cells from circulation.
Red Cell Survival Performed to determine if anemia is due to decreased survival of RBC’s. This type of anemia is called hemolytic anemia This test is also done on patient’s with Sickle Cell Anemia and Polycythemia Vera
Procedure For Red Cell Survival Tag blood like in Red Cell Volume, but increase dose of Cr 51 to 250 - 500 u. Ci Blood samples will be drawn 3 times a week for approximately 2 weeks
Procedure for RCS On day 1 (24 hours post injection) withdraw 20 ml of patient’s heparinized whole blood and record hematocrit Pipette 5 ml of whole blood into test tubes and label appropriately Centrifuge remaining blood Pipette 5 ml of plasma into sample test tubes and label appropriately Repeat 3 times a week for 2 weeks. All patient samples should be refrigerated during this time
Calculations After all samples have been collected, count whole blood and plasma samples for a minimum of 10, 000 counts, or 5 minutes each. – Whole blood samples should be mixed well to maintain counting geometry. Determine 5 minute counts for each 5 ml sample. Determine net red cell count for each sample. – Net red cell cts in 5 ml of Whole Blood = – Whole Blood cts/5 ml - Plasma cts/5 ml
Calculations Continued Determine 5 minute counts for red cells – Net red cells in 5 ml = net red cell cts of whole blood sample hematocrit Express counts of red cells for each sample as a % of day 1 red cell counts. – % Tagged Red Cells = Sample Net Cts of red cells x 100 Day 1 net counts of red cells Using semilog graph paper, plot % on log scale, time lapsed in days on the linear scale, draw a line thru 50% and determine number of days elapsed. – Half life disappearance reflects the true life
Findings Normal – Males and Females Red Cell Survival half time (50% survival) of 28 days Abnormal – Lower than 28 days – Caused by Hemolytic anemia Internal bleeding Blood transfusions during exam Return to the Table of Content