
NOBINA AB 1 Investor presentation Interim report June
NOBINA AB 1 Investor presentation, Interim report June 2019 – August 2019
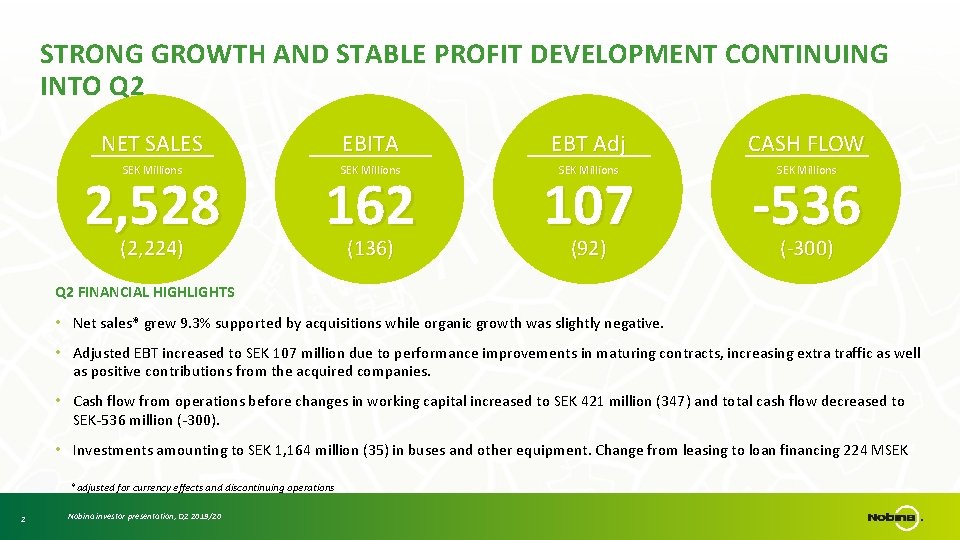
STRONG GROWTH AND STABLE PROFIT DEVELOPMENT CONTINUING INTO Q 2 NET SALES EBITA EBT Adj CASH FLOW SEK Millions 2, 528 (2, 224) 162 (136) 107 (92) -536 (-300) Q 2 FINANCIAL HIGHLIGHTS • Net sales* grew 9. 3% supported by acquisitions while organic growth was slightly negative. • Adjusted EBT increased to SEK 107 million due to performance improvements in maturing contracts, increasing extra traffic as well as positive contributions from the acquired companies. • Cash flow from operations before changes in working capital increased to SEK 421 million (347) and total cash flow decreased to SEK-536 million (-300). • Investments amounting to SEK 1, 164 million (35) in buses and other equipment. Change from leasing to loan financing 224 MSEK *adjusted for currency effects and discontinuing operations 2 Nobina investor presentation, Q 2 2019/20
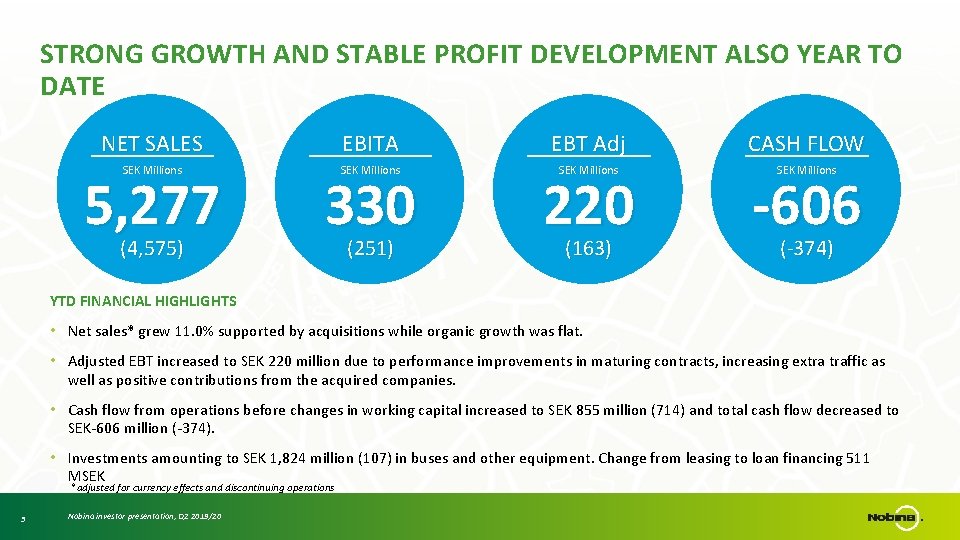
STRONG GROWTH AND STABLE PROFIT DEVELOPMENT ALSO YEAR TO DATE NET SALES EBITA EBT Adj CASH FLOW SEK Millions 5, 277 (4, 575) 330 (251) 220 (163) -606 (-374) YTD FINANCIAL HIGHLIGHTS • Net sales* grew 11. 0% supported by acquisitions while organic growth was flat. • Adjusted EBT increased to SEK 220 million due to performance improvements in maturing contracts, increasing extra traffic as well as positive contributions from the acquired companies. • Cash flow from operations before changes in working capital increased to SEK 855 million (714) and total cash flow decreased to SEK-606 million (-374). • Investments amounting to SEK 1, 824 million (107) in buses and other equipment. Change from leasing to loan financing 511 MSEK *adjusted for currency effects and discontinuing operations 3 Nobina investor presentation, Q 2 2019/20
HIGHLIGHTS § Comprehensive contract migration in Q 2 comprising several major contract start-ups encompassing 395 buses and contract terminations consisting of 378 buses. § The European Commission has declared that subsidies to publicly owned operators are not permitted § Nobina Sweden received Unionen’s LGBT-award for 2019, as Sweden’s most LGBT-friendly workplace. 4 Nobina investor presentation, Q 2 2019/20
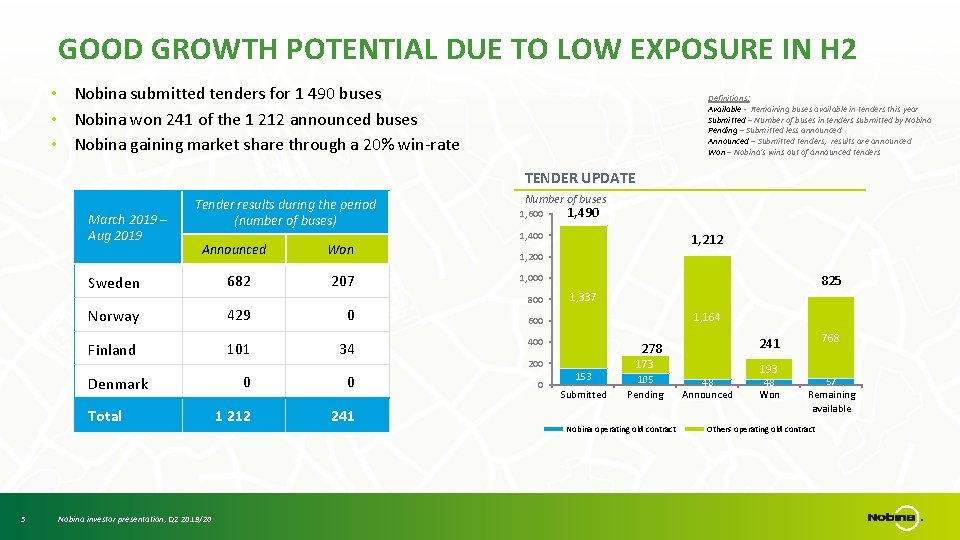
GOOD GROWTH POTENTIAL DUE TO LOW EXPOSURE IN H 2 • Nobina submitted tenders for 1 490 buses • Nobina won 241 of the 1 212 announced buses • Nobina gaining market share through a 20% win-rate Definitions: Available - Remaining buses available in tenders this year Submitted – Number of buses in tenders submitted by Nobina Pending – Submitted less announced Announced – Submitted tenders, results are announced Won – Nobina’s wins out of announced tenders TENDER UPDATE March 2019 – Aug 2019 Tender results during the period (number of buses) Announced Sweden 207 Norway 429 0 Finland 101 34 Denmark Total 5 682 Won Nobina investor presentation, Q 2 2019/20 0 0 1 212 241 Number of buses 1, 600 1, 490 1, 400 1, 212 1, 200 1, 000 825 1, 337 1, 164 600 400 200 0 153 Submitted 173 105 Pending Nobina operating old contract 768 241 278 48 Announced 193 48 Won 57 Remaining available Others operating old contract
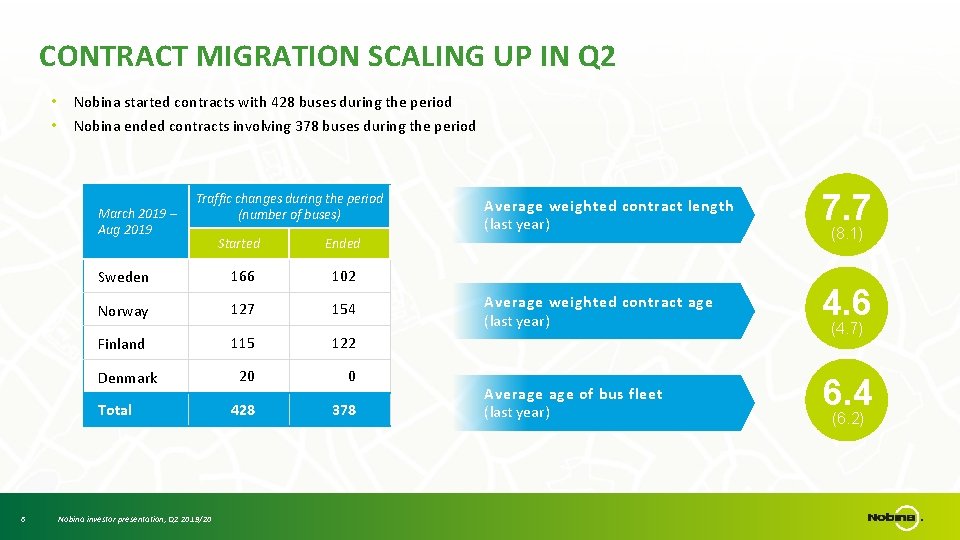
CONTRACT MIGRATION SCALING UP IN Q 2 • • Nobina started contracts with 428 buses during the period Nobina ended contracts involving 378 buses during the period March 2019 – Aug 2019 Traffic changes during the period (number of buses) Started Ended Sweden 166 102 Norway 127 154 Finland 115 122 20 0 428 378 Denmark Total 6 Nobina investor presentation, Q 2 2019/20 Average weighted contract length (last year) 7. 7 Average weighted contract age (last year) 4. 6 Average of bus fleet (last year) (8. 1) (4. 7) 6. 4 (6. 2)
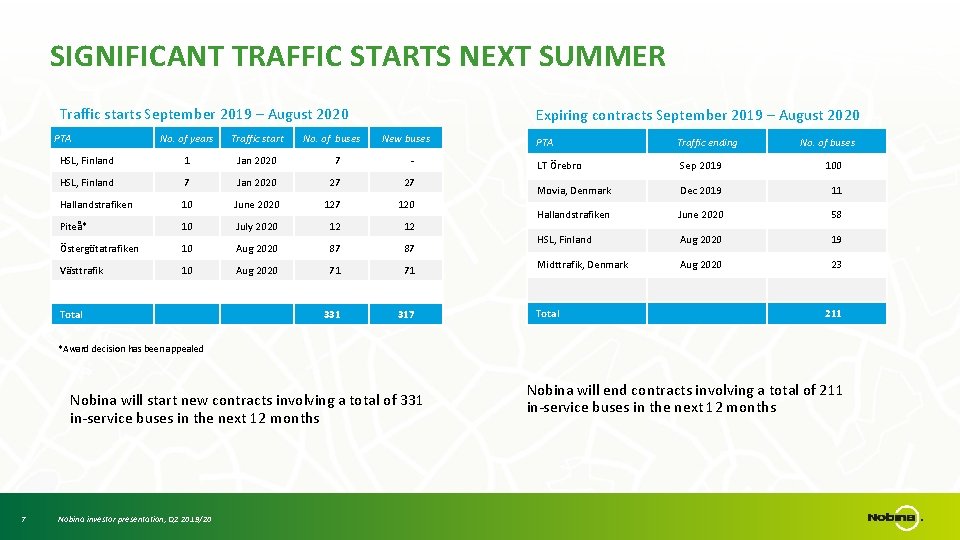
SIGNIFICANT TRAFFIC STARTS NEXT SUMMER Traffic starts September 2019 – August 2020 PTA No. of years Traffic start HSL, Finland 1 Jan 2020 7 - HSL, Finland 7 Jan 2020 27 27 Hallandstrafiken 10 June 2020 127 120 Piteå* 10 July 2020 12 12 Östergötatrafiken 10 Aug 2020 87 87 Västtrafik 10 Aug 2020 71 71 331 317 Total No. of buses Expiring contracts September 2019 – August 2020 New buses PTA Traffic ending No. of buses LT Örebro Sep 2019 100 Movia, Denmark Dec 2019 11 Hallandstrafiken June 2020 58 HSL, Finland Aug 2020 19 Midttrafik, Denmark Aug 2020 23 Total 211 *Award decision has been appealed Nobina will start new contracts involving a total of 331 in-service buses in the next 12 months 7 Nobina investor presentation, Q 2 2019/20 Nobina will end contracts involving a total of 211 in-service buses in the next 12 months
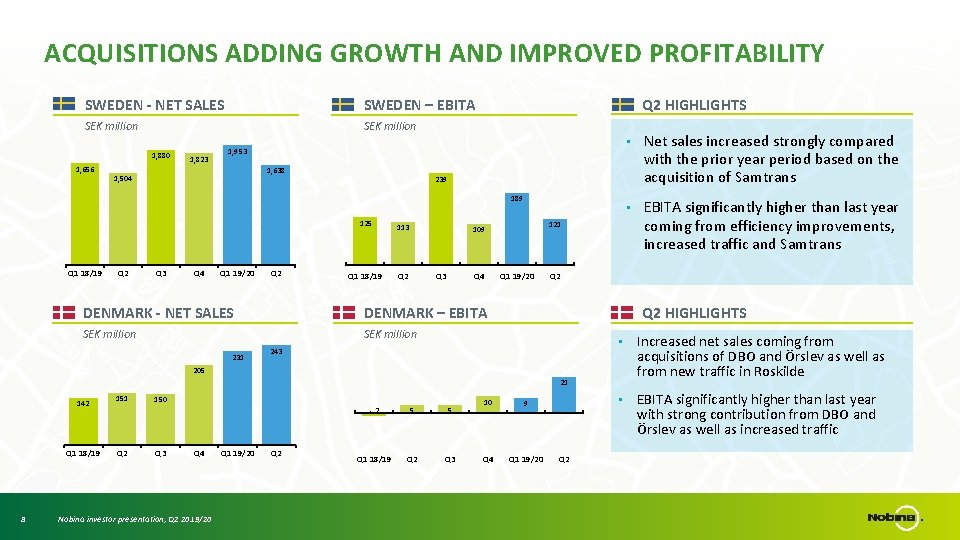
ACQUISITIONS ADDING GROWTH AND IMPROVED PROFITABILITY SWEDEN - NET SALES SWEDEN – EBITA SEK million 1, 880 1, 656 1, 823 Q 2 HIGHLIGHTS 1, 953 1, 638 1, 504 125 Q 2 Q 3 Q 4 Q 1 19/20 Q 2 Q 1 18/19 113 121 109 Q 2 Q 3 Q 4 DENMARK - NET SALES DENMARK – EBITA SEK million 231 Q 1 19/20 Q 1 18/19 8 Q 2 243 150 Q 3 Q 4 Nobina investor presentation, Q 2 2019/20 Q 1 19/20 Q 2 EBITA significantly higher than last year coming from efficiency improvements, increased traffic and Samtrans Q 2 HIGHLIGHTS • Increased net sales coming from acquisitions of DBO and Örslev as well as from new traffic in Roskilde • EBITA significantly higher than last year with strong contribution from DBO and Örslev as well as increased traffic 21 151 • Q 2 205 142 Net sales increased strongly compared with the prior year period based on the acquisition of Samtrans 239 189 Q 1 18/19 • -2 5 5 Q 1 18/19 Q 2 Q 3 10 9 Q 4 Q 1 19/20 Q 2
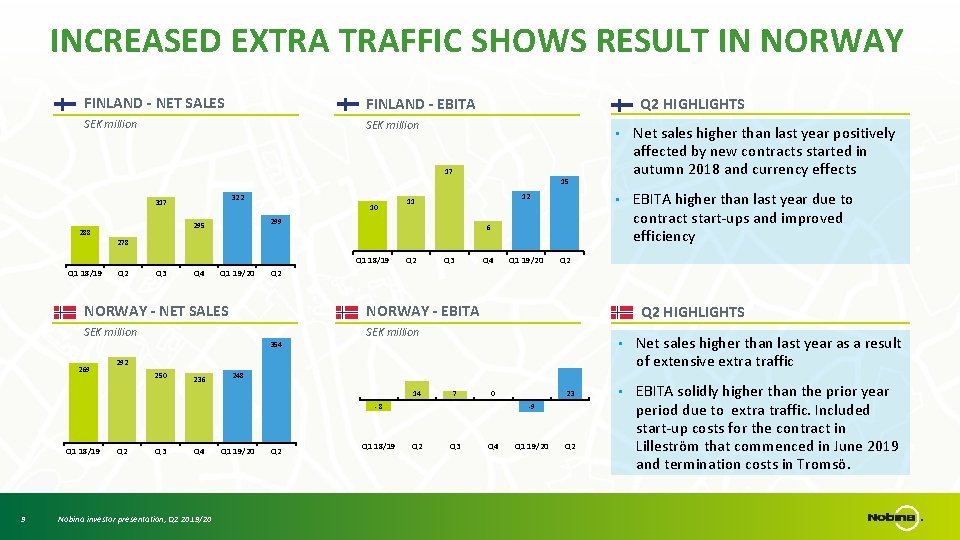
INCREASED EXTRA TRAFFIC SHOWS RESULT IN NORWAY FINLAND - NET SALES FINLAND - EBITA SEK million Q 2 HIGHLIGHTS • Net sales higher than last year positively affected by new contracts started in autumn 2018 and currency effects • EBITA higher than last year due to contract start-ups and improved efficiency 17 15 322 317 11 299 295 288 10 12 6 278 Q 1 18/19 Q 2 Q 3 Q 4 Q 1 19/20 Q 3 Q 4 354 Q 2 HIGHLIGHTS SEK million • Net sales higher than last year as a result of extensive extra traffic • EBITA solidly higher than the prior year period due to extra traffic. Included start-up costs for the contract in Lilleström that commenced in June 2019 and termination costs in Tromsö. 292 250 236 248 14 7 0 -8 9 Q 2 NORWAY - EBITA SEK million Q 1 18/19 Q 1 19/20 Q 2 NORWAY - NET SALES 269 Q 2 Q 3 Q 4 Nobina investor presentation, Q 2 2019/20 Q 1 19/20 Q 2 Q 1 18/19 23 -9 Q 2 Q 3 Q 4 Q 1 19/20 Q 2
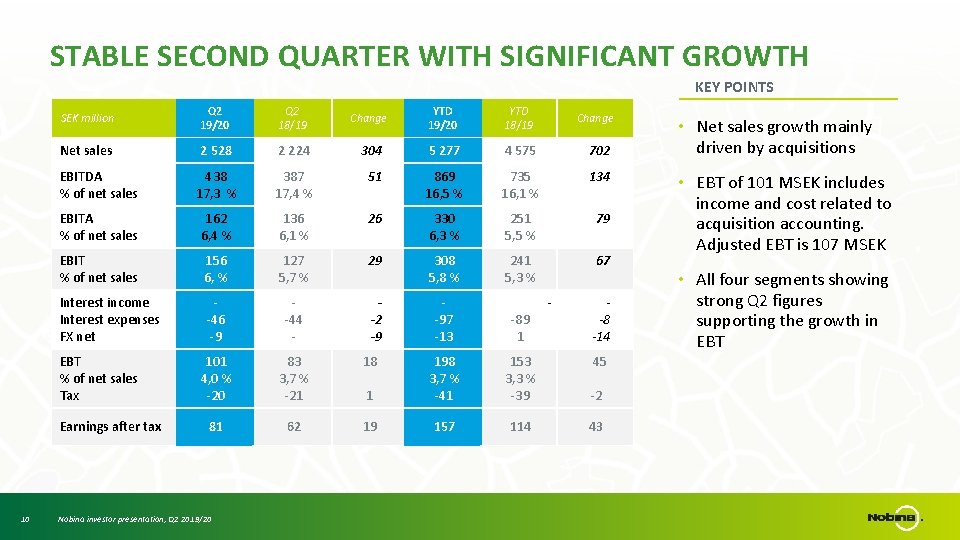
STABLE SECOND QUARTER WITH SIGNIFICANT GROWTH KEY POINTS SEK million Q 2 19/20 Q 2 18/19 Change YTD 19/20 YTD 18/19 Change Net sales 2 528 2 224 304 5 277 4 575 702 EBITDA % of net sales 438 17, 3 % 387 17, 4 % 51 869 16, 5 % 735 16, 1 % 134 EBITA % of net sales 162 6, 4 % 136 6, 1 % 26 330 6, 3 % 251 5, 5 % 79 EBIT % of net sales 156 6, % 127 5, 7 % 29 308 5, 8 % 241 5, 3 % 67 Interest income Interest expenses FX net -46 -9 -44 - -2 -9 -97 -13 -89 1 101 4, 0 % -20 83 3, 7 % -21 18 1 198 3, 7 % -41 153 3, 3 % -39 -2 81 62 19 157 114 43 EBT % of net sales Tax Earnings after tax 10 Nobina investor presentation, Q 2 2019/20 - -8 -14 45 • Net sales growth mainly driven by acquisitions • EBT of 101 MSEK includes income and cost related to acquisition accounting. Adjusted EBT is 107 MSEK • All four segments showing strong Q 2 figures supporting the growth in EBT
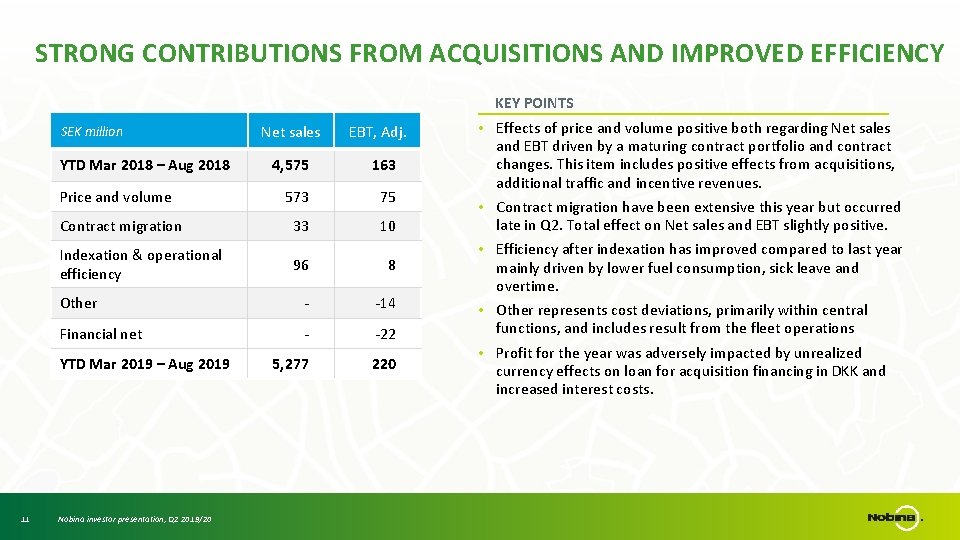
STRONG CONTRIBUTIONS FROM ACQUISITIONS AND IMPROVED EFFICIENCY KEY POINTS SEK million YTD Mar 2018 – Aug 2018 Price and volume Contract migration Indexation & operational efficiency EBT, Adj. 4, 575 163 573 75 33 10 96 8 Other - -14 Financial net - -22 5, 277 220 YTD Mar 2019 – Aug 2019 11 Net sales Nobina investor presentation, Q 2 2019/20 • Effects of price and volume positive both regarding Net sales and EBT driven by a maturing contract portfolio and contract changes. This item includes positive effects from acquisitions, additional traffic and incentive revenues. • Contract migration have been extensive this year but occurred late in Q 2. Total effect on Net sales and EBT slightly positive. • Efficiency after indexation has improved compared to last year mainly driven by lower fuel consumption, sick leave and overtime. • Other represents cost deviations, primarily within central functions, and includes result from the fleet operations • Profit for the year was adversely impacted by unrealized currency effects on loan for acquisition financing in DKK and increased interest costs.
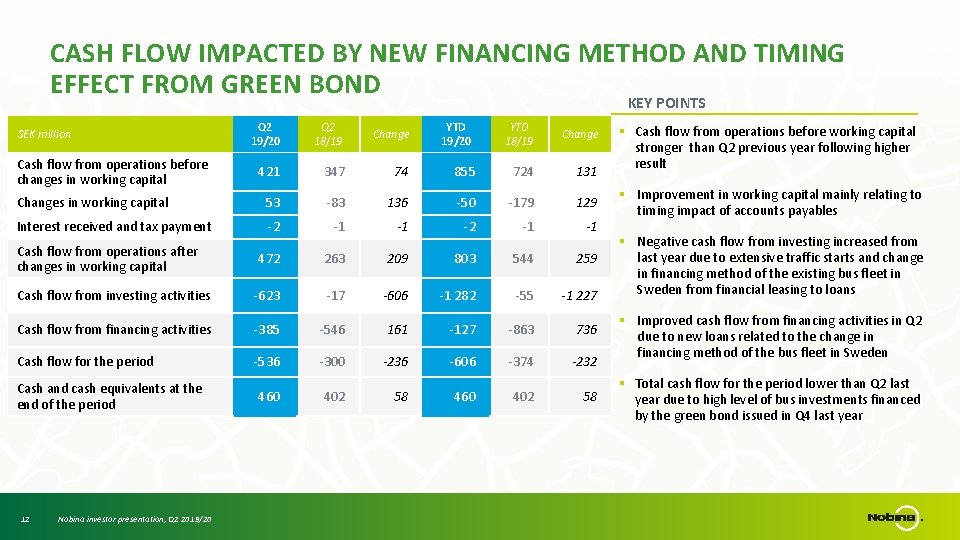
CASH FLOW IMPACTED BY NEW FINANCING METHOD AND TIMING EFFECT FROM GREEN BOND KEY POINTS Q 2 19/20 Q 2 18/19 Change YTD 18/19 Change 421 347 74 855 724 131 Changes in working capital 53 -83 136 -50 -179 129 Interest received and tax payment -2 -1 -1 472 263 209 803 544 259 Cash flow from investing activities -623 -17 -606 -1 282 -55 -1 227 Cash flow from financing activities -385 -546 161 -127 -863 736 Cash flow for the period -536 -300 -236 -606 -374 -232 SEK million Cash flow from operations before changes in working capital Cash flow from operations after changes in working capital Cash and cash equivalents at the end of the period 12 Nobina investor presentation, Q 2 2019/20 460 402 58 YTD 19/20 460 402 58 § Cash flow from operations before working capital stronger than Q 2 previous year following higher result § Improvement in working capital mainly relating to timing impact of accounts payables § Negative cash flow from investing increased from last year due to extensive traffic starts and change in financing method of the existing bus fleet in Sweden from financial leasing to loans § Improved cash flow from financing activities in Q 2 due to new loans related to the change in financing method of the bus fleet in Sweden § Total cash flow for the period lower than Q 2 last year due to high level of bus investments financed by the green bond issued in Q 4 last year
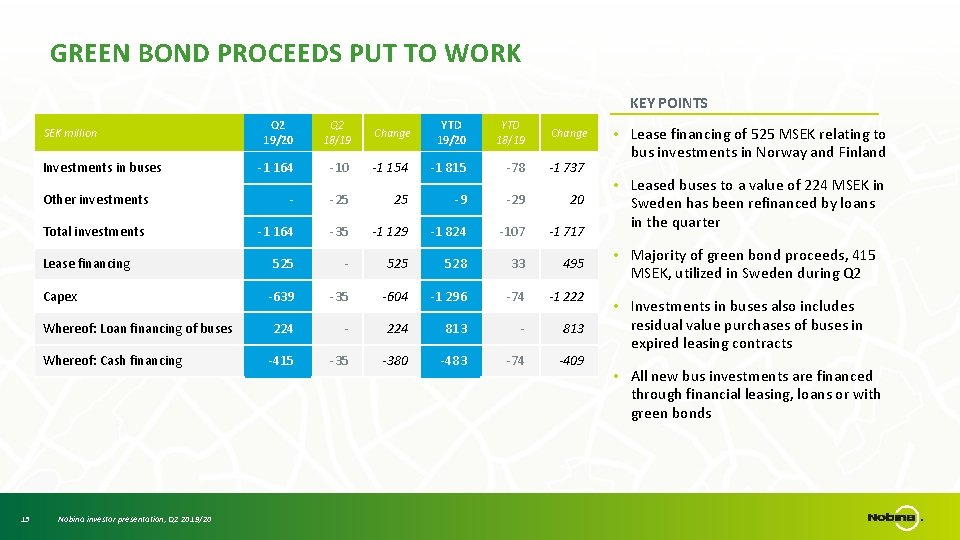
GREEN BOND PROCEEDS PUT TO WORK KEY POINTS SEK million Investments in buses Other investments Total investments Lease financing Capex Whereof: Loan financing of buses Whereof: Cash financing Q 2 19/20 Q 2 18/19 Change YTD 19/20 YTD 18/19 Change -1 164 -10 -1 154 -1 815 -78 -1 737 - -25 25 -9 -29 20 -1 164 -35 -1 129 -1 824 -107 -1 717 525 - 525 528 33 495 -639 -35 -604 -1 296 -74 -1 222 224 - 224 813 -415 -380 -483 -74 -409 • Lease financing of 525 MSEK relating to bus investments in Norway and Finland • Leased buses to a value of 224 MSEK in Sweden has been refinanced by loans in the quarter • Majority of green bond proceeds, 415 MSEK, utilized in Sweden during Q 2 • Investments in buses also includes residual value purchases of buses in expired leasing contracts • All new bus investments are financed through financial leasing, loans or with green bonds 13 Nobina investor presentation, Q 2 2019/20
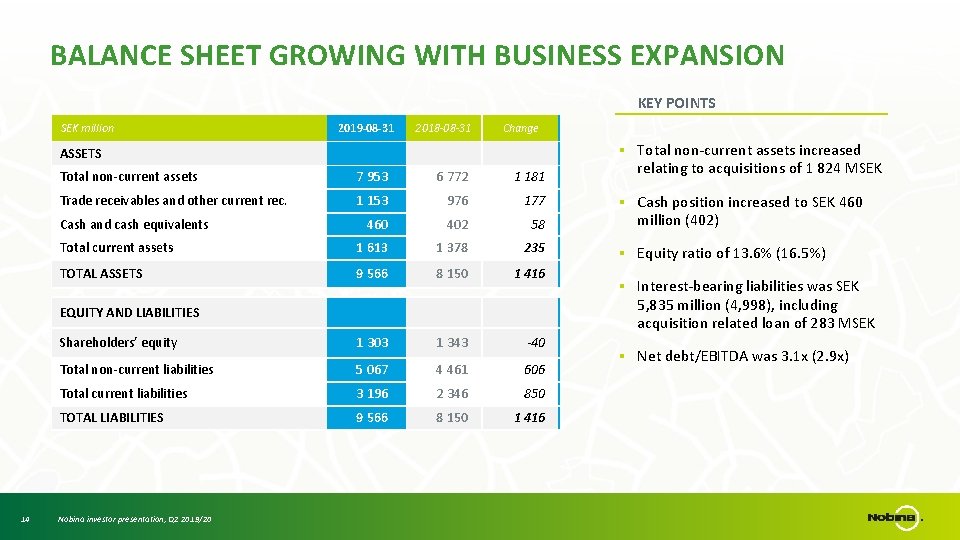
BALANCE SHEET GROWING WITH BUSINESS EXPANSION KEY POINTS SEK million 2019 -08 -31 2018 -08 -31 Change § Total non-current assets increased ASSETS Total non-current assets 7 953 6 772 1 181 Trade receivables and other current rec. 1 153 976 177 460 402 58 Total current assets 1 613 1 378 235 TOTAL ASSETS 9 566 8 150 1 416 Cash and cash equivalents Shareholders’ equity 1 303 1 343 -40 Total non-current liabilities 5 067 4 461 606 Total current liabilities 3 196 2 346 850 TOTAL LIABILITIES 9 566 8 150 1 416 Nobina investor presentation, Q 2 2019/20 § Cash position increased to SEK 460 million (402) § Equity ratio of 13. 6% (16. 5%) § Interest-bearing liabilities was SEK 5, 835 million (4, 998), including acquisition related loan of 283 MSEK EQUITY AND LIABILITIES 14 relating to acquisitions of 1 824 MSEK § Net debt/EBITDA was 3. 1 x (2. 9 x)

CONTINUED STABLE DEVELOPMENT 15 • Significant growth from acquisitions • Stable earnings development in Q 2 while the comparison figures in H 2 will be more challenging due to contract migration • Comprehensive contract migration late in Q 2 starting up 395 buses and terminating 378 buses • Good potential for securing market share increase in H 2 due to low exposure • EU Commission decision important step for fair competition Nobina investor presentation, Q 2 2019/20
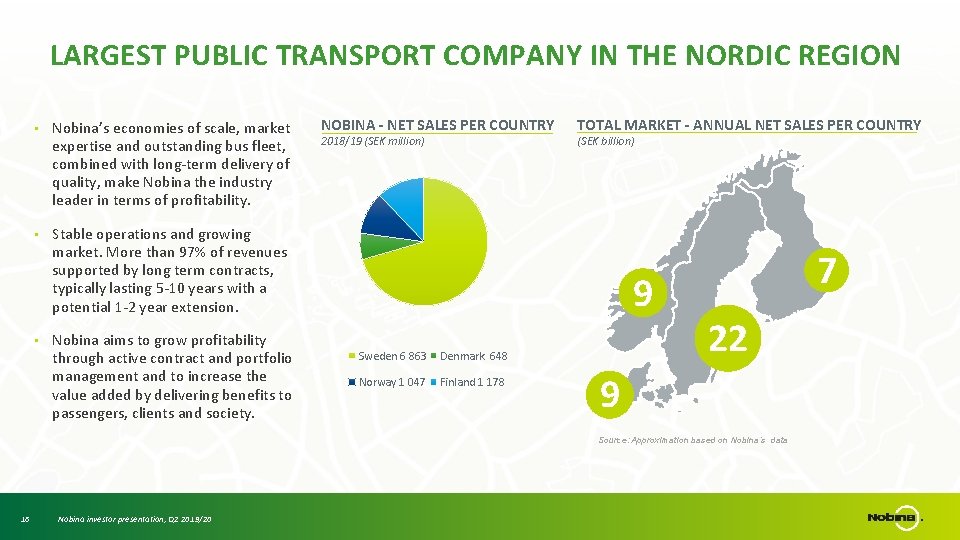
LARGEST PUBLIC TRANSPORT COMPANY IN THE NORDIC REGION • Nobina’s economies of scale, market expertise and outstanding bus fleet, combined with long-term delivery of quality, make Nobina the industry leader in terms of profitability. • Stable operations and growing market. More than 97% of revenues supported by long term contracts, typically lasting 5 -10 years with a potential 1 -2 year extension. • Nobina aims to grow profitability through active contract and portfolio management and to increase the value added by delivering benefits to passengers, clients and society. NOBINA - NET SALES PER COUNTRY 2018/19 (SEK million) TOTAL MARKET - ANNUAL NET SALES PER COUNTRY (SEK billion) 9 Sweden 6 863 Denmark 648 Norway 1 047 Finland 1 178 7 22 9 Source: Approximation based on Nobina’s data 16 Nobina investor presentation, Q 2 2019/20
DISCLAIMER – IMPORTANT INFORMATION This presentation and the information contained herein are being presented by Nobina AB (publ) (the “Company”). By attending a meeting where this presentation is presented, or by reading this presentation, you agree to be bound by the following limitations and notifications. This presentation does not constitute an offer or invitation to purchase or subscribe for any securities and does not constitute any form of commitment or recommendation on the part of the Company. This presentation does not purport to be all-inclusive or to contain all the information that prospective investors may desire in analysing and deciding whether or not to hold or transact in any of the Company’s securities. Furthermore, recipients of this presentation should not treat the contents of this presentation as advice relating to legal, taxation, financial or other matters and are advised to consult their own professional advisors concerning the acquisition, holding or disposal of any of the Company’s securities. Certain information contained in this presentation has been obtained from published sources prepared by other parties that the Company has deemed to be relevant. However, neither the Company nor any other person assumes any responsibility whatsoever and makes no representation or warranty, express or implied, for the contents of this presentation, including its accuracy, completeness or verification for any other statement made or purported to be made by any of them, or on their behalf. Nothing in this presentation is, or shall be relied upon as, a representation or promise made, whether as to the past, present or future. Accordingly, no responsibility is accepted by the Company, its subsidiaries or associates or any of their directors, officers, employees or agents, in respect thereof. This presentation contains forward-looking statements that reflect the Company’s current views with respect to certain future events and potential financial performance. While the Company believes that the expectations reflected in such forward-looking statements are reasonable, no assurance can be given that such expectations will materialise. Accordingly, results could differ materially from those set out in the forward-looking statements as a result of various factors. To the extent that this presentation contains opinions, estimates, forecasts or other forward looking statements, no guarantees or undertakings that these are correct or complete are given by the Company or any of its members, advisors, officers or employees or any other person. Forecasts and assumptions which are subject to economic and competitive uncertainty are outside such person’s control and no guarantee can be given that projected results will be achieved or that outcomes will correspond with forecasts. Information in this presentation may be changed, added to or corrected without advance notification. The Company does not undertake any obligation to publicly update or revise any information contained herein. This presentation as well as any other information provided by or on behalf of the Company shall be governed by Swedish law. The courts of Sweden, with the District Court of Stockholm as the first instance, shall have exclusive jurisdiction to settle any conflict or dispute arising out of or in connection with this presentation or related matters. 17 Nobina investor presentation, Q 2 2019/20
18
- Slides: 18