NOAA Hydrometeorological Design Studies Center Precipitation Frequency Data
 http: //hdsc. nws. noaa.")
. The interval over which")

")


- Slides: 10
NOAA Hydrometeorological Design Studies Center Precipitation Frequency Data Server (PFDS) http: //hdsc. nws. noaa. gov/hdsc/pfds/ The standard source for design storm data CEE 3430 – Spring 2011 David Tarboton 1
Terminology used in Precipitation Frequency Analysis • • Duration (Td). The interval over which precipitation occurs. Intensity (i). The average precipitation rate over a specified duration D = i Td Depth (D). The total precipitation over a specified duration Exceedance probability (P). The probability associated i with exceeding a given amount in any given period (usually year) once or more than once. Time Recurrence interval or Return period (T). The average Td interval between events of a set magnitude, evaluated as the inverse of the exceedence probability A 50 year return period event has a 1/50 = 0. 02 probability of being exceeded in any one year Frequency. General term for specifying the average recurrence interval or annual exceedance probability. Annual maximum series (AMS). Time series of the largest amounts in a continuous period (usually year). Partial duration series (PDS). Time series that includes all amounts above a pre-defined threshold regardless of year; it can include more than one event in any particular year. Rate • Based on http: //www. nws. noaa. gov/oh/hdsc/glossary. html
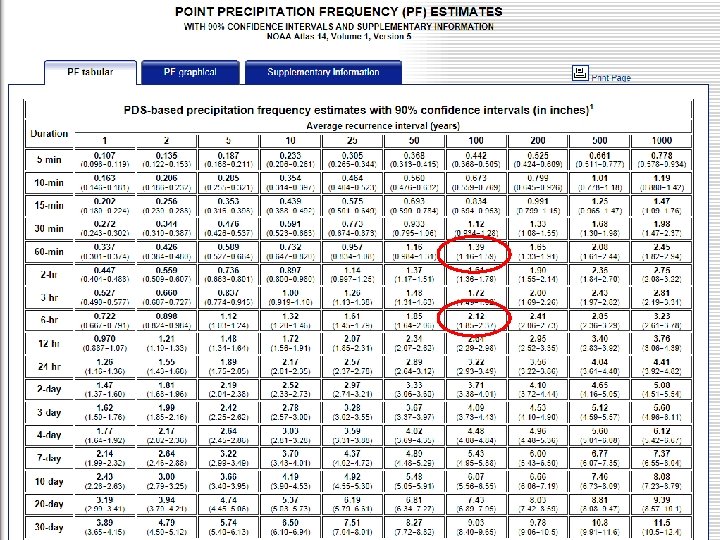
Example – Design Rainfall for Logan • What amount of rain in Logan in a 6 hr period is a 100 yr storm • What amount of rain in Logan in a 1 hr period is a 100 year storm http: //hdsc. nws. noaa. gov/hdsc/pfds/
From NOAA Atlas 14 (for Utah)
From NOAA Atlas 2 http: //www. nws. noaa. gov/oh/hdsc/PF_documents/Atlas 2_Volume 5. pdf
From NOAA Atlas 2 http: //www. nws. noaa. gov/oh/hdsc/PF_documents/Atlas 2_Volume 5. pdf
Example Tabulated are the data from a storm within a 23, 300 ha basin Interval of isohyets (cm) Enclosed area (ha x 1000) 0 -2 2 -4 4 -6 6 -8 8 -10 10 -12 12 -14 6 5 4. 1 3. 3 2. 5 1. 6 0. 8 a) Determine the average depth of precipitation within the basin b) Develop the depth-area relationship
Example Consider a rainfall event having a 5 -min cumulative rainfall record given below Time (min) Cumulative rainfall (mm) 0 0 5 6 10 13 15 24 20 36 25 40 30 45 35 45 40 45 a) What is the duration of the entire rainfall event b) What is the total amount of rainfall c) Find the rainfall hyetograph with 10 min time steps (in mm/hr) d) Find the maximum 10 -min and 20 -min average rainfall intensities (mm/hr)for this event
Summary • The atmosphere is the major link between oceans and continents • The hydrologic cycle is shaped by conditions in the atmosphere with precipitation as the major input • Precipitation due to atmospheric moisture, lifting, cooling, condensation, release of latent heat, instability • Precipitation variability is summarized statistically in intensity-duration-frequency curves used for design • Spatial averaging methods are used to calculate precipitation over a watershed