NMP Online Updates Review of Fertiliser plan for


 of the Good Agricultural Practice for")


 • Critical sources areas (CSA’s) areas that deliver")


- Slides: 48
NMP Online Updates & Review of Fertiliser plan for best environmental outcomes Tim Hyde Teagasc 20 th February 2018
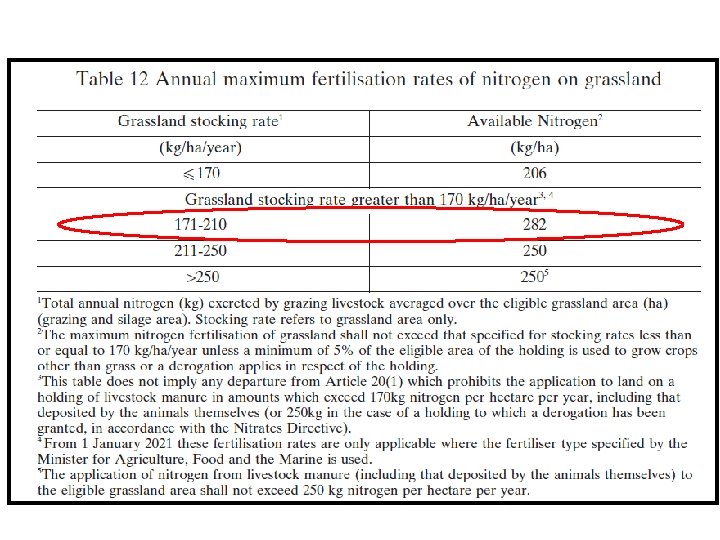
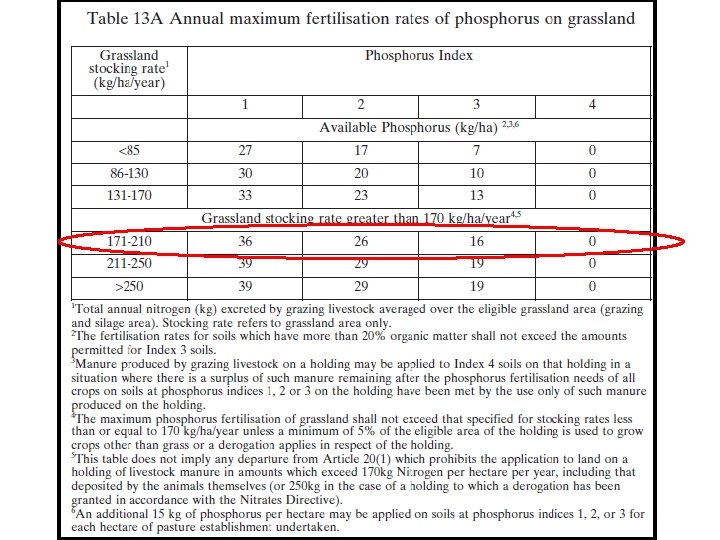
NAP Changes built into NMP online • Table 12 Annual Maximum Fertiliser rates of N • Table 13 A Annual Maximum Fertiliser rates of P • Table 13 B Annual Maximum Fertiliser rates of P Ø Soil P Build-up (Optional Settings) • OM map >20% (Map Viewer) • Previous Years GSR (General settings) ØDerogation application 2018 takes precedence
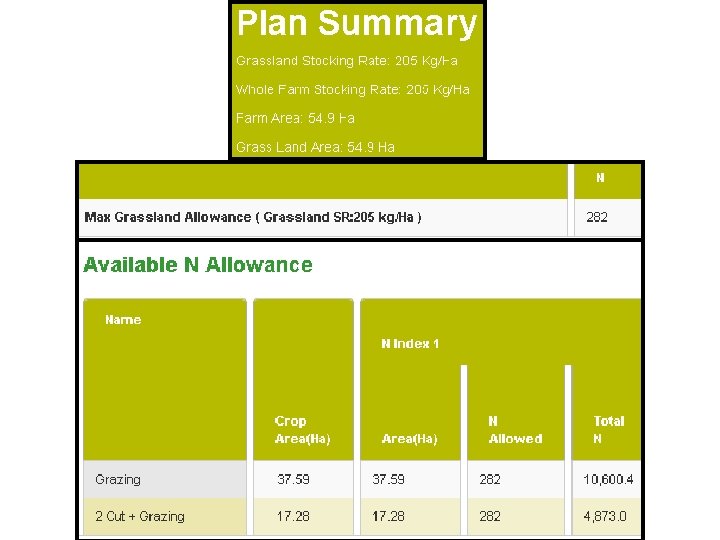
Available N Table 12 - 54. 86 ha x 282 kg/ha
No P Build-up
Soil Phosphorus Build-Up Programme • Under article 16(5) of the Good Agricultural Practice for Protection of Waters Regulations (S. I. No 605/2017), effective from 1 January 2018, grassland farmers now have the option of using increased Phosphorus (P) build-up levels to rectify soil phosphorus deficiency. This new provision applies only to the more intensively stocked grassland farmers, with Grassland stocking rates of 130+ kg N/ ha.
DAFM Nitrates Div. Circular No. 01/2018 Soil Phosphorus Build-Up Programme • Soil analysis is required including for soil Organic Matter (OM) content unless it is certified that soils on a holding are mineral soils, or the advisor certifies they are organic soils and build up rates will not be used. • P Buildup only applies to mineral/clay/loam Grassland soils • For those farmers applying for a Nitrates Derogation in 2018 and who wish to use the new P build-up rates, on-line NMP uploaded to Derogation Ag. Food satisfies DAFM notification requirements. • For non-derogation farmers who wish to use the new P build-up rates, a copy of the Teagasc on-line NMP must be emailed to DAFM at pbuildup@agriculture. gov. ie by 31 Dec 2018. • To ensure the protection of the environment, farmers using the increased P build-up rates are required to participate in a dedicated KT programme, delivered by a FAS advisor, by 31 December 2018.
How to change plan to Soil P Build-up
P Build-up
• • In this case study % increases in N and P P increase will depend on % P index, 1 – 4 soils? Will P index 1 & 2 soils receive organic manures? Table 9 Nutrient availability in fertilisers Warning! Higher P Buildup Conditions selected and no soil sample area can exceed 5 Ha on the entire farm Rates etc SI 31/2014 New Table 13 A New Table 13 B Max chemical N Total Kgs 10, 111 % increase N/A. Max chemical P Total Kgs 917 10, 222 1. 5% 1090 18. 50% 10, 222 1. 5% 1820 98% (67%) N/A.
• • Derogation report for P Buildup Manure Storage Capacity needs to be completed Soiled water, Slurry and FYM sections P Build-up will appear on front page of reports Derogation – Fertiliser Plan 2018 (Soil P Build-up)
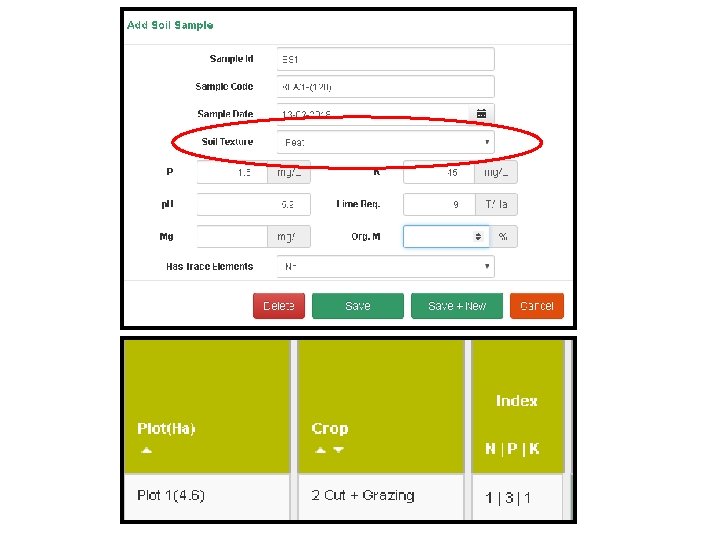
• Available on NMP • Available on Ag. Food • 3 options 1. Take OM for all plots in high OM map 2. FAS sign off on plots that are non high OM 3. Assume P index 3 for all soils concerned and no OM test required 4. Assign Peat as soil type and NMP defaults P index 1 and 2 soils to P Index 3
How to find this on NMP Online • Map Viewer – select Layer Control • Layer appears as brown hatched layer
OSI Layer
Ortho Layer
Plots 1, 2, 11, 12, 13 A and 13 B? ?
Mineral soil Peat soil OM>20% Peat soil no OM test
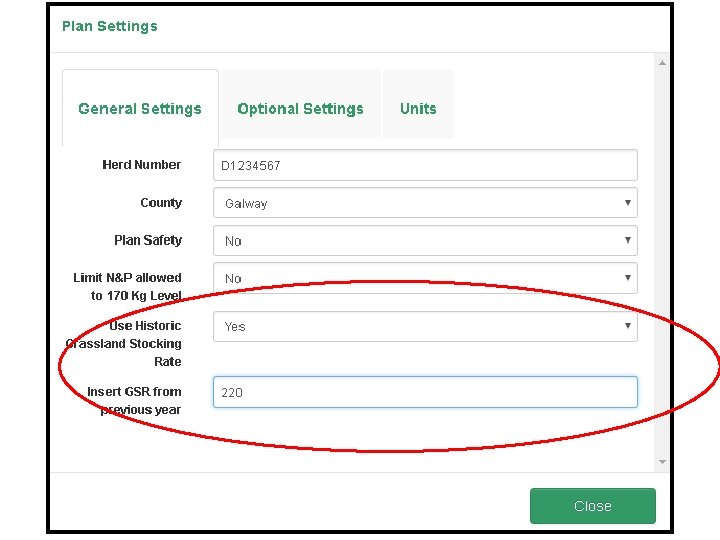
Previous years GSR • Not applicable to new derogation applicants in 2018 as they can use the predicted GSR • Except if in derogation in 2017 and will be changing bands within derogation from <210 to >210 – these must use previous years GSR • Non-derogation farmers 2018 will all use previous years GSR • Can select either function in NMP Online
What to consider when completing NMP’s • • OM maps Watercourses, streams and dry drains Sloped fields and fields prone to waterlogging Wells and water abstractions points Critical Source Areas Water quality in the area Where to get water quality information Application of organic manures can then be applied to the lower P index soils where appropriate
OM Layer – No P Buildup on >20% OM soils
Consider drains/watercourses & buffer zones
Buffer Zones Buffer zones for spreading organic fertilisers Water body/Feature Buffer zone Any water supply source providing 100 m 3 or more of water per day, or 200 metres (or as little serving 500 or more people as 30 metres where a local authority allows) Any water supply source providing 10 m 3 or more of water per day, or serving 50 or more people 100 metres (or as little as 30 metres where a local authority allows) Any other water supply for human consumption 25 metres (or as little as 15 metres where a local authority allows) Lake shoreline Exposed cavernous or karstified limestone features (such as swallow holes and collapse features) 20 metres 15 metres Any surface watercourse where the slope towards the watercourse exceeds 10% Any other surface waters 10 metres 5 metres*
Buffer Zones • *The 5 metre buffer zone is increased to 10 metres for a period of two weeks preceding and two weeks following the periods when application of fertilisers to land is prohibited • The objective of increased setback distances at the shoulders of the closed period is to help retain as much of the applied nutrient in the field as possible thereby reducing its risk of loss through overland flow. • In the case of water for human consumption, the Local Authority may vary buffer widths from those specified
Buffer zones applicable when farmyard manure is stored in a field Water body/Feature Buffer zone Any water supply source providing 100 m 3 or more of water per day, or serving 500 or more people Any water supply source providing 10 m 3 or more of water per day, or serving 50 or more people Any other water supply for human consumption 250 metres Lake shoreline 20 metres Exposed cavernous or karstified limestone features (such as swallow holes and collapse features) 50 metres Any other surface waters 20 metres 250 metres Silage bales may not be stored outside of farmyards within 20 metres of waters or a drinking water abstraction point in the absence of adequate facilities for the collection and storage of any effluent that may arise. Supplementary feeding No supplementary feeding points may be located within 20 m of surface water or on bare rock
250 m buffer zone excludes organic fertilisers from plots 11, 12 and northern part of plot 13 A Need to consider Wells and water abstraction points
Need to consider sloped fields near watercourses and drains
Critical Source Area • • • Heavy clay soil Slopes from other fields into this area Prone to occasional flooding from River
Tradition was to spread on the driest fields Field to the east is a peat soil with P index 4 Field to the south is a CSA P Index 4 soil
Need to use other Mapping layers www. catchments. ie
Groundwater Waterbodies Risk
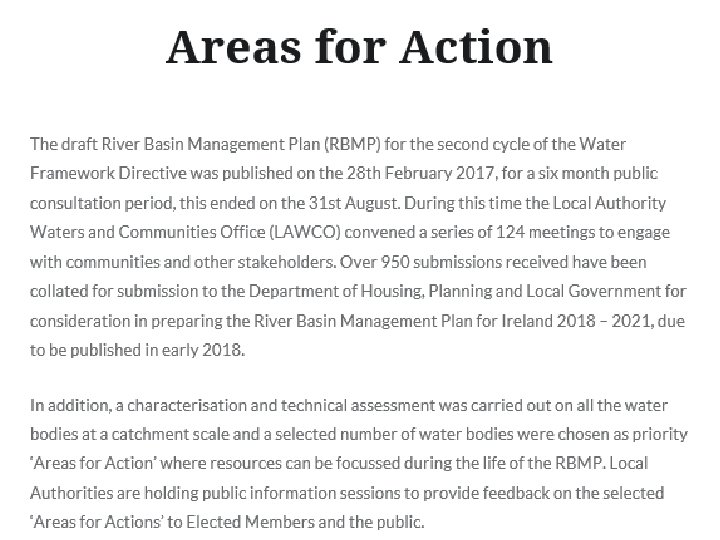
http: //watersandcommunities. ie/areas-for-action/ Farm is located here
Poor Water Quality
Pollution Impact Potential Maps (PIP Maps) • Critical sources areas (CSA’s) areas that deliver a disproportionally high amount of pollutants compared to other areas of a water body or subcatchment, and represent the areas with the highest risk of impacting a water body. In order to determine where critical source areas are located, we need to determine the hydro(geo) logical susceptibility of the water body and also the nutrient loadings applied to that water body.
Susceptibility maps – linking data on soils, subsoils, groundwater vulnerability and aquifer types with nutrient attenuation & transport factors. – phosphate along the near surface pathway, and for nitrate along the near surface and groundwater pathways. – Example of P map Suir Catchment
PIP Maps – Pollutant Impact Potential Maps • The susceptibility maps are combined with nutrient loadings data provided by DAFM and the CSO to produce Pollutant Impact Potential maps. • The darkest blue areas (PIP rank 1) are the critical sources areas (or the highest risk areas) and all areas are ranked relative to this area. • These high risk areas for phosphate to surface water coincide with poorly drained areas, meaning that in these areas phosphate is more likely to flow overland to surface waters rather than being retained in the soil and subsoil. • Similar maps are available for nitrate in surface water and groundwater.
PIP Maps – Pollutant Impact Maps
PIP Maps – Pollutant Impact Maps • Available at 1: 20, 000 will be available on NMP online • The maps act as a signpost to where there is a potential critical source area • For phosphate, point sources are more likely to be an issue in high risk areas (PIP Rank 1 -3) as these areas are likely to have a higher density of drains and ditches acting as a pathway from farmyards to water bodies • Indicator maps only and are to be used with field and farm assessments
Dairy Farm example • 55 ha’s of a spring calving dairy herd 100 cows + replacements • Rivers, sloped fields and water abstraction points = no organic manures on plots 6 A and 7 (sloped and watercourses), plot 10 CSA, plots 11 -14 (Water abstraction points, river and high OM soils) • Stocked at 205 Np. H
Organic manures plan
Drystock Farm 165 Np. H – No P Buildup
Drystock Farm 165 Np. H – Yes P Buildup
Thanks for your attention