NLC The Next Linear Collider Project Cavity BPM
")
NLC - The Next Linear Collider Project Cavity BPM studies Explore uses (and limitations) of uwave cavity BPM’s Develop nanometer resolution 10 x better than FFTB/Shintake Digital mixing / angle control Develop beam phase space monitors Tilt-meter ATF is the ideal location for these tests – very stable beam and low emittance Marc Ross

Goal – ATF Nano-BPM project • Prove that nanometer sized beams can be kept in collision – short time scales – vibration – long time scales – thermal drift • Steps: 1. Measure with nanometer resolution – design and test a BPM that has ~ 1 nanometer resolution 2. Study beam stability • study the stability of the ATF extraction line beam 3. Stabilize with active movers/sensors • Stabilize the magnets that focus the beam (they probably need it) • Stabilize the BPM itself 11. 12. 02 ISG 9 at KEK Marc Ross/SLAC Author Name Date 2 Slide #

Multi-bunch feedback – final step • There will still be some instability from the ring / extraction kicker • It may be possible to stabilize the trajectory within a long pulse train • need good – multibunch – BPM’s • ‘FONT’ experiment at NLCTA 4. Use a long extracted pulse and stabilize the back section of the train FONT = Feedback On Nanosecond Timescales 11. 12. 02 ISG 9 at KEK Marc Ross/SLAC Author Name Date 3 Slide #

Tilted bunch • Point charge offset by d • Centered, extended bunch tilted at slope d/ t • Tilt signal is in quadrature to displacement • The amplitude due to a tilt of d/ is down by a factor of: with respect to that of a displacement of d (~bunch length / Cavity Period ) Papers: CLIC – 244: “Measurements for Adjusting BNS Damping in CLIC” 17. 08. 94 W. Wuensch EPAC 2002: “Beam Tilt Signals as Emittance Diagnostic in the Next Linear Collider Main Linac” P. Tenenbaum…

Example • • Bunch length t = 200 mm/c = 0. 67 ps Tilt tolerance d = 200 nm Cavity Frequency F = 11. 424 GHz Ratio of tilt to position sensitivity ½ f t = 0. 012 A bunch tilt of 200 nm / 200 mm (1 mrad) yields as much signal as a beam offset of 0. 012 * 200 nm = 2. 4 nm Need BPM resolution of ~ 2 nm to measure this tilt Challenging! – Getting resolution – Separating tilt from position Use higher cavity frequency? Need 1 mrad tilt sensitivity for linac tuning

Angled trajectories • • A trajectory that is not parallel to the cavity axis also introduces a quadrature signal (in phase with ‘tilt’ signal) Projected ‘dipole’ sensitivity is increased by z/cavity length Relative normalized precision Beam position/beam traj angle y res/ y ~ 5% y’ res/ y’ ~ 10 x – ~ 50 d ATF z ~ 8 mm gives expected tilt resolution ~ 0. 1 mrad
 • All offsets / angles must be zero in order")
Tiltmeter plans (Dec 02) • All offsets / angles must be zero in order to have maximum sensitivity • control to correct ‘yaw’ – beam must be parallel to axis to minimize quadrature phase signal • installation of ‘beam tilter’ – cavity + drive power + synchronization (not totally necessary) • roll - yokoyure / ou ten • pitch - tateyure • yaw – katayure (? ) Dec 2 – 6, 2002 11. 12. 02 ISG 9 at KEK Marc Ross/SLAC Author Name Date 7 Slide #

Parasitic bunch • In May 02 we saw a parasitic ‘satellite’ bunch one RF bucket (1/714 MHz) later than primary bunch • Because of the large spacing, the tiltmeter will measure the angle between the two bunches • We are making a parasitic bunch detector that uses synchrotron radiation – ‘Single photon’ counter – (parasitic bunch may be very small with new gun 11. 12. 02 ISG 9 at KEK Marc Ross/SLAC Author Name Date 8 Slide #

Tiltmeter Tests 12. 02 • • Generate tilt using deflecting cavity – Cavity is unlocked so deflection will be random pulse to pulse – Some bunches will be tilted, some simply kicked Use downstream cavity BPM (MM 4 X) with I/Q detection circuit – Almost digital downconversion Calibrate position response using movers Measure beam jitter/cavity resolution combination – Tilt jitter? – Angle response 11. 12. 02 ISG 9 at KEK Marc Ross/SLAC Author Name Date 9 Slide #

MM 4 X Cavity BPM position/angle controls Top to bottom (6 movers for 4 degrees of freedom): x stage y stage z stage for orthogonalizing pitch x stage for orthogonalizing yaw Rotary table (yaw) Pitch ‘tilter’

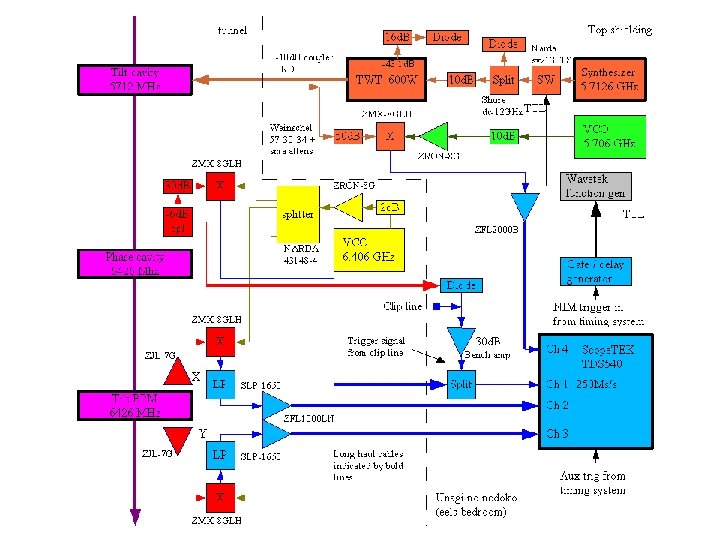
C-band deflection cavity
 • 600 W")
C-band RF at ATF! • CW TWT amplifier (use pulse only) • 600 W nom – 1 k. W measured • On loan from C-band group 11. 12. 02 ISG 9 at KEK Marc Ross/SLAC Author Name Date 12 Slide #

Pill box cavity design • Rectangular pillbox standing wave cavity with off-axis beam pipe • Estimated kick about 5 k. V • Measured kick about 10 KV peak/peak with 600 W input power • Installed 700 mm downstream of QD 7 X 11. 12. 02 ISG 9 at KEK Marc Ross/SLAC Author Name Date 13 Slide #

Typical cavity signal 11. 12. 02 ISG 9 at KEK Marc Ross/SLAC Author Name Date 15 Slide #

Calibration using mover Typical response: 30 m. V/micron Measured circuit noise: 300 u. V Estimated resolution: 10 nm To be tested using 3 BPM’s in 03. 03 11. 12. 02 ISG 9 at KEK Marc Ross/SLAC Author Name Date 16 Slide #

Deflection cavity on • • I/Q cavity response with deflection cavity at full voltage Axes show directions of pure displacement (black) and pure angle (bluish) (green is 90 from pure displacement) – Tilter motion is not quite orthogonal Ellipticity is the ellipse aspect ratio (jiyouou) This plot shows equivalent ‘angle trajectory’ 11. 12. 02 ISG 9 at KEK Marc Ross/SLAC Author Name Date 17 Slide #

• • Comparison – 3. 5 Effective beam tilt scale ‘full width dipole projection’ and. 4 m. A is 0. 9 of displacement for 8 mm bunch (scales with bunch length) See 29 um peak to peak kick at full I and 20 um projected dipole at monitor – Good vertical streak of 7 um beam! – Tilt angle 20 um/8 mm = 2. 5 mrad Preliminary result ellipticity 3. 5 m. A 21 um dipole 29 um 0. 4 m. A 14 um dipole 25 um
 • Ellipse min/max vs bunch length")
Estimate of bunch length from ellipticity Ellipticity (da-en) • Ellipse min/max vs bunch length (mm) for C-band • Only length scale used is RF wavelength 11. 12. 02 ISG 9 at KEK Marc Ross/SLAC ATF bunch length range mm Author Name Date 19 Slide #

Summary of bunch length measurements • First bunch length measurement made entirely using RF cavities • Beam/monitor jitter ~ 1 um (very stable over hours!) Preliminary result • Beam/monitor tilt jitter ~ 1 um surprisingly large 11. 12. 02 ISG 9 at KEK Marc Ross/SLAC Author Name Date 20 Slide #
 Nano-BPM test – ATF extraction line • • • Mechanically connect several BPM’s")
1) Nano-BPM test – ATF extraction line • • • Mechanically connect several BPM’s (4 – 5? ) Must control cavity position and angle Electronics similar to tiltmeter – optimized for best possible resolution ATF ext line (BINP) – 250 nm FFTB (Shintake) – 25 nm Joe Frisch, Steve Smith, T. Shintake
 Cavity properties: • For 1010 Electrons, single bunch (assumed")
C-band BPM limiting resolution (Vogel/BINP) Cavity properties: • For 1010 Electrons, single bunch (assumed short compared to C-band). • Assume cavity time constant of 100 nanoseconds (1. 6 MHz bandwidth) (guess) • Assume beta >> 1 for cavity. (All power is coupled out). • Thermal noise energy is k. T or 4 x 10 -21 • Thermal noise position (ideal) = 0. 4 nm • Signal: • A 1 nm offset deposits 2. 4 x 10 -20 J in the cavity. • Output power for 1 nm offset is 2. 4 x 10¹³ Watt. • Output power for 1 cm offset (cavity aperture? ) is ~25 Watts (maximum single bunch) • Output power for 10 bunch train can be 2500 Watts! (Need to terminate for multi-bunch operation) Note that deposited energy goes as offset^2 and as beam charge ^2. 11. 12. 02 ISG 9 at KEK Marc Ross/SLAC Author Name Date 22 Slide #

Electronics, Noise and Dynamic range • • • Thermal noise = -168 d. Bm/Hz. Assume signal loss before amplifier = 3 d. B. 1. 2 x 10 -13 Watt = -99 d. Bm Signal power after amplifier for 1 nm offset = -79 d. Bm Dynamic range at amplifier output = 91 d. B, or ~35, 000: 1 position, or 25 microns. – Assume maximum signal into mixer (13 d. Bm LO) = ~8 d. Bm. (Joe thinks this should be ~0 d. Bm) – Full range (1 d. B compression): 8 d. Bm into mixer – (Note: for good linearity, probably want – 20 d. Bm into mixer, or ~1 micron range) Mixer conversion loss ~8 d. B. Maximum output = 0 d. Bm 11. 12. 02 • Front end broad band amplifier – 20 d. B – Assume noise figure = 3 d. B (better available) = -165 d. Bm/Hz input noise. – Front end amplifier bandwidth = 10 GHz -> -65 d. Bm noise input. – Front end gain = 20 d. B -> -45 d. Bm noise power output (OK). • IF amplifier – 30 d. B – Final bandwidth = 1. 6 MHz. Noise in band power after amplifier = -83 d. Bm ISG 9 at KEK Marc Ross/SLAC Author Name Date 23 Slide #

Equipment • Cavities - assume existing C band BPMs • Filters: Approximately Q=10 to help limiter. May not need if fast limiter is available. • Limiters: Available from Advanced Control. 100 W peak input, Limit to about 15 d. Bm output. Try ACLM-4700 F feedback limiter 0. 8 d. B loss, 100 W max pulse input, 13. 5 d. Bm max output. Unknown speed. Also see ACLM-47000 0. 7 d. B loss, 100 W input, 20 d. Bm max output. • Amplifier: Available from Hittite with ~3 d. B noise figure. Stage to get ~30 d. B Gain. NOTE: need to find an amplifier which can survive the 15 d. Bm output from the limiter. Hittite parts seem to only handle 5 d. Bm. (Maybe OK pulsed? ) Amplifiers available from Miteq ($$$? ) with 0. 8 d. B noise figure and 20 d. Bm allowable input power: JS 2 -02000800 -08 -0 A (for future upgrade). • Mixer: Use Hittite Ga. As parts - likely to be radiation resistant. • IF amplifier. 30 d. B gain, 0. 1 -50 MHz. Various options from Mini Circuits or Analog modules. Need Noise Figure << 10 d. B. > 2 V p-p swing.
 units from 8")
Support electronic equipment / software • Digitizer: Use spare SIS (VME) units from 8 -pack LLRF system. Each is 100 Ms/s, 12 bit, +/-1 V (? ) input signal. • C-band source: Use existing ATF synthesizer. Does not need to be locked. • C-band distribution amplifier. Need to drive 8 x 13 d. Bm references. Approximately 25 d. Bm output (including losses). Use existing ZVE-8 G amplifier (purchased for tiltmeter • work). • C-band distribution splitter: 1: 8 splitter. Probably exists, otherwise minicircuits. • Control System: Use existing 68040 controller and existing crate. Linda thinks it is easy to interface this to Matlab on a PC for data analysis. • Matlab software: Use modified version of tiltmeter software. Digitizes decaying signal from cavity BPMs and reference signal, with stripline BPM as time reference. Does not require phase locked reference, or good frequency match between cavities.
. May")
Mechanical • X/Y Tilt Stage: Check Newport U 400 mirror mounts (~$300 each). May be strong enough to move cavity. • X/Y Tilt stage drive: Use picomotors (~$450/channel motor + ~300/channel for driver), or steppers (? ? /channel). Steppers would provide position read back. • X/Y translation stage: Use existing stages. 11. 12. 02 ISG 9 at KEK Marc Ross/SLAC Author Name Date 26 Slide #

Mechanics • Mechanical Issues • The ATF beam has a position jitter of ~1 micron. In order to demonstrate 1 nm bpm resolution, we need to do line fits between 3 (or more) bpms. This requires a position stability for these bpms of <1 nm for several pulses (10 -30 seconds). • For bpms spaced by meters, the ground motion and vibration will be substantially larger than this, probably hundreds of nanometers. For the final measurement the bpms must be mounted from a common reference block. That reference block must be on supports which are sufficiently soft to not transmit vibrations which can excite internal modes in the block, probably a 10 Hz mechanical support frequency is reasonable. • Thermal expansion of metals is ~2 x 10 -5/C. For a 30 cm scale length, this requires temperature stability of 2 x 10 -4 C in a measurement time (~1 minute). With insulation and in the controlled ATF environment this may be possible. Use if Invar or a similar low expansion mounting frame may provide a factor of 10 relaxation in this requirement. (Not more, since it is impractical to make to cavities or cavity mounts out of Invar. • If the temperature requirements cannot be met, an interferometer (or "queensgate" style capacitive system) will need to be used relative to an Invar or Zerodur reference block.
 Study beam stability – pulse to pulse and long term – using")
Plan 2) Study beam stability – pulse to pulse and long term – using nano. BPM Assume that the ATF beam is not stable at the nanometer level and cannot be made stable 3) Use the FONT feedback on a long multi-bunch train (coll with UK group) requires: 1. increasing the bandwidth of the nano BPM to ~20 MHz (from 1. 5 MHz) 2. Extra long trains – lengthen the train by extracting 3 trains that were injected in a sequence 3. Installation of the FONT feedback kicker and sampler • Can we stabilize the back section to the nanometer level? 11. 12. 02 ISG 9 at KEK Marc Ross/SLAC Author Name Date 28 Slide #
- Slides: 28