
Nitrogen Loss from Urea Fertilizer Applications on Hot


- Slides: 20
Nitrogen Loss from Urea Fertilizer Applications on Hot, Dry Soils R. W. Mullen, G. V. Johnson, K. W. Freeman, K. J. Wynn, W. E. Thomason, and W. R. Raun Oklahoma State University Department of Plant and Soil Sciences
Introduction § Urea is the most widely used solid fertilizer N source in the world; 23, 610, 991 Mt used for cereal production in 1998 (www. FAO. org). § Volatilization losses from surface applications of urea-based fertilizers are thought to occur in sizeable quantities (Ernst and Massey, 1960; Fenn and Hossner, 1985).
Introduction § Urea fertilizers must be hydrolyzed by the enzyme urease before urea-N becomes plant available. § Increases in urease activity can result in more N loss due to volatilization. § Urease activity is moisture and temperature dependent.
Introduction § Urea hydrolysis is maximized when moisture levels are optimum for plant growth (Havlin et al. , 1999). § Volk (1966) reported that 14 d after application of prilled urea to air-dry soil 80% had not been hydrolyzed. § Mc. Innes et al. (1986) found hydrolysis was minimal following urea application to dry soil, but following wetting, urea hydrolysis increased.
Introduction § Urease activity has been observed from 2ºC to 37ºC (Havlin et al. , 1999). § Urease activity is positively correlated with temperature (Clay et al. , 1990) § Fisher and Parks (1958) found that hydrolysis was 50 and 85% complete at temperatures 10 and 20ºC, respectively, two weeks after urea application.
Introduction § Mechanical incorporation of urea fertilizers can effectively decrease N-loss due to volatilization. § Increased soil surface area to absorb released NH 3 (Havlin et al. , 1999). § Palma et al. (1998) reported N-loss decreased from 8. 6% to 5. 4% when urea was incorporated.
Introduction § Rainfall or irrigation can result in subsurface incorporation thus minimizing volatilization losses. § Significant precipitation (>. 25 cm) 3 to 6 d after application can efficiently reduce volatilization losses (Havlin et al. , 1999).
Objectives § To determine decreases in winter wheat yield which could be attributed directly to N-loss via volatilization. § To determine the effect of surface application or incorporation on winter wheat N uptake.
Materials and Methods § Two experimental sites: § Stillwater and Tipton, OK § Experimental design: RCBD § Eight treatments with three replications § Three N sources both surface applied and incorporated and one injected source § Urea (46 -0 -0), Urea ammonium nitrate (AN; 28 -0 -0), and ammonium nitrate (AN; 34 -0 -0) § AA (82 -0 -0)
Materials and Methods § All N was applied at a 112 kg N ha-1 rate. § Urea and AN were applied using conventional dryfertilizer spreader. § UAN was broadcast applied using spray applicator. § AA was injected 15 cm below soil surface using custom built applicator. § Incorporated treatments received a 15 -cm tillage pass.
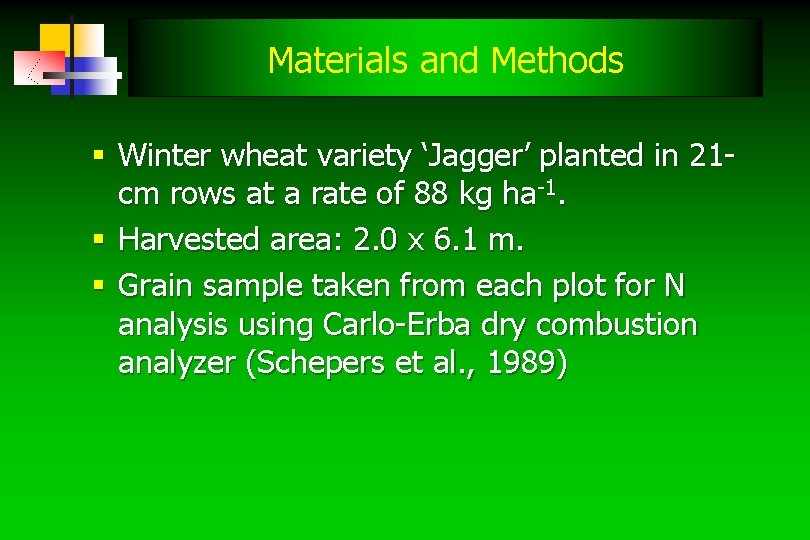
Materials and Methods § Winter wheat variety ‘Jagger’ planted in 21 cm rows at a rate of 88 kg ha-1. § Harvested area: 2. 0 x 6. 1 m. § Grain sample taken from each plot for N analysis using Carlo-Erba dry combustion analyzer (Schepers et al. , 1989)
Results and Discussion § 1998 -1999 Yield response at Stillwater Yield kg ha-1 SED=266 N Source
Results and Discussion N Uptake kg ha-1 § 1998 -1999 N uptake at Stillwater SED=8. 1 N Source
Results and Discussion § 1998 -1999 Yield response at Tipton Yield kg ha-1 SED=320 N Source
Results and Discussion N Uptake kg ha-1 § 1998 -1999 N uptake at Tipton SED=8. 2 N Source
Results and Discussion § 1999 -2000 Yield response at Stillwater Yield kg ha-1 SED=238 N Source
Results and Discussion N Uptake kg ha-1 § 1999 -2000 N uptake at Stillwater SED=9. 1 N Source
Results and Discussion § 1999 -2000 Yield response at Tipton Yield kg ha-1 SED=296 N Source
Results and Discussion N Uptake kg ha-1 § 1999 -2000 N uptake at Tipton SED=6. 6 N Source
Conclusions § Incorporation of urea fertilizers tended to increase yields when compared to surface applications. § Losses due to volatilization may have been depressed due to rainfall within a week of fertilizer application in both years.