
Nitrification and Denitrification Prepared by Michigan Department of
Nitrification and Denitrification Prepared by Michigan Department of Environmental Quality Operator Training and Certification Unit
Nitrogen Environmental And Public Health Concerns
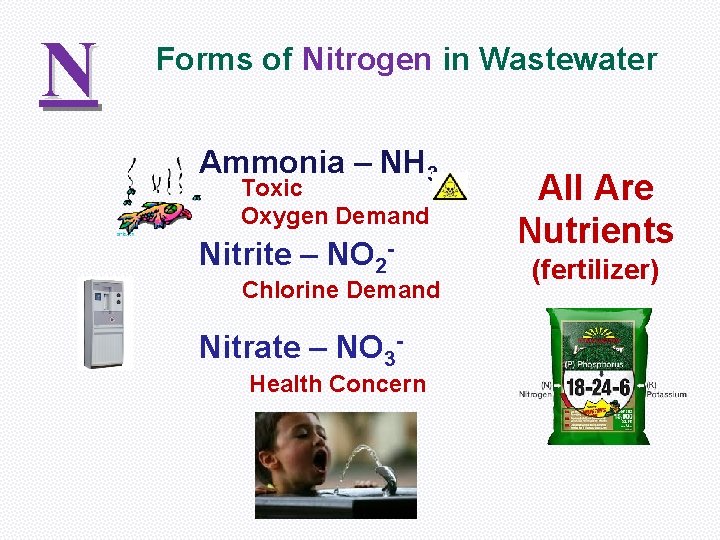
N Forms of Nitrogen in Wastewater Ammonia – NH 3 Toxic Oxygen Demand Nitrite – NO 2 - Chlorine Demand Nitrate – NO 3 Health Concern All Are Nutrients (fertilizer)
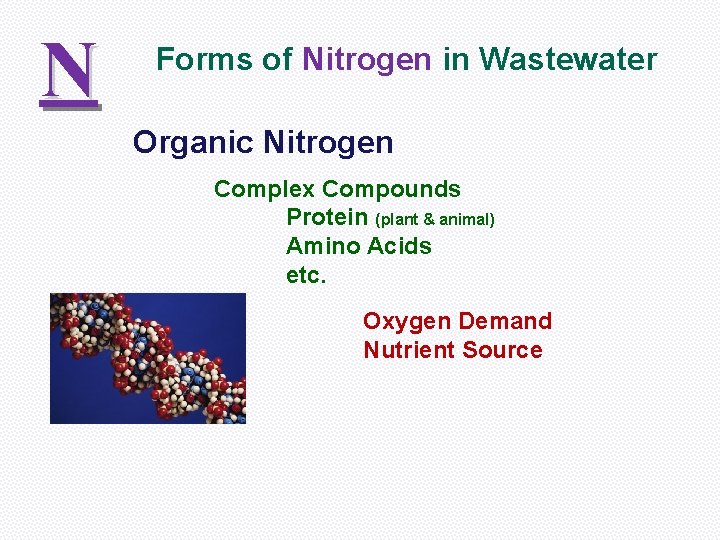
N Forms of Nitrogen in Wastewater Organic Nitrogen Complex Compounds Protein (plant & animal) Amino Acids etc. Oxygen Demand Nutrient Source

N Forms of Nitrogen in Wastewater Total Kjeldahl Nitrogen - “TKN” Sum of Organic N + Ammonia Total Inorganic Nitrogen - “TIN” Sum of Ammonia + Nitrite + Nitrate
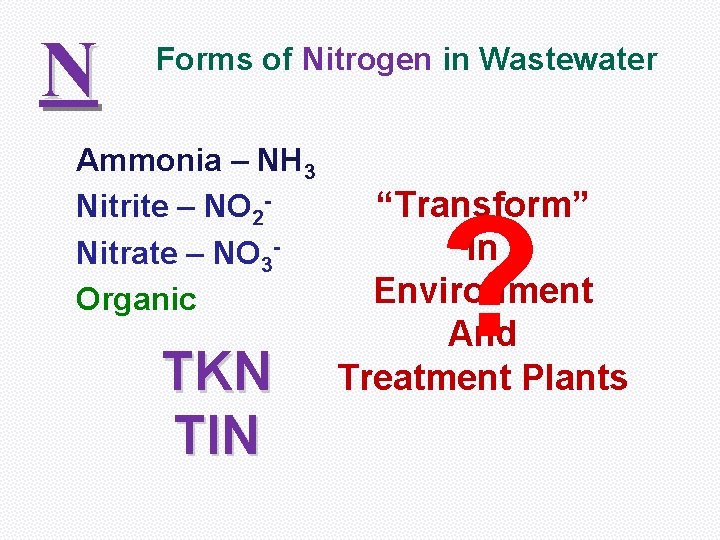
N Forms of Nitrogen in Wastewater Ammonia – NH 3 Nitrite – NO 2 Nitrate – NO 3 Organic TKN TIN “Transform” In Environment And Treatment Plants ?
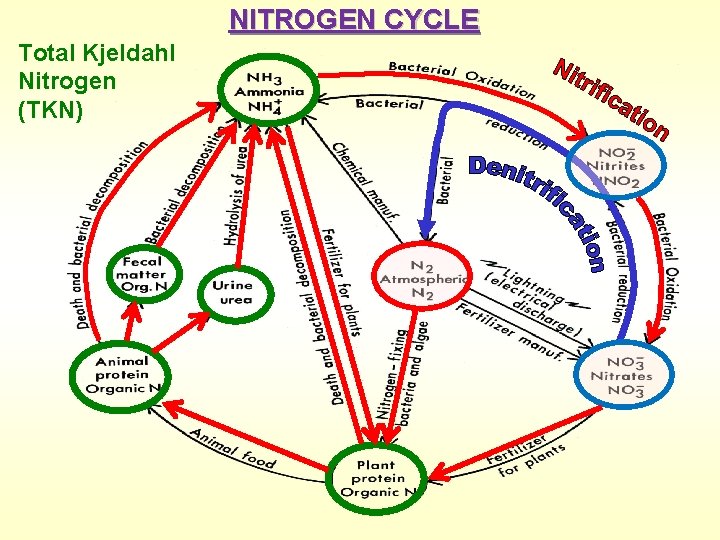
NITROGEN CYCLE Total Kjeldahl Nitrogen (TKN)
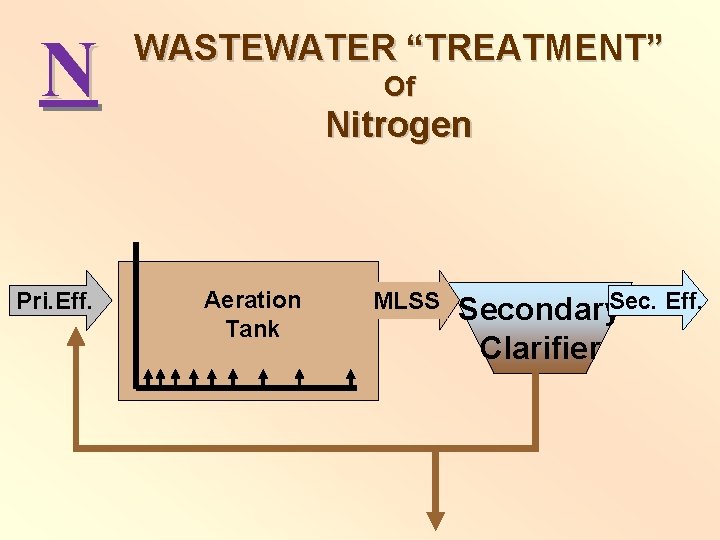
N Pri. Eff. WASTEWATER “TREATMENT” Of Nitrogen Aeration Tank MLSS Secondary. Sec. Eff. Clarifier
N WASTEWATER “TREATMENT” Of Nitrogen “Raw” Sewage Organic Nitrogen & Ammonia No Nitrite or Nitrate
N WASTEWATER “TREATMENT” Of Nitrogen Primary Clarification Some Organic Nitrogen Removed (settled solids) No Ammonia Removed May Increase (Solids Handling)
N WASTEWATER “TREATMENT” Of Nitrogen Primary Effluent (Secondary Influent) Organic Nitrogen (Less) Ammonia
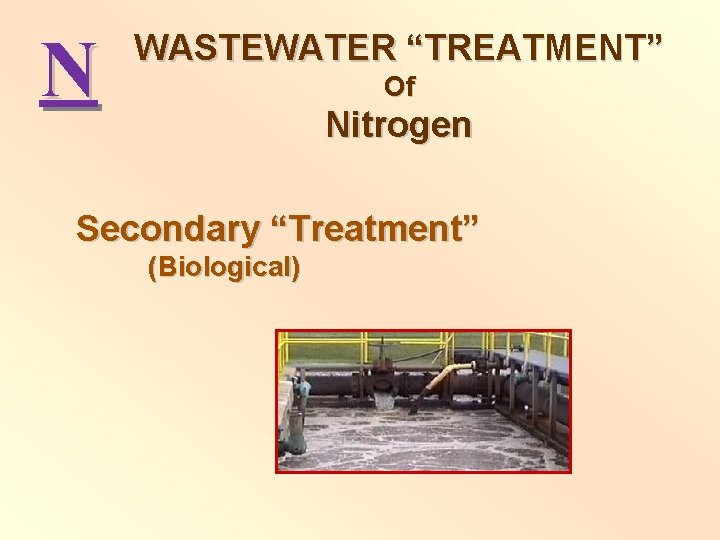
N WASTEWATER “TREATMENT” Of Nitrogen Secondary “Treatment” (Biological)
N Some Nitrogen Will be Removed By the Biomass (assimilation) Heterotrophic Bacteria Breakdown Organics (Proteins, etc. ) To Ammonia Bacteria Also Take Up Ammonia 100 : 5 : 1 C: N: P
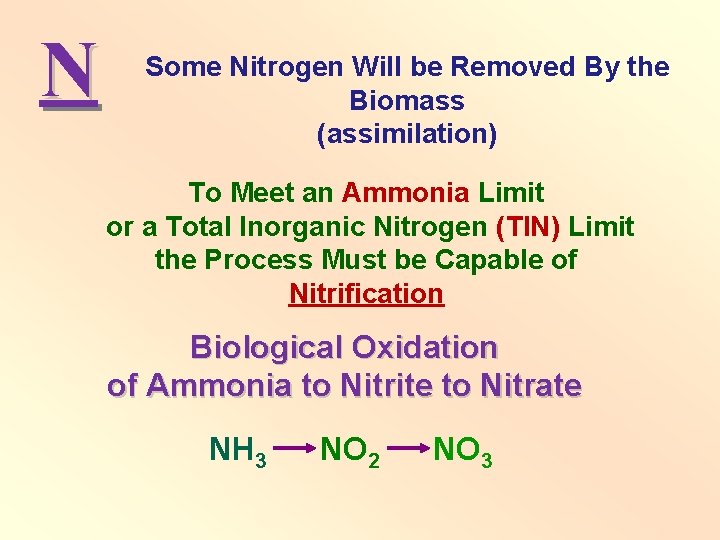
N Some Nitrogen Will be Removed By the Biomass (assimilation) To Meet an Ammonia Limit or a Total Inorganic Nitrogen (TIN) Limit the Process Must be Capable of Nitrification Biological Oxidation of Ammonia to Nitrite to Nitrate NH 3 NO 2 NO 3
Nitrification *Heterotrophic Bacteria Break Down Organics Generate NH 3, CO 2, and H 2 O *Autotrophic Bacteria Utilize Inorganic Compounds (and CO 2 as a Carbon Source)
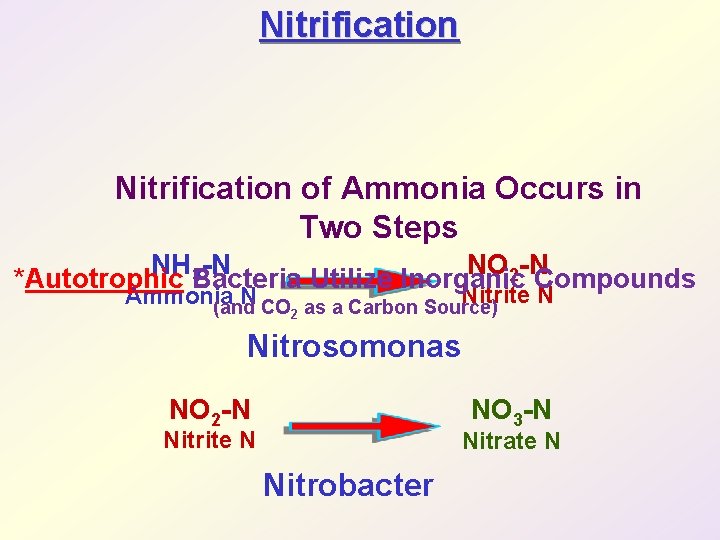
Nitrification of Ammonia Occurs in Two Steps NO 2 -N NH 3 -N *Autotrophic Bacteria Utilize Inorganic Compounds Nitrite N Ammonia N (and CO 2 as a Carbon Source) Nitrosomonas NO 2 -N NO 3 -N Nitrite N Nitrate N Nitrobacter
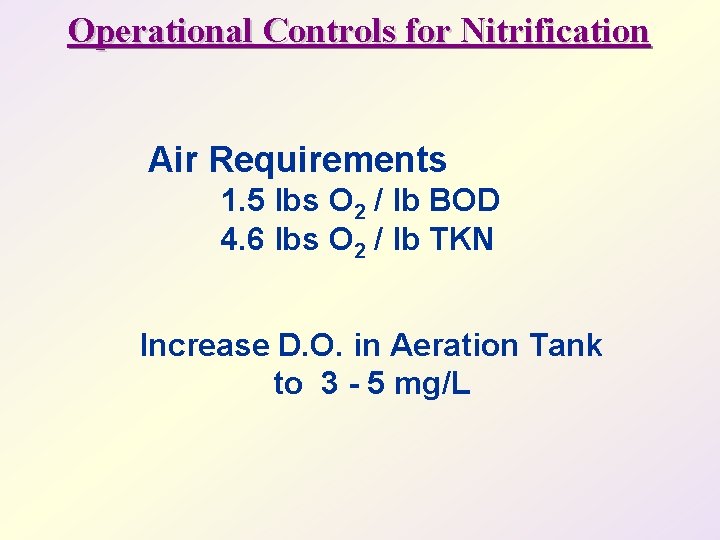
Operational Controls for Nitrification Air Requirements 1. 5 lbs O 2 / lb BOD 4. 6 lbs O 2 / lb TKN Increase D. O. in Aeration Tank to 3 - 5 mg/L
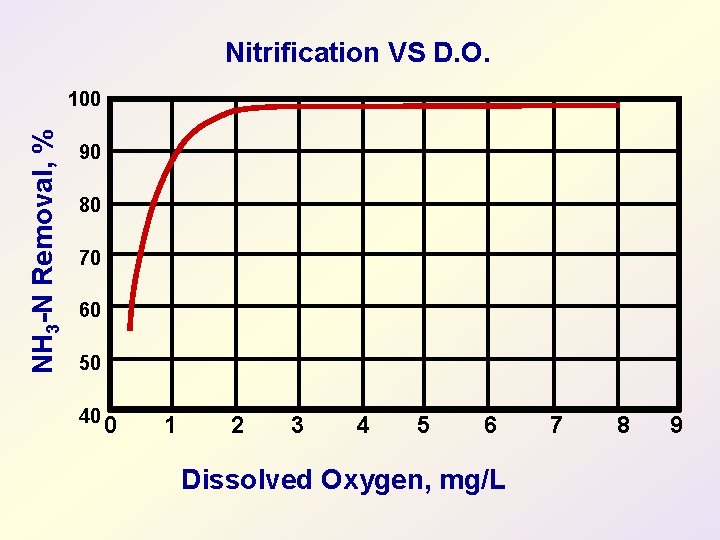
Nitrification VS D. O. NH 3 -N Removal, % 100 90 80 70 60 50 40 0 1 2 3 4 5 6 Dissolved Oxygen, mg/L 7 8 9
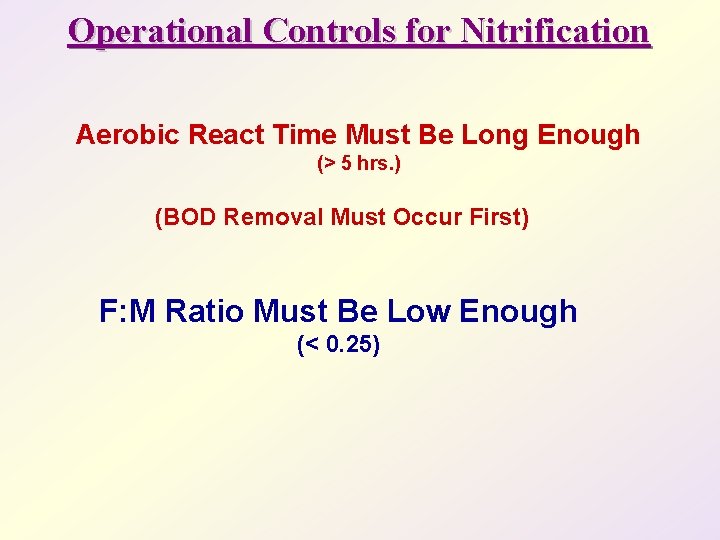
Operational Controls for Nitrification Aerobic React Time Must Be Long Enough (> 5 hrs. ) (BOD Removal Must Occur First) F: M Ratio Must Be Low Enough (< 0. 25)
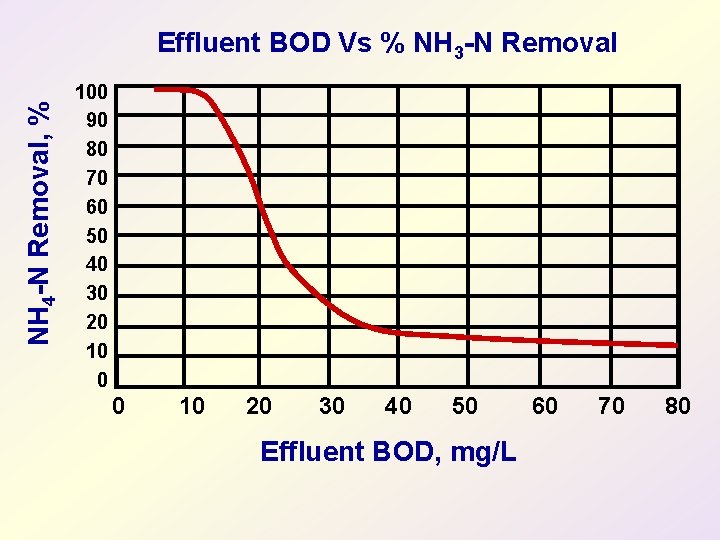
NH 4 -N Removal, % Effluent BOD Vs % NH 3 -N Removal 100 90 80 70 60 50 40 30 20 10 0 0 10 20 30 40 50 Effluent BOD, mg/L 60 70 80
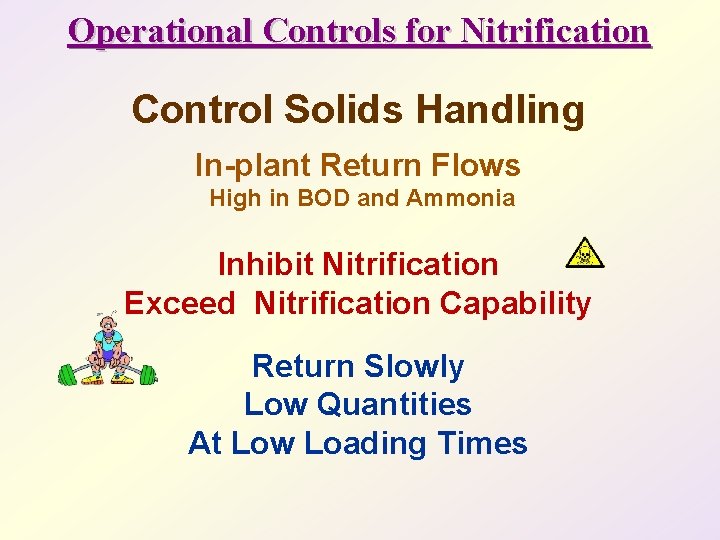
Operational Controls for Nitrification Control Solids Handling In-plant Return Flows High in BOD and Ammonia Inhibit Nitrification Exceed Nitrification Capability Return Slowly Low Quantities At Low Loading Times
Operational Controls for Nitrification Nitrifiers Grow Slowly CRT Must Be Long Enough > 5 Days (minimum) Best > 8 Days
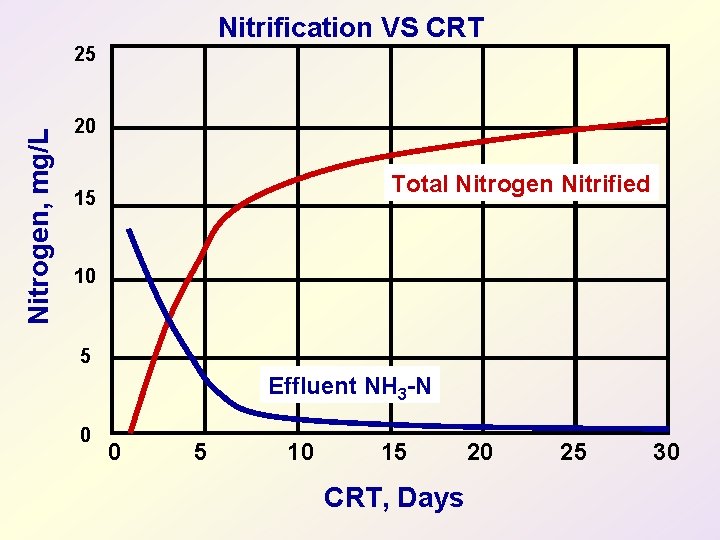
Nitrification VS CRT Nitrogen, mg/L 25 20 Total Nitrogen Nitrified 15 10 5 Effluent NH 3 -N 0 0 5 10 15 CRT, Days 20 25 30
Effect of Temperature on Nitrification Lower Temperatures Cause Slower Nitrifier Growth Rate
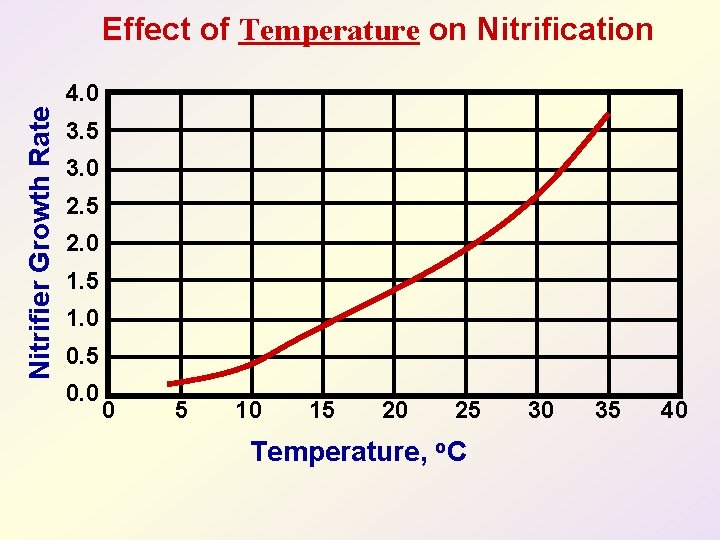
Nitrifier Growth Rate Effect of Temperature on Nitrification 4. 0 3. 5 3. 0 2. 5 2. 0 1. 5 1. 0 0. 5 0. 0 0 5 10 15 20 25 Temperature, o. C 30 35 40
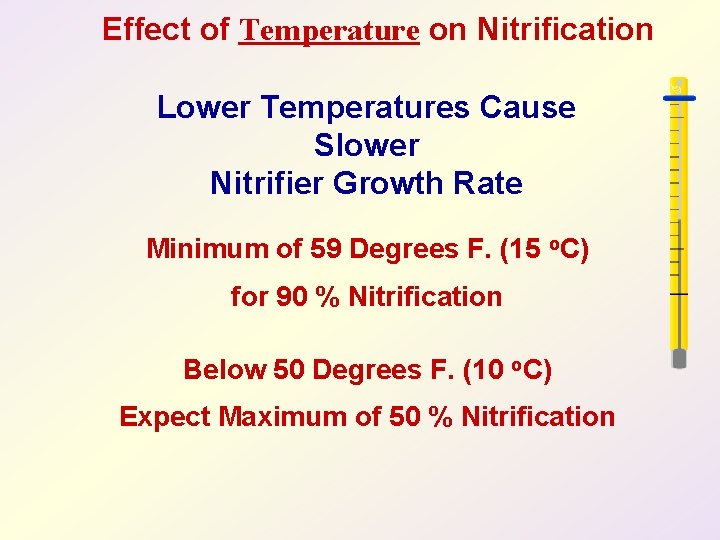
Effect of Temperature on Nitrification Lower Temperatures Cause Slower Nitrifier Growth Rate Minimum of 59 Degrees F. (15 o. C) for 90 % Nitrification Below 50 Degrees F. (10 o. C) Expect Maximum of 50 % Nitrification
Effect of Temperature on Nitrification Lower Temperatures Cause Slower Nitrifier Growth Rate Higher MLSS Concentration May Compensate for Lower Temperature Limited By: Oxygen Transfer Maximum MLSS Controllable High CRT Problems
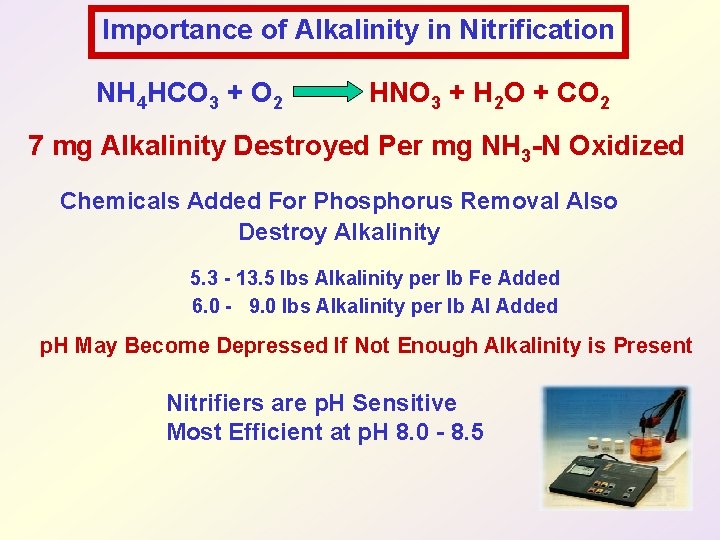
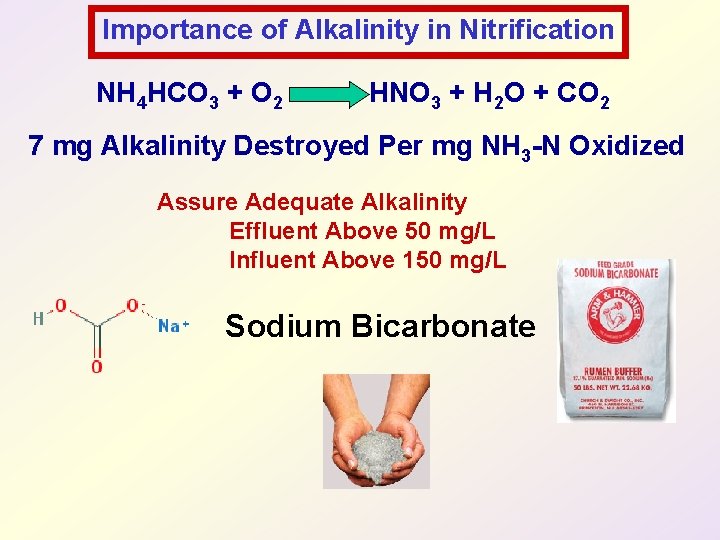
Importance of Alkalinity in Nitrification NH 4 HCO 3 + O 2 HNO 3 + H 2 O + CO 2 7 mg Alkalinity Destroyed Per mg NH 3 -N Oxidized Chemicals Added For Phosphorus Removal Also Destroy Alkalinity 5. 3 - 13. 5 lbs Alkalinity per lb Fe Added 6. 0 - 9. 0 lbs Alkalinity per lb Al Added p. H May Become Depressed If Not Enough Alkalinity is Present Nitrifiers are p. H Sensitive Most Efficient at p. H 8. 0 - 8. 5
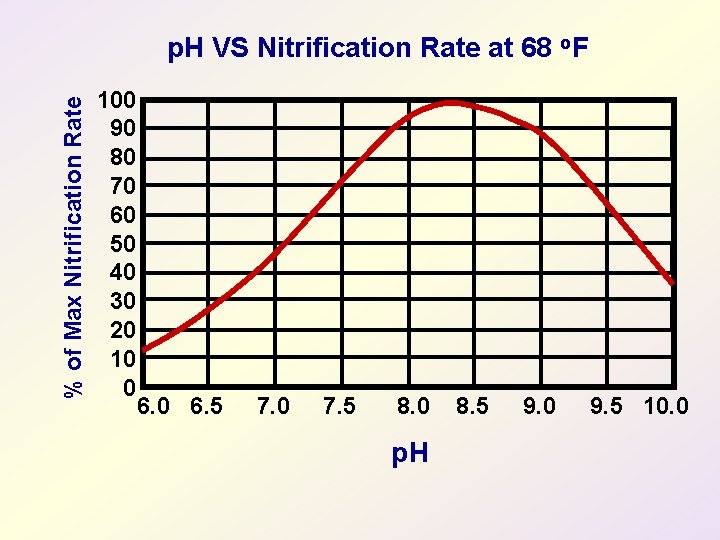
% of Max Nitrification Rate p. H VS Nitrification Rate at 68 o. F 100 90 80 70 60 50 40 30 20 10 0 6. 5 7. 0 7. 5 8. 0 p. H 8. 5 9. 0 9. 5 10. 0
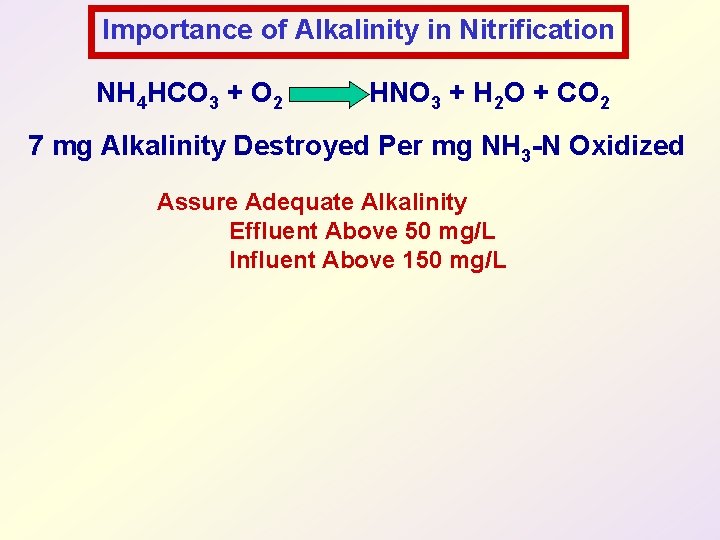
Importance of Alkalinity in Nitrification NH 4 HCO 3 + O 2 HNO 3 + H 2 O + CO 2 7 mg Alkalinity Destroyed Per mg NH 3 -N Oxidized Assure Adequate Alkalinity Effluent Above 50 mg/L Influent Above 150 mg/L
Importance of Alkalinity in Nitrification NH 4 HCO 3 + O 2 HNO 3 + H 2 O + CO 2 7 mg Alkalinity Destroyed Per mg NH 3 -N Oxidized Assure Adequate Alkalinity Effluent Above 50 mg/L Influent Above 150 mg/L
Importance of Alkalinity in Nitrification NH 4 HCO 3 + O 2 HNO 3 + H 2 O + CO 2 7 mg Alkalinity Destroyed Per mg NH 3 -N Oxidized Assure Adequate Alkalinity Effluent Above 50 mg/L Influent Above 150 mg/L Sodium Bicarbonate
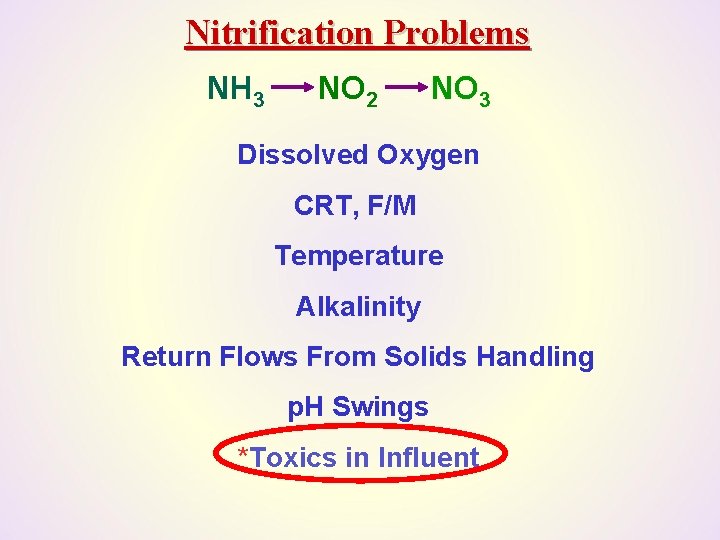
Nitrification Problems NH 3 NO 2 NO 3 Dissolved Oxygen CRT, F/M Temperature Alkalinity Return Flows From Solids Handling p. H Swings *Toxics in Influent
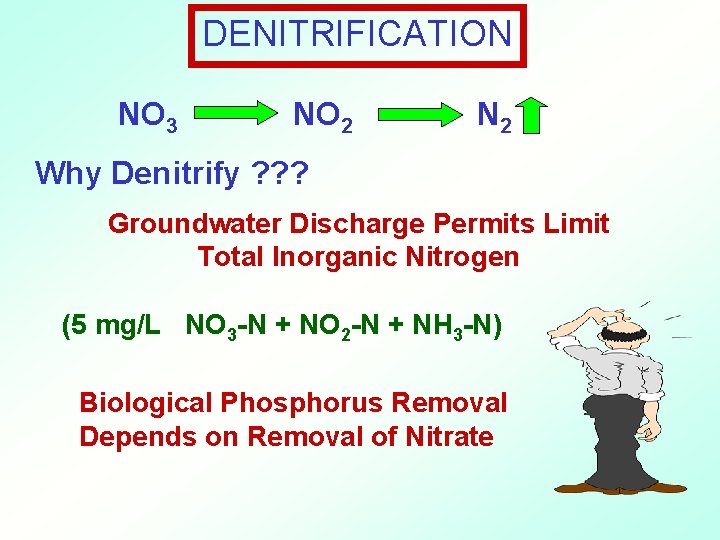
DENITRIFICATION NO 3 NO 2 N 2 Why Denitrify ? ? ? Groundwater Discharge Permits Limit Total Inorganic Nitrogen (5 mg/L NO 3 -N + NO 2 -N + NH 3 -N) Biological Phosphorus Removal Depends on Removal of Nitrate
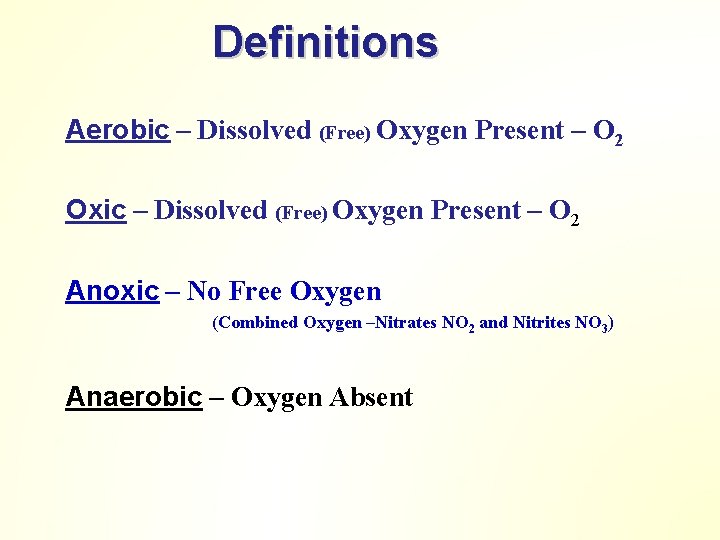
Definitions Aerobic – Dissolved (Free) Oxygen Present – O 2 Oxic – Dissolved (Free) Oxygen Present – O 2 Anoxic – No Free Oxygen (Combined Oxygen –Nitrates NO 2 and Nitrites NO 3) Anaerobic – Oxygen Absent
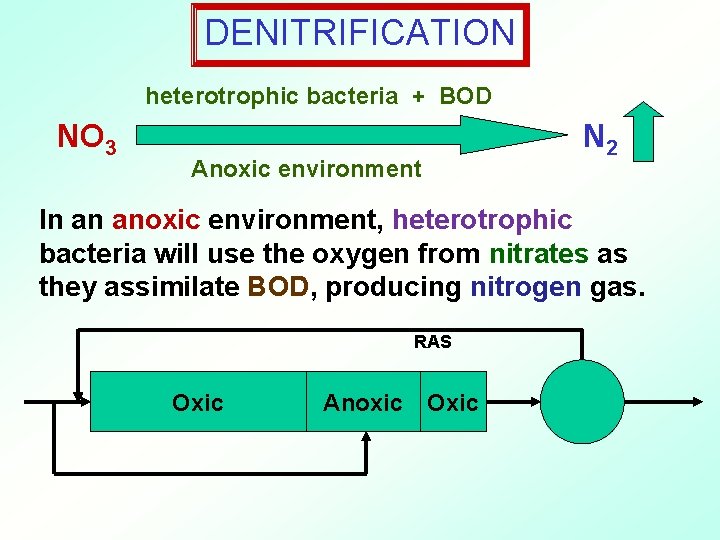
DENITRIFICATION heterotrophic bacteria + BOD NO 3 N 2 Anoxic environment In an anoxic environment, heterotrophic bacteria will use the oxygen from nitrates as they assimilate BOD, producing nitrogen gas. RAS Oxic Anoxic Oxic
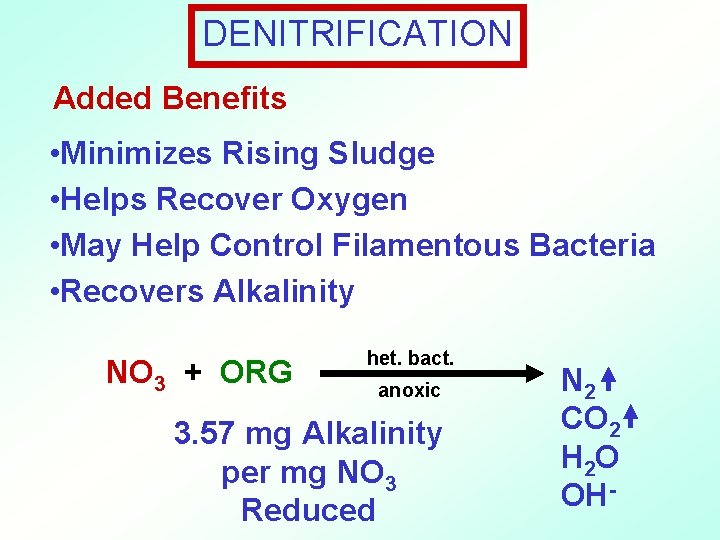
DENITRIFICATION Added Benefits • Minimizes Rising Sludge • Helps Recover Oxygen • May Help Control Filamentous Bacteria • Recovers Alkalinity NO 3 + ORG het. bact. anoxic 3. 57 mg Alkalinity per mg NO 3 Reduced N 2 CO 2 H 2 O OH-
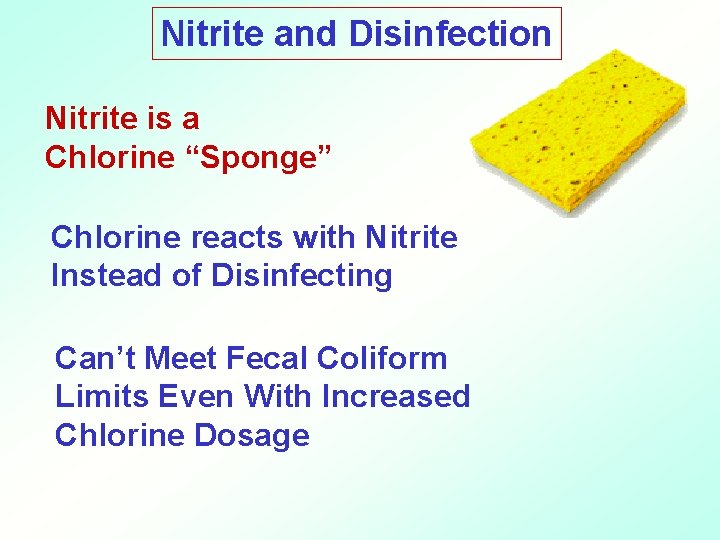
Nitrite and Disinfection Nitrite is a Chlorine “Sponge” Chlorine reacts with Nitrite Instead of Disinfecting Can’t Meet Fecal Coliform Limits Even With Increased Chlorine Dosage
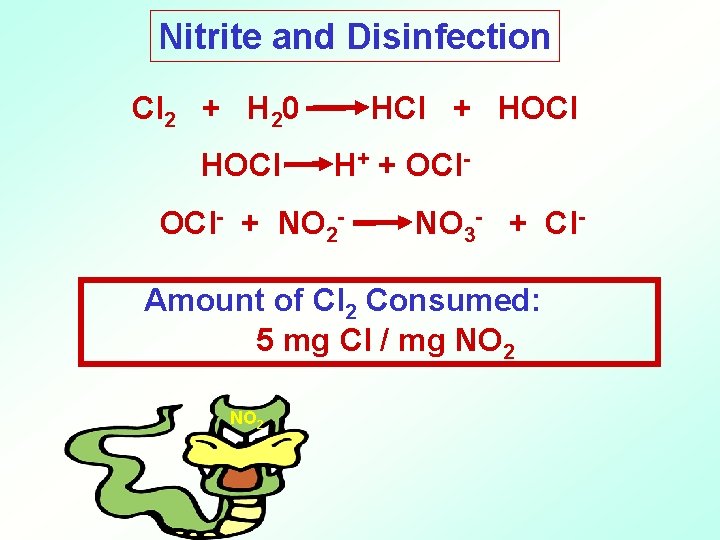
Nitrite and Disinfection Cl 2 + H 20 HOCl HCl + HOCl H+ + OCl- + NO 2 - NO 3 - + Cl- Amount of Cl 2 Consumed: 5 mg Cl / mg NO 2
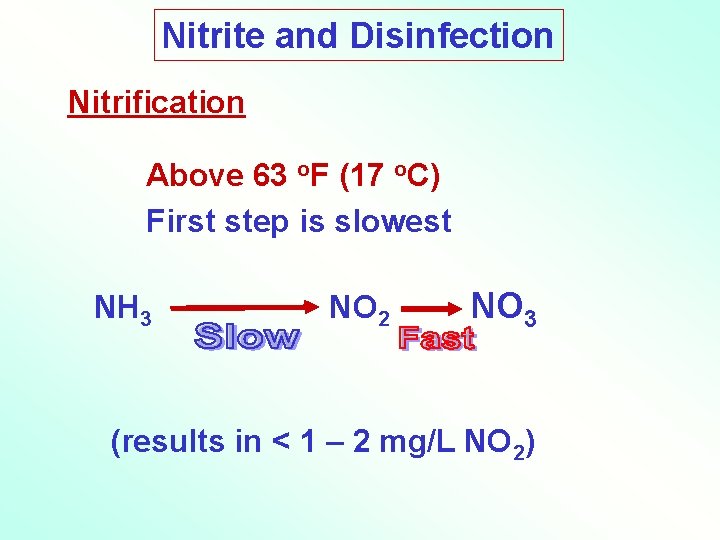
Nitrite and Disinfection Nitrification Above 63 o. F (17 o. C) First step is slowest NH 3 NO 2 NO 3 (results in < 1 – 2 mg/L NO 2)
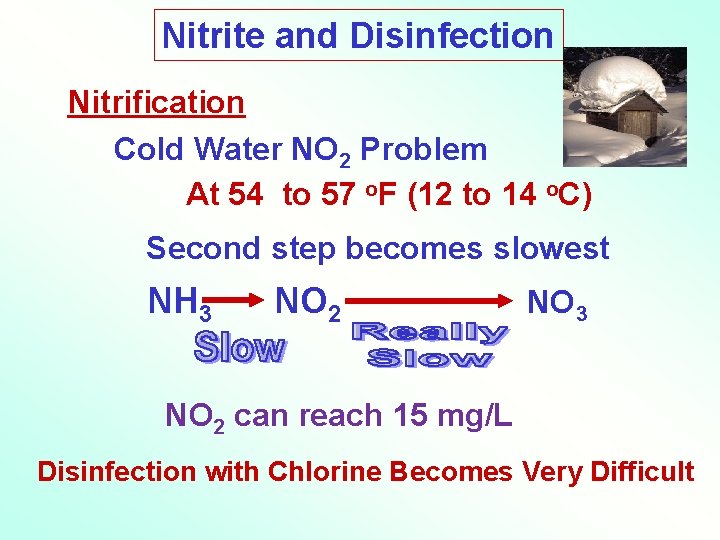
Nitrite and Disinfection Nitrification Cold Water NO 2 Problem At 54 to 57 o. F (12 to 14 o. C) Second step becomes slowest NH 3 NO 2 NO 3 NO 2 can reach 15 mg/L Disinfection with Chlorine Becomes Very Difficult
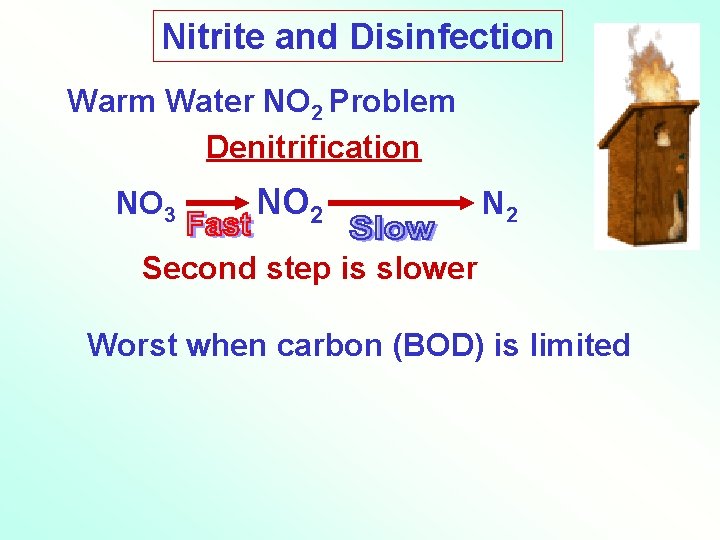
Nitrite and Disinfection Warm Water NO 2 Problem Denitrification NO 3 NO 2 N 2 Second step is slower Worst when carbon (BOD) is limited
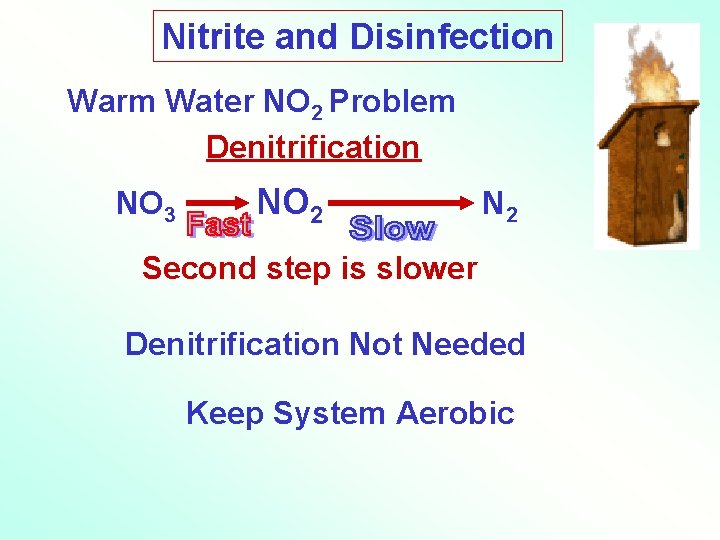
Nitrite and Disinfection Warm Water NO 2 Problem Denitrification NO 3 NO 2 N 2 Second step is slower Denitrification Not Needed Keep System Aerobic
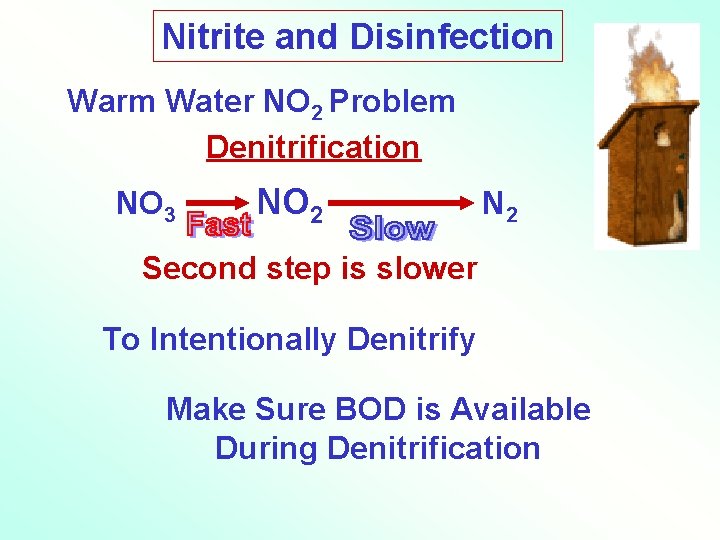
Nitrite and Disinfection Warm Water NO 2 Problem Denitrification NO 3 NO 2 N 2 Second step is slower To Intentionally Denitrify Make Sure BOD is Available During Denitrification
Nitrite and Disinfection Toxicity Nitrifiers are more affected than other bacteria Some toxins affect the Nitrobacter more than the Nitrosomonas Results in a build-up of NO 2
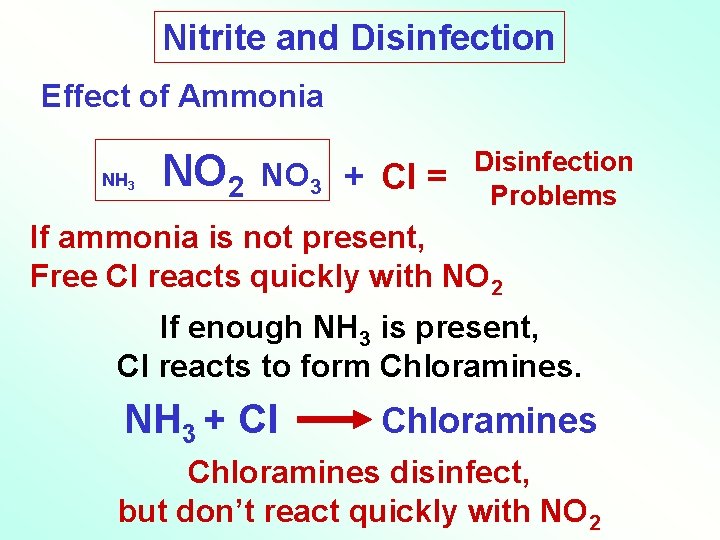
Nitrite and Disinfection Effect of Ammonia NH 3 NO 2 NO 3 + Cl = Disinfection Problems If ammonia is not present, Free Cl reacts quickly with NO 2 If enough NH 3 is present, Cl reacts to form Chloramines. NH 3 + Cl Chloramines disinfect, but don’t react quickly with NO 2
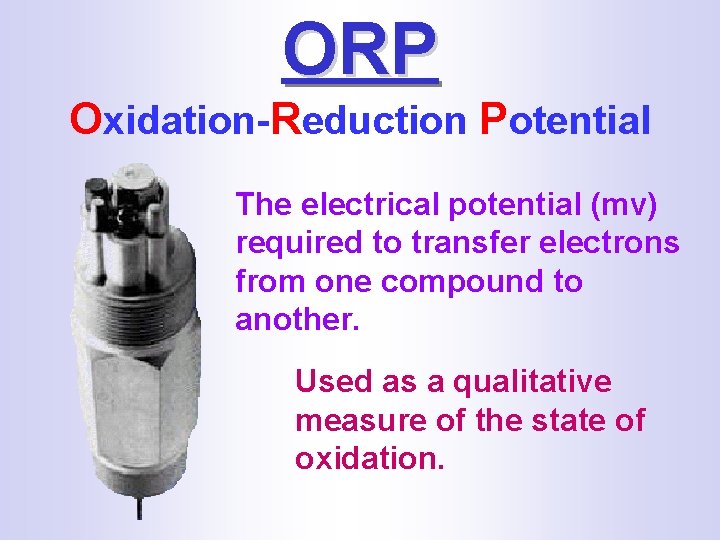
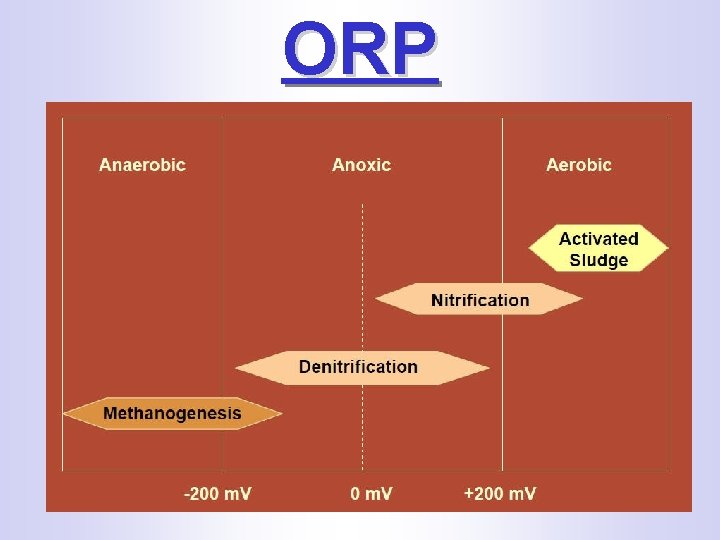
ORP Oxidation-Reduction Potential The electrical potential (mv) required to transfer electrons from one compound to another. Used as a qualitative measure of the state of oxidation.
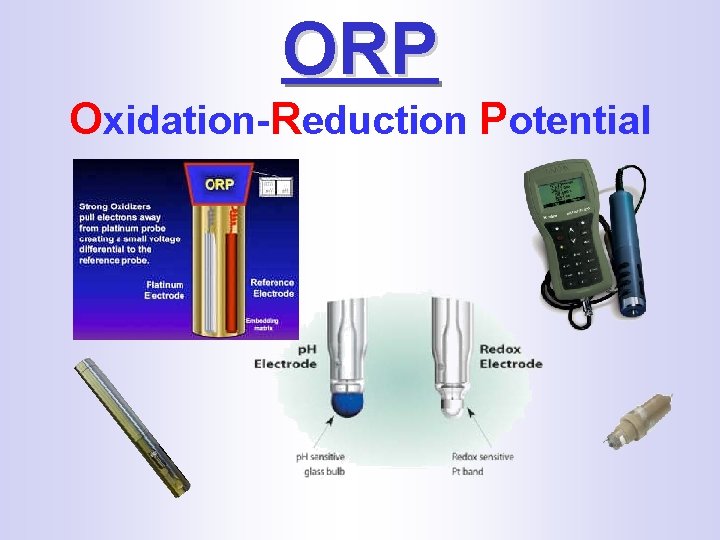
ORP Oxidation-Reduction Potential
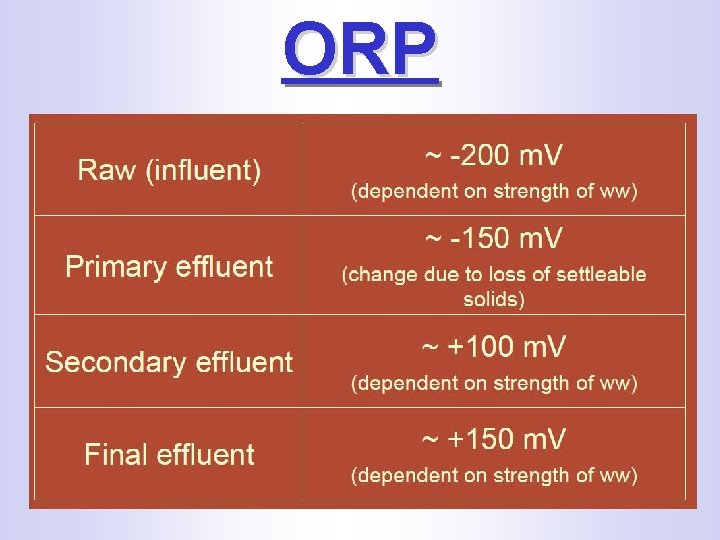
ORP
ORP
Nitrification and Denitrification Prepared by Michigan Department of Environmental Quality Operator Training and Certification Unit
- Slides: 51