NHS Wales Modelling Collaborative NHSModelling Collab WMC Dr

NHS Wales Modelling Collaborative #NHSModelling. Collab #WMC Dr Julie Vile, NHS Delivery Unit

WMC • A lot of momentum around modelling • Build on enthusiasm • Collaborate more • Share good practice • Reduce duplication of effort

Pre-launch questionnaire 3

Outcomes from launch • • • Excellent engagement Positive feedback Not enough analytical capability/capacity WMC can help “fill the gap” Work alongside informatics task force – decide strategic direction • Bi-annual national events; with working groups, training etc. • Ap. HA and ORS membership – accreditation; membership of professional body 4

WMC • Provide a stimulating environment for clinicians and health analysts to connect together, share methodologies, good practice, lessons learnt and knowledge with others • Increase pace & scale of modelling projects that have been shown to be beneficial • Translate data into shared decision making that can be used to directly improve patient care

The OR Society OR vs Analytics?

Most like to come out of WMC 8

Areas that could benefit from OR 9

Working groups • Forecasting & factors affecting demand • Simulating demand & capacity • Whole systems modelling • Stroke-specific • [Committee]

12

Forecasting - 3 types • Qualitative techniques – Expert opinion • Time series analysis – Pattern changes • Causal models – Relationships between system elements

Training & validation data • Training set – Used to fit models • Validation set – To estimate how well training set has been trained – Find the prediction error • Test set – Apply model to real-world data – Speculate about the quality of your model

Naïve forecast • Uses last period's actuals as period's forecast Data Attendance Forecast 01/08/2016 02/08/2016 03/08/2016 04/08/2016 05/08/2016 30 32 45 44 52 30 32 45 44 • No adjustment or attempt to establish causal factors • Good as a benchmark
 average • Each point is the average of a number of points")
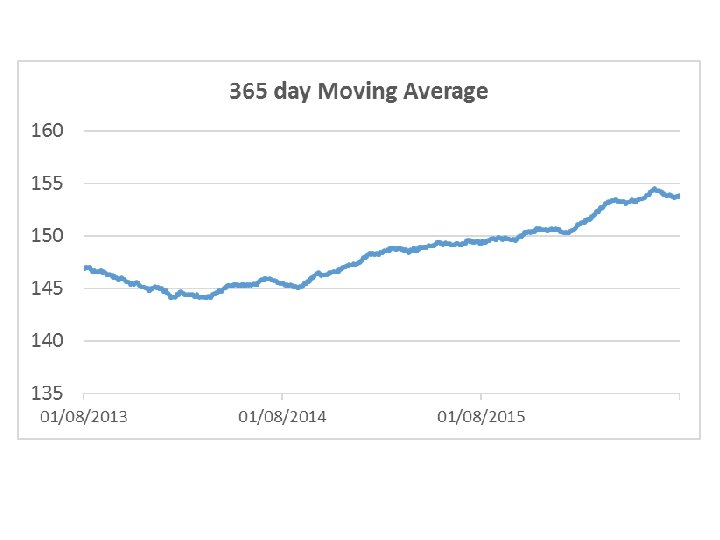
Moving (rolling) average • Each point is the average of a number of points in the time series – Smooths out short-term fluctuations – Highlight longer-term trends and cycles Data Attendance Prediction 01/08/2016 02/08/2016 03/08/2016 04/08/2016 05/08/2016 06/08/2016 07/08/2016 08/08/2016 39 32 45 44 52 59 39 40 44. 3 44. 4 48. 6 47. 4 49. 7
 average • Each point is the average of a number of points")
Moving (rolling) average • Each point is the average of a number of points in the time series – Smooths out short-term fluctuations – Highlight longer-term trends and cycles Data Attendance Prediction 01/08/2016 02/08/2016 03/08/2016 04/08/2016 05/08/2016 06/08/2016 07/08/2016 08/08/2016 39 32 45 44 52 59 39 40 44. 3 44. 4 48. 6 47. 4 49. 7

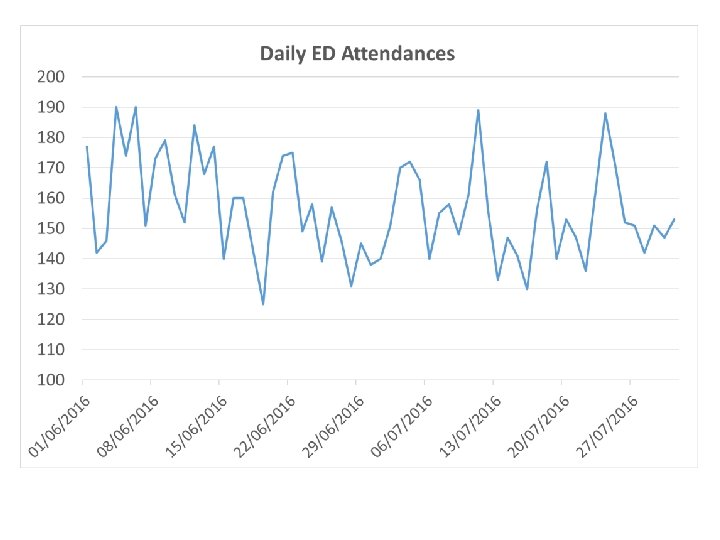
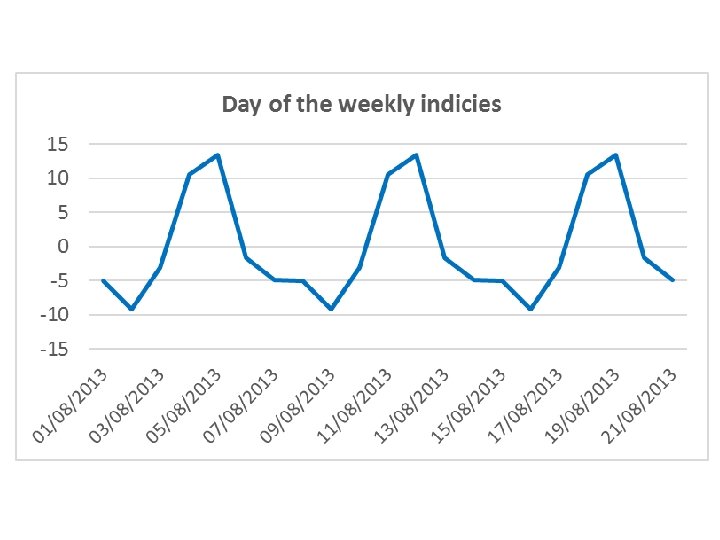
Decomposition • A forecast can be improved if the underlying factors of a data pattern can be identified and forecasted separately • Breaking down time series into component parts – Value = Seasonal + Trend + Error component – Value = Seasonal * Trend * Error component • Popular as easy to understand

 – Linear combination of terms")
Exponential smoothing • SES = Single Exponential Smoothing (Brown’s) – Linear combination of terms in the past – Weighting factors decrease exponentially • Double Exponential Smoothing – Used when data shows a trend – Level & trend components must be updated each period • Triple Exponential Smoothing (Holt-Winters) – Used when data shows trend and seasonality – A third parameter can be added to handle seasonality

Reflections • BI • ‘Once for Wales’ approach • 3 types of information: – Clinical coding – Operational – Outcome & experience data How to capture? What are we going to model? How? • WHAN & WMC links • Email me to join groups! 28

Next conference 29

Thank you for listening! Any Questions Julie. Vile@wales. nhs. uk #NHSModelling. Collab
- Slides: 26