Neziskov sektor v mezinrodnm srovnn Identifikace srovnvacho projektu


:")


")


- Slides: 67
Neziskový sektor v mezinárodním srovnání
Identifikace srovnávacího projektu: The Johns Hopkins Comparative Nonprofit Sector Project is a systematic effort to analyze the scope, structure, financing, and role of the private nonprofit sector in a cross-section of countries around the world in order to improve our knowledge and enrich our theoretical understanding of this sector, and to provide a sounder basis for both public and private action towards it. The project utilizes a comparative, empirical approach that relies heavily on a team of local associates in the target countries and involves a network of local advisory committees. Center for Civil Society Studies Institute for Policy Studies The Johns Hopkins University 3400 N. Charles Street Baltimore, MD 21218 -2688, USA Phone: 410 -516 -5463 Fax: 410 -516 -7818 E-mail: cnp@jhu. edu Web site: http: //www. ccss. jhu. edu/index. php? section=cont ent&view=9&sub=3&tri=8
The Johns Hopkins Comparative Nonprofit Sector Project Countries Denmark Norway Belgium The Finland Switzerland United Kingdom Netherlands France Denmark Czech Republic Sweden Italy Austria Germany Poland United States Romania Canada Mexico Venezuela Colombia Brazi l Chile Russia Ireland Spain Portugal Hungary Egypt Morocco Lebanon Israel India Kenya Thailand Pakistan Tanzania Ghana Argentina Peru Slovakia South Africa Japan Korea The Philippines Uganda Australia New Zealand
Kterých zemí se projekt týká…
Kdo spolupracoval Argentina - Mario Roitter Australia - Mark Lyons Austria – Ulrike Schneider Belgium - Jacques Defourny & Sybille Mertens Brazil - Leilah Landim & Neide Beres Canada – Michael Hall Chile – Ignacio Irarrazaval Colombia - Rodrigo Villar Czech Republic - Martin Potucek & Pavol Fric Denmark – Ole Gregersen & Thomas Boje Egypt – Amani Kandil • • • France - Edith Archambault Germany - Annette Zimmer & Eckhard Priller Hungary - István Sebestény & Renata Nagy India – Rajesh Tandon & S. S. Srivastava Ireland - Freda Donoghue Israel - Benjamin Gidron Italy – Gian Paolo Barbetta Japan - Naoto Yamauchi Kenya – Karuti Kanyinga Korea, Republic of - Tae-Kyu Park Lebanon – Hashem el-Husseini Mexico - Gustavo Verduzco & CEMEFI
Morocco - Salama Saidi The Netherlands - Paul Dekker & Bob Kuhry New Zealand - Massey University & Statistics New Zealand Norway - Hakon Lorentzen & Karl Henrik Sivesind Pakistan – Muhammad Asif Iqbal Peru - Felipe Portocarrero & Cynthia Sanborn The Philippines - Ledivina Cariño Poland - Ewa Les & Slawomir Nalecz Portugal – Raquel Campos Franco Romania - Carmen Epure • • • Russia – Oleg Kazakov Slovakia - Helena Woleková South Africa - Mark Swilling Spain - Jose Ignacio Ruiz Olabuenaga Sweden - Tommy Lundstrom & Filip Wijkstrom Switzerland – Bernd Helmig Tanzania - Laurean Ndumbaro & Amos Mhina Thailand – Amara Pongsapich Uganda – John-Jean Barya United Kingdom – Les Hems & Karl Wilding United States - Lester Salamon & Wojtek Sokolowski Venezuela – Rosa Amelia Gonzalez
…a kterých typů organizací: Organizations, i. e. , they have an institutional presence and structure; Private, i. e. , they are institutionally separate from the state; Not profit distributing, i. e. , they do not return profits to their managers or to a set of “owners”; Self-governing, i. e. , they are fundamentally in control of their own affairs; Voluntary, i. e. , membership in them is not legally required and they attract some level of voluntary contribution of time or money.
…a jakých aktivit:
4 typy zdrojů dat
Hlavní zjištění projektu Five major findings emerge from this work on the scope, structure, financing, and role of the civil society sector in the broad range countries for which we have now assembled data.
1. Neziskový sektor jako významná ekonomická síla In the first place, in addition to its social and political importance, the civil society sector turns out to be a considerable economic force, accounting for a significant share of national expenditures and employment. More specifically, in just the 35 countries for which they have collected information:
1995 -1998 A $1. 3 trillion industry. The civil society sector had aggregate expenditures of US$1. 3 trillion as of the late 1990 s, with religious congregations included. This represents 5. 1 percent of the combined gross domestic product (GDP) of these countries. • The world’s seventh largest economy. To put these figures into context, if the civil society sector in these countries were a separate national economy, its expenditures would make it the seventh largest economy in the world, ahead of Italy, Brazil, Russia, Spain, and Canada and just behind France and the U. K. • A major employer. The civil society sector in these 35 countries is also a major employer, with a total workforce of 39. 5 million full-time equivalent workers including religious congregations.
Kdyby byl neziskový sektor samostatnou ekonomikou:
Kdyby byl neziskový sektor samostatnou ekonomikou (1995):
The Johns Hopkins Comparative Nonprofit Sector Project If the civil society sector were a country. . . 2000 Country * In 2004 U. S. Dollars GDP (trillion $) United States Japan Germany United Kingdom Civil Society Land Expenditures (40 Countries) France China Italy Canada Spain Brazil Russia $11. 7 4. 6 2. 7 2. 1 1. 9* 1. 9 1. 7 1. 2 1. 0 0. 6 Source of GDP Figures: World Bank
1995
The Johns Hopkins Comparative Nonprofit Sector Project Employment in Civil Society Organizations vs. Largest firms 2000 Civil Society Organizations 48 million Largest Private Companies 4 million
Kdyby byl neziskový sektor samostatnou ekonomikou – zaměstnanost:
The Johns Hopkins Comparative Nonprofit Sector Project Civil Society Organization Workforce in context, 40 countries
Neziskový sektor zaměstnanost
The Johns Hopkins Comparative Nonprofit Sector Project CIVIL SOCIETY ORGANIZATION PAID VS. VOLUNTEER LABOR, 36 COUNTRIES Volunteers 44% n=65. 5 million (including religion) Paid Workers 56%
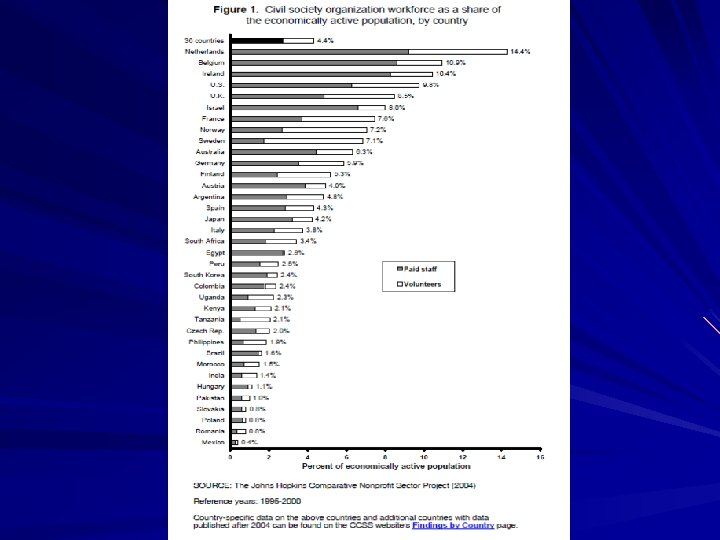
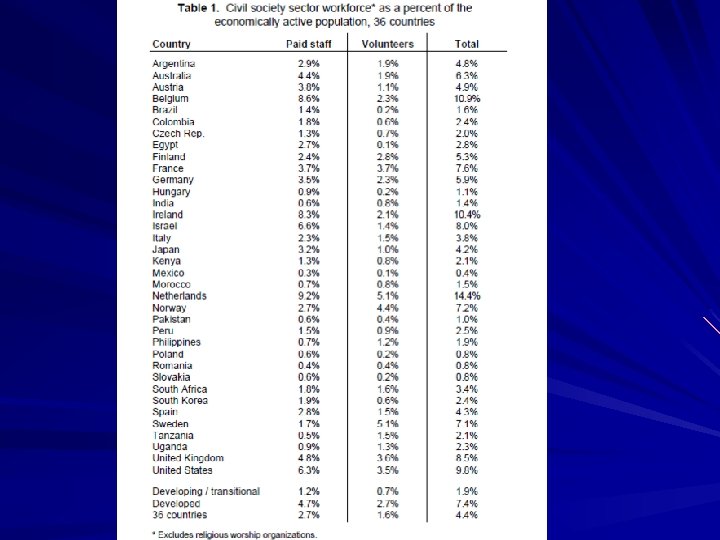
2. Rozdíly mezi zeměmi In the first place, countries vary greatly in the overall scale of their civil society workforce. the civil society sector workforce— volunteer and paid—varies from a high of 14 percent of the economically active population in the Netherlands to a low of 0. 4 percent in Mexico.
The Johns Hopkins Comparative Nonprofit Sector Project CSO workforce as a share of the economically active population, by country 2000
The Johns Hopkins Comparative Nonprofit Sector Project CSO workforce as a share of the economically active population, by country 2000
The Johns Hopkins Comparative Nonprofit Sector Project VOLUNTEERS AS % OF CSO WORKFORCE, BY COUNTRY CLUSTER 38% 39% 37% All countries Developed Developing Nordic 64% Africa Anglo-Saxon 54% 37% Central Europe 32% Latin America 30% Welfare Partnership 32% Asian Industrialized 24% 0% 20% 40% 60% % of CSO Workforce 80%
Rozvinuté vs. rozvojové a tranzitivní ekonomiky Developed vs. developing and transitional countries. Civil society sector is relatively larger in the more developed countries. In fact, the civil society organization workforce in the developed countries is proportionally more than three times larger than that in the developing countries (7. 4 percent vs. 1. 9 percent of the economically active population, respectively). This is so, moreover, even when account is taken of volunteer labor and not just paid employment. The relatively limited presence of civil society organizations in the developing countries does not, of course, necessarily mean the absence of helping relationships in these countries. – To the contrary, many of these countries have strong traditions of familial, clan, or village networks that perform many of the same functions as civil society institutions. What is more, there are considerable differences in the scale of civil society activity even among the less developed countries.
Rozdíly v zapojení dobrovolníků
Vybraná data, vybrané země…
The Johns Hopkins Center for Civil Society Studies Value Added as % of GDP, NPIs vs. Selected Industries, Canada, 2000 7. 9% Volunteers % of GDP NPIs 6. 1% 5. 1% 2. 3% 1. 5% 1. 4% Retail Trade Mining, oil & gas extractions Nonprofit sector Accommodations Agriculture & food services Motor Vehicle Manufacturing
The Johns Hopkins Center for Civil Society Studies Contribution to GDP, Volunteers vs. Selected Industries, Canada Billions of Canadian $ 15 $14. 1 billion $12. 8 billion 10 $6. 1 billion 5 Volunteers Motor Vehicle Mfg. Agriculture
The Johns Hopkins Center for Civil Society Studies Value Added as % of GDP, NPIs* vs. Selected Industries, Belgium, 2003 % of GDP 5. 0 % 4. 8% 2. 4% 1. 6% Hotels & Restaurants 1. 1% Construction NPIs * Without Volunteers Utilities Agriculture & Fishing
The Johns Hopkins Center for Civil Society Studies NPI Share of Belgian Value Added, Selected Fields SOCIAL SERVICES 66. 6% HEALTH 42. 7% CULTURE & RECREATION 26% 10% 50% Percent of Total Value 80%
The Johns Hopkins Center for Civil Society Studies Average Annual Change in GDP and GDP Contribution of NPIs GDP NPI 4. 7% 5% 4. 3% 4. 2% 3. 3% 1% Belgium Canada USA (2000 -2003) (1997 -2001) (1996 -2004)
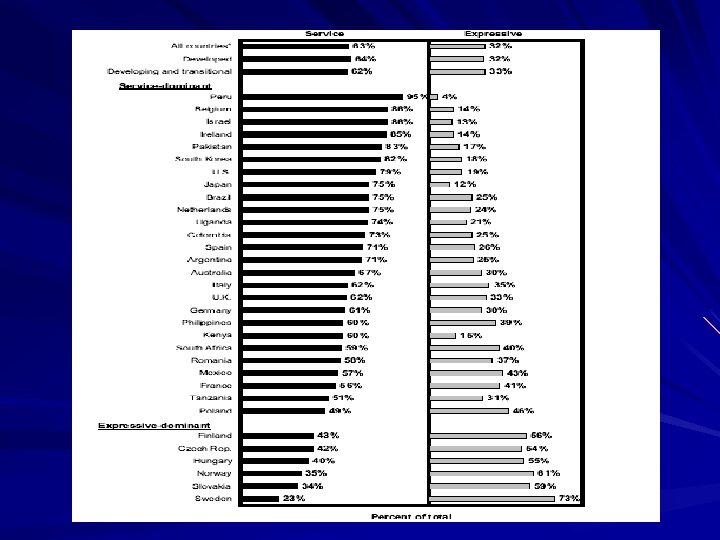
3. NS není jen poskytovatelem služeb Service functions involve the delivery of direct services such as education, health, housing, economic development promotion, and the like. Expressive functions involve activities that provide avenues for the expression of cultural, religious, professional, or policy values, interests, and beliefs. Included here are cultural institutions, recreation groups, religious worship organizations, professional associations, advocacy groups, community organizations and the like. ---The distinction between expressive and service functions is far from perfect, of course, and many organizations are engaged in both.
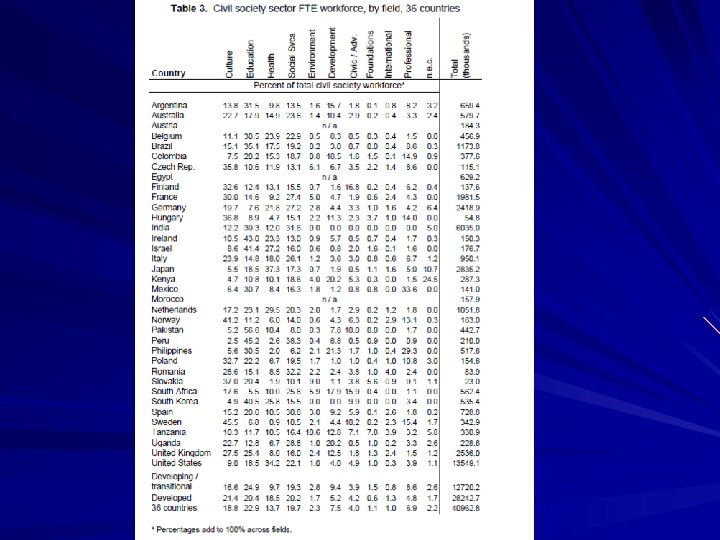
… i tak lze říci, že: Service functions dominate in scale. From the evidence available, it appears that the service functions of the civil society sector clearly absorb the lion’s share of the activity. – Excluding religious worship, … an average of over 60 percent of the total paid and volunteer full-time equivalent workforce of the civil society sector in the 32 countries for which we have activity data work for organizations primarily engaged in service functions.
The Johns Hopkins Comparative Nonprofit Sector Project DISTRIBUTION OF CIVIL SOCIETY WORKFORCE, BY FUNCTION Service 64% Education 23% Culture 19% Social Services 19% er th O Health 14% Mis c. A dvo 13% cacy 4% Development 8% Expressive 32%
A ještě ke službám: Education and social services are the dominant service functions. Among the service activities of the civil society sector, education and social services clearly absorb the largest share. – Over 40 percent of the nonprofit workforce— paid and volunteer—is engaged in these two service functions on average.
Rozdělení zaměstnanosti v NS dle typu aktivity
Dobrovolníci a typy aktivit
Odchylky od obecných vzorců The first of these relates to the Nordic countries of Finland, Norway, and Sweden. The second relates to the countries of Central and Eastern Europe (the Czech Republic, Hungary, Slovakia, and, to a slightly lesser extent, Poland). – In both of these groups of countries organizations primarily engaged in expressive activities absorb a larger share of the civil society workforce than do those engaged in the service functions. The most likely explanation for this is that in both groups of countries the state assumed a dominant position in both the financing and delivery of social welfare services, leaving less room for private, civil society organizations.
To se týká nás… In Central Europe this was a product of the imposition of a Soviet-style regime in the aftermath of World War II. While this regime concentrated social welfare services in the hands of the state and discouraged, or prohibited, the emergence of independent civil organizations, it did sanction the limited creation of professional and recreational organizations, many of which survived into the post-Communist era.
A tohle Seveřanů: In the Nordic countries, by contrast, a robust network of grassroots labor and socialmovement organizations took shape during the late nineteenth century and pushed through a substantial program of social welfare protections financed and delivered by the state. – This limited the need for active civil society involvement in service provision but left behind a vibrant heritage of citizen-based civil society activity in advocacy, recreation, and related expressive fields.
Co dodat: While the structure of the civil society sector in these two groups of countries is similar, however, the scale of the sector differs widely. – In particular, the civil society sector in the Central and Eastern European countries remained quite small nearly a decade after the overthrow of the Soviet-type regimes. – By contrast, in the Nordic countries, a sizable civil society sector remains in existence today, though it is largely staffed by volunteers and engaged in a variety of cultural, recreational, and expressive
4. Zajímavá struktura příjmů
The Johns Hopkins Comparative Nonprofit Sector Project SOURCES OF CIVIL SOCIETY REVENUE (32 COUNTRYAVERAGE) Philanthropy 12% Government 35% Fees 53%
Platby a poplatky Fees are the dominant source of revenue. – In the 32 countries on which revenue data are available, 23 over half (53 percent) of civil society organization incomes, on average, not from private philanthropy but from fees and charges for the services that these organizations provide and the related commercial income they receive from investments and other commercial sources, including dues.
Veřejné zdroje Significant public sector support. Nor is philanthropy the second largest source of civil society organization revenue internationally. That distinction belongs, rather, to government or the public sector. – An average of 35 percent of all civil society organization revenue comes from public sector sources, either through grants and contracts or reimbursement payments made by governmental agencies or quasi-nongovernmental organizations such as publicly financed social security and health agencies.
Omezená role filantropie Limited role of private philanthropy. – Private giving from all sources—individuals, foundations, and corporations—accounts for a much smaller 12 percent of total civil society organization revenue in the countries we have examined, or one-third as much as government and less than one-fourth as much as fees and charges.
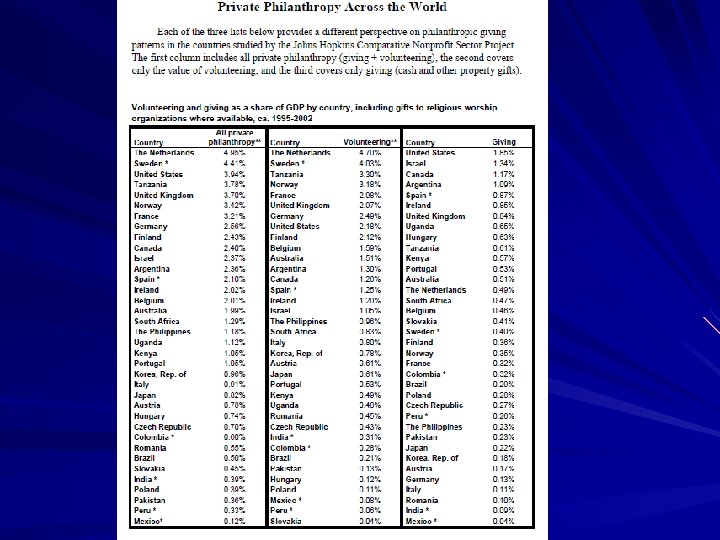
The Johns Hopkins Center for Civil Society Studies Philanthropy as share of GDP, selected countries, 1995 -2004
Srovnání zemí podle typů zdrojů
The Johns Hopkins Comparative Nonprofit Sector Project SOURCES OF CIVIL SOCIETY ORGANIZATION REVENUE, BY COUNTRY FEE DOMINANT Fees, Charges Public Sector Philanthropy All Countries 35% 12% 53% 92% Philippines Mexico Kenya Brazil Argentina S. Korea Colombia Peru Australia Sweden Italy Poland Norway Finland U. S. Slovakia Hungary Tanzania Japan Pakistan Spain Czech Rep. 85% 81% 74% 73% 71% 70% 63% 62% 61% 60% 58% 57% 55% 53% 52% 51% 49% 47% 0% 20% 40% 60% 80% 5% 9% 5% 19% 24% 15% 18% 31% 29% 37% 24% 35% 36% 31% 22% 27% 45% 6% 32% 39% 3% 6% 14% 11% 7% 4% 15% 12% 6% 9% 3% 15% 7% 6% 13% 23% 18% 20% 3% 43% 19% 14% 0% 20% 40% 60% 80%
The Johns Hopkins Comparative Nonprofit Sector Project SOURCES OF CIVIL SOCIETY ORGANIZATION REVENUE, BY COUNTRY Government Dominant Fees, Charges All Countries 53% Ireland 16% 19% Belgium 32% Germany 26% Israel 39% Netherlands France 35% Austria 43% U. K. 45% Romania 29% 32% South Africa Public Sector 35% Philanthropy 12% 77% 7% 77% 5% 64% 59% 3% 10% 2% 58% 8% 50% 6% 47% 45% 44% 9% 26% 24% 0% 20% 40% 60% 80% % may not add up to 100% due to rounding
5. Regionální vzorce
Regionální vzorce - Central and Eastern Europe …Notable, perhaps, is the extremely small scale of the civil society sector in these countries— engaging only one-fourth as large a proportion of the economically active population as the overall 35 -country average. – Indeed, the civil society sector in these countries is smaller than in any of the other regions we examined, including the developing countries of Africa and Latin America. Also notable is the relatively large presence of expressive activity within what little civil society sectors exist in these countries.
Regionální vzorce - Central and Eastern Europe This is likely a reflection of the social welfare policies of the Soviet-era governments, which relied on direct provision of the most important social services by the “workers’ state” and discouraged reliance on private voluntary groups, including those affiliated with religious groups. – An embryonic civil society sector was tolerated in these countries, but largely for social, recreational, and professional purposes, and even then at least partly as vehicles for state control. In the aftermath of the collapse of the state socialist regimes, a number of these sanctioned organizations were able to make the transition into nonprofit status, often with the aid of captured state resources (buildings, equipment, and occasionally subsidies), and their relatively sizable presence is reflected in the data.
Regionální vzorce - Central and Eastern Europe One particularly ironic byproduct of this peculiar history of civil society development in Central and Eastern Europe is the relatively high level of reliance on philanthropic support on the part of the region’s civil society organizations. – Ironically, despite its socialist past, philanthropy constitutes a larger share of the revenues of civil society organizations in this region than in any other region (20 percent vs. an all-country average of 12 percent). One explanation for this may be that when state enterprises were transformed into private firms, they spun off into nonprofit organizations many of the health and recreational services they previously provided to their workers free of cost, but they continued some degree of financial or in-kind support to these activities. Since these state enterprises became private firms, however, this support shows up in our data as private charity.