News http www thefarmproduction blogspot com http www

News • http: //www. thefarmproduction. blogspot. com/ • http: //www. msnbc. msn. com/id/33357735/ns/us_newsenvironment/ • http: //www. comcast. net/articles/newsscience/20091016/AA. Antarctica. Global. Warming/ • http: //www. boston. com/news/science/articles/2009/10/20/ more_planets_discovered_outside_solar_system/ • http: //www. boston. com/news/world/asia/articles/2009/10/2 0/carbon_cutting_projects_face_uncertainty_after_2012/ • http: //www. boston. com/bostonglobe/editorial_opinion/edit orials/articles/2009/10/20/to_foster_green_energy_state_ne eds_to_make_bets/

Remaining Issues with Midterm 1

Support for Learning • Midterm II-Handed out Thursday, Nov. 12 • Participation-30% • Extra Credit Paper (up to 2/3 of letter grade) – – 5 -10 pages Subject of your choice 5 -10 references (at least 3 not on the internet) Discuss with Jason or Bob (email OK) • Contact Jason or Bob • Black. Board – Powerpoints – Lecture Notes – Study Lists • Reading – Notebooks, notes

The Greenhouse Effect Image courtesy of scrappy annie, Flickr. com

Greenhouse Effect Image courtesy of National Park Service, U. S. Department of the Interior

Energy Budget Image courtesy of Robert A. Rohde, Wikipedia

Model • http: //ccl. northwestern. edu/netlogo/models/ Climate. Change

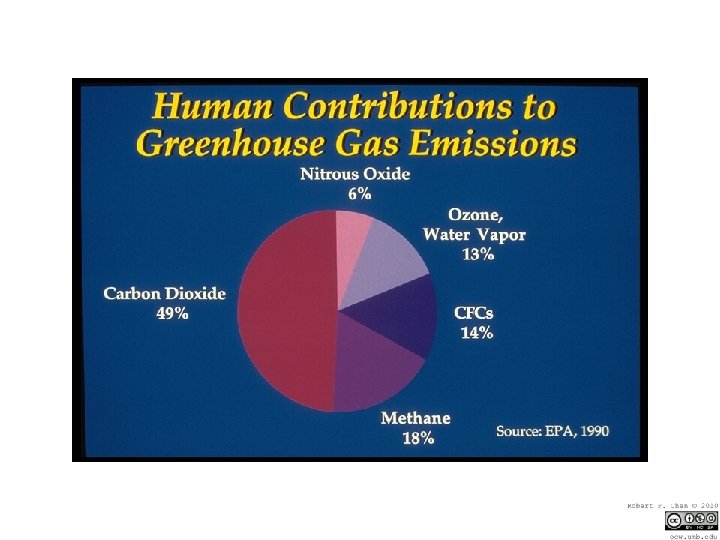
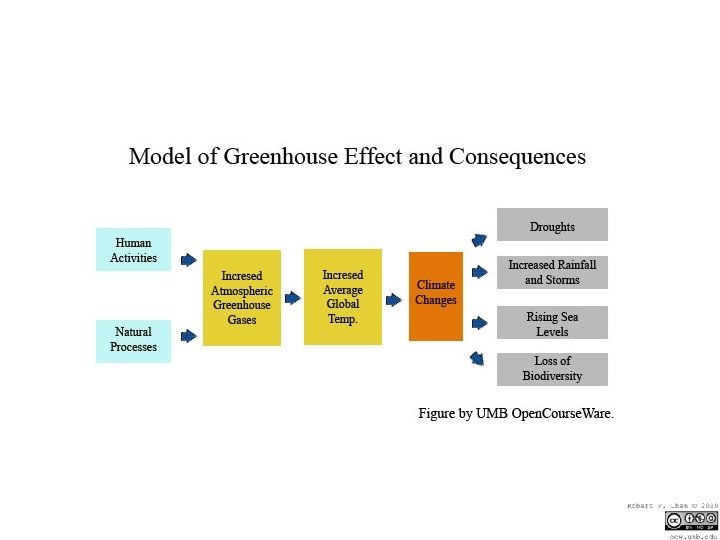
Greenhouse Effect • Natural Greenhouse Effect – Raises earth’s average temperature 18 C to 14 C • Anthropogenic Greenhouse Effect Enhancement – Due to additions of greenhouse gases – CO 2, CH 4, N 20, O 3, Freons • CO 2 and Temperature correlated over last 2 million years • CO 2 has never been as high as it is today • Model predictions need historical data as well as a complete understanding of feedback systems and thresholds

Carbon Dioxide

Other Greenhouse Gases Image courtesy of www. epa. gov

Radiation is related to Temperature Images removed due to copyright restrictions. Different gases Absorb different wavelengths

“Global Average Temperature” Images removed due to copyright restrictions.

How do you measure “Global Average Temperature”?

6000 Temperature Stations Image courtesy of Robert A. Rohde, Wikipedia

Ice Cores Image courtesy of Kevin_Mc. Mahon, www. arcus. org/

Feedbacks--Albedo Images removed due to copyright restrictions.

Polar Ice Caps Image courtesy of NASA

Glacial/Interglacial Images removed due to copyright restrictions.

Other Feedback Systems • Increased CO 2 increased T ice caps melting decreased albedo increased T (POSITIVE feedback) • Increased CO 2 increased photosynthesis decreased CO 2 (NEGATIVE feedback) • Increased T increased evaporation increased clouds increased albedo decreased T (NEGATIVE feedback) • Increased CO 2 Increased T increased climate change disruption of ecosytems decreased productivity increased CO 2 (POSITIVE feedback)

Thresholds • Ocean Conveyor Belt stops – Temperatures rise, arctic ice melts, North Atlantic Deep Water not salty enough to sink • Terrestrial carbon sink fills up – Forest regrowth complete – ~1 gigaton C/yr atmospheric increase above current • El Nino intensifies – Temperatures rise, cause greater gradients in pressure, disrupts upwelling and therefore productivity • Hurricanes intensify – Water temperatures increase – Allow many more hurricanes to develop – Disrupts ecosystems

What can we learn from Past climate change? Images removed due to copyright restrictions.

Global Temperatures-Ice Ages Milankovitch Cycles Image courtesy of Robert A. Rohde, Wikipedia

Carbon Dioxide Image courtesy of Robert A. Rohde, Wikipedia

Current Interglacial Image courtesy of Robert A. Rohde, Wikipedia

Image courtesy of Robert A. Rohde, Wikipedia

Sun Spots Image courtesy of Robert A. Rohde, Wikipedia

Source: The Low Carbon Partnership

Model Projections Image courtesy of Robert A. Rohde, Wikipedia

Temperature Changes So Far Image courtesy of Robert A. Rohde, Wikipedia

Uneven: 0 -8 C Image courtesy of Robert A. Rohde, Wikipedia

Argentina Portage Lake/Glacier Images removed due to copyright restrictions. Upsala Glacier You can observe a lot by watching…

Greenland Ice Sheet Source: The Green Lane Coral Bleaching Permafrost Image courtesy of NASA Earth Observatory

How will a 3 C temperature increase affect your life?

Images removed due to copyright restrictions.

Global Conveyor Belt Image courtesy of Avsa

Image courtesy of World Resources Institute

Effect on Species Images removed due to copyright restrictions.

Effects of Climate Change Agriculture • Shifts in food growing areas • Changes in crop yields • Increased pests crop diseases, and weeds in warmer areas Biodiversity • Extinction of some plant and animal species • Loss of Habitats • Disruption of aquatic life Weather Extremes • Prolonged heat waves and droughts • Increased flooding from more frequent, intense, and heavy rainfall in some areas Water Resources • Changes in water supply • Decreased water quality • Increased drought • Increased flooding • Snowpack reduction • Melting of mountaintop glaciers Forests • Changes in forest composition and locations • Disappearance of some forests especially ones at high elevations • Increased fires from drying • Loss of wildlife habitat and species Human Population • Increased deaths from heat and disruption of food supplies • More environmental • Increased migration Human Health • Decreased deaths from cold weather • Increased deaths from heat and disease • Disruption of food and water supplies • Spread of tropical diseases to temperate areas • Increased respiratory disease and pollen allergies • Increased water pollution from coastal flooding • Increased formation of photochemical smog Sea Level and coastal Areas • Rising sea levels • Flooding of low-lying islands and coastal cities • Flooding of coastal estuaries, wetlands, and coral reefs • Beach erosion • Disruption of coastal fisheries • Contamination of coastal aquifers with salt water Images removed due to copyright restrictions.

Methods to slow Possible Global Warming Prevention • • • Cut fossil fuel use (especially coal) in half Improve energy efficiency Shift to renewable Energy Reduce deforestation Use sustainable agriculture Slow population growth Cleanup • Remove Co 2 from smoke stack and vehicle emissions • Plant and tend trees Images removed due to copyright restrictions.

CO 2 Sequestration Image courtesy of U. S. Department of Energy under public domain

Carbon Sequestration Images removed due to copyright restrictions.

CO 2 Burial: Saline Reservoirs 130 Gt total U. S. sequestration potential Global emissions 6 Gt/yr in 2002 Test sequestration projects 2002 -2004 Study Areas • Near sources (power plants, refineries, coal fields) • Distribute only H 2 or electricity • Must not leak • At 2 Gt/yr sequestration rate, surface of U. S. would rise 10 cm by 2100 One Formation Studied Two Formations Studied Power Plants (dot size proportional to 1996 carbon emissions) DOE Vision & Goal: 1 Gt storage by 2025, 4 Gt by 2050

Projected Carbon-Free Primary Power 2005 usage: 14 TW
- Slides: 45