
NEW TRENDS IN MULTIPLE SCLEROSIS EPIDEMIOLOGY Global Burden
NEW TRENDS IN MULTIPLE SCLEROSIS EPIDEMIOLOGY Global Burden of Disease Brain Summit Auckland, New Zealand Mitchell Wallin, MD, MPH Director, VA MSCo. E-East Associate Professor of Neurology Georgetown University & University of Maryland

Disclosures No Conflicts of Interest to Declare
Learning Objectives Assess the current diagnosis and classification of Multiple Sclerosis (MS) 2. Summarize the prevalence, incidence and progression of MS 3. Briefly characterize MS risk factors 4. Recognize the utility of the Global Burden of Disease approach to understand disease morbidity and integrate findings across the world 1.
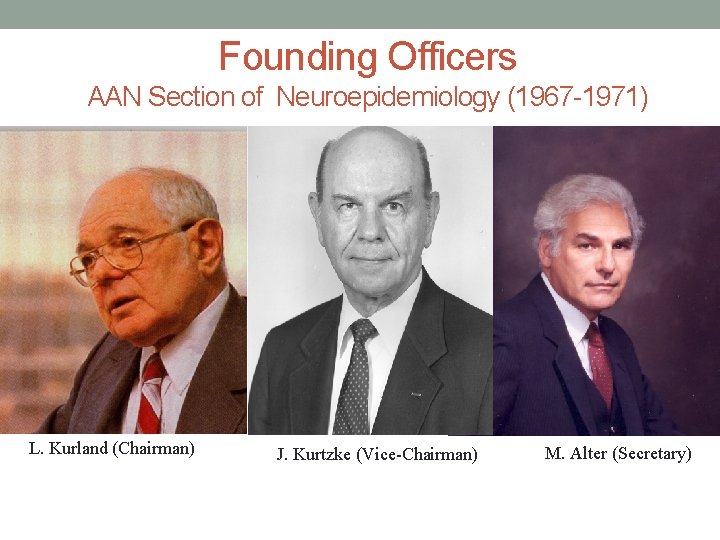
Founding Officers AAN Section of Neuroepidemiology (1967 -1971) L. Kurland (Chairman) J. Kurtzke (Vice-Chairman) M. Alter (Secretary)
New Trends in Multiple Sclerosis Epidemiology • Diagnosis and Morbidity Updates • NMSS MS Prevalence Project • Global Burden of MS • Risk Factors for MS & Prevention • VA MSCo. E
Multiple Sclerosis • Chronic, inflammatory-degenerative disease of CNS • Precipitated by environmental factors (PMSA) in genetically susceptible individuals • The hallmark of MS is inflammatory, demyelinating plaques and axonal loss in the CNS • Characterized by relapses and remissions of neurological symptoms and progression of disability over time • Most common progressive neurological disease of young adults
7 Diagnostic Criteria for MS: 2017 Revisions to Mc. Donald Criteria • Central nervous system lesions separated in space & time • The following changes were made for patients with typical clinically isolated syndromes: • Positive CSF allows for MS dx where DIS criteria is met • Cortical lesions can be used to demonstrate DIS • Eliminate more likely diagnoses Solomon, Neurology 2016 • Further refinement of criteria needed for: • Optic nerve involvement • Pediatric, Asian and Latin American populations Thompson, Lancet Neurol 2018
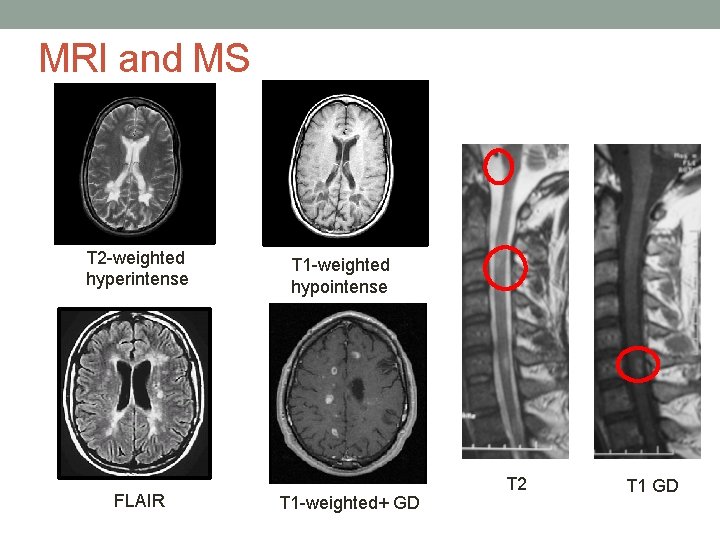
MRI and MS T 2 -weighted hyperintense FLAIR T 1 -weighted hypointense T 1 -weighted+ GD T 2 T 1 GD
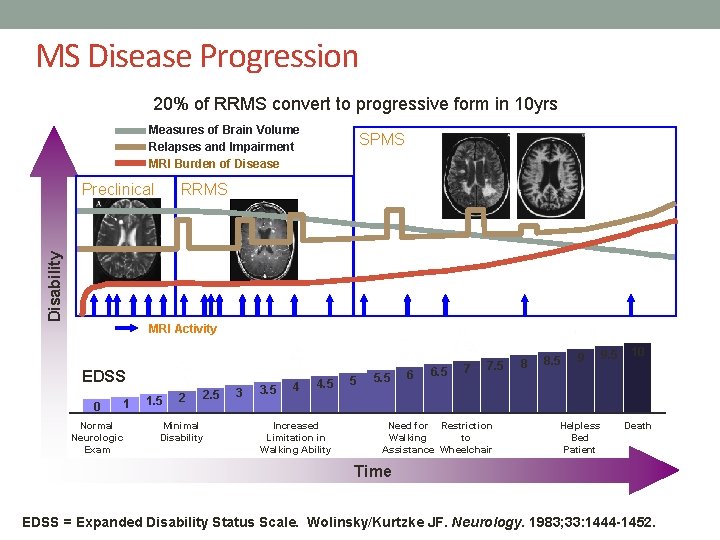
MS Disease Progression 20% of RRMS convert to progressive form in 10 yrs Measures of Brain Volume Relapses and Impairment MRI Burden of Disease Disability Preclinical SPMS RRMS MRI Activity EDSS 0 1 Normal Neurologic Exam 1. 5 2 2. 5 Minimal Disability 3 3. 5 4 4. 5 Increased Limitation in Walking Ability 5 5. 5 6 6. 5 7 7. 5 Need for Restriction Walking to Assistance Wheelchair 8 8. 5 9 Helpless Bed Patient 9. 5 10 Death Time EDSS = Expanded Disability Status Scale. Wolinsky/Kurtzke JF. Neurology. 1983; 33: 1444 -1452.
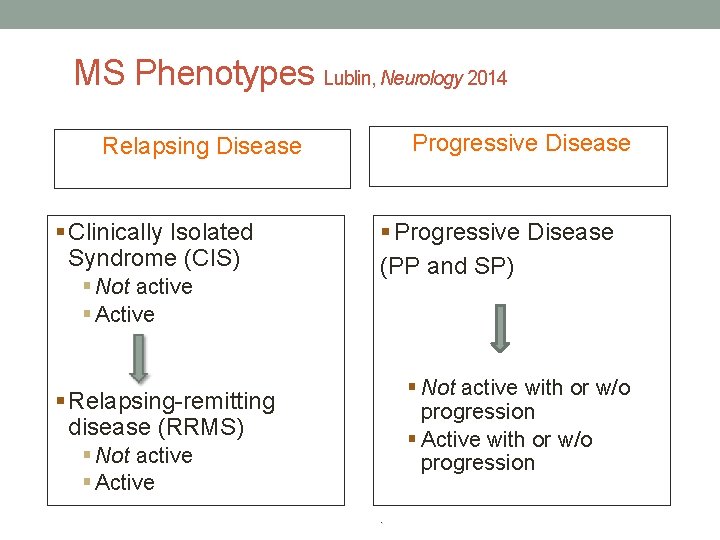
MS Phenotypes Lublin, Neurology 2014 Progressive Disease Relapsing Disease § Clinically Isolated Syndrome (CIS) § Not active § Active § Progressive Disease (PP and SP) § Not active with or w/o progression § Active with or w/o progression § Relapsing-remitting disease (RRMS) § Not active § Active.
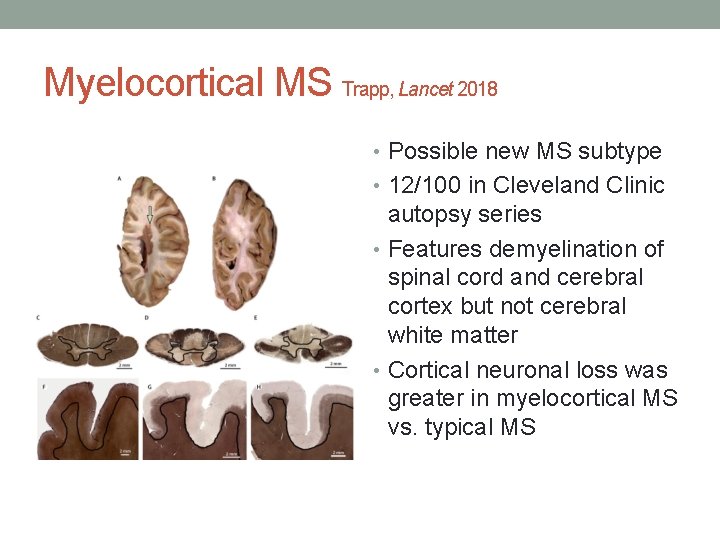
Myelocortical MS Trapp, Lancet 2018 • Possible new MS subtype • 12/100 in Cleveland Clinic autopsy series • Features demyelination of spinal cord and cerebral cortex but not cerebral white matter • Cortical neuronal loss was greater in myelocortical MS vs. typical MS
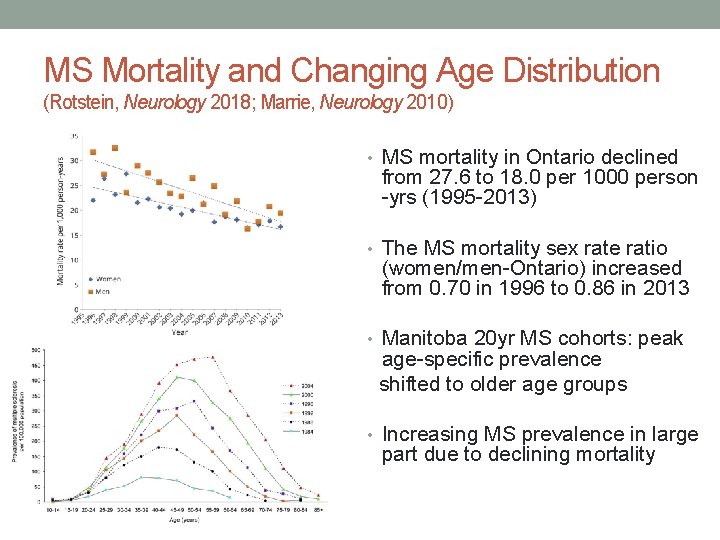
MS Mortality and Changing Age Distribution (Rotstein, Neurology 2018; Marrie, Neurology 2010) • MS mortality in Ontario declined from 27. 6 to 18. 0 per 1000 person -yrs (1995 -2013) • The MS mortality sex rate ratio (women/men-Ontario) increased from 0. 70 in 1996 to 0. 86 in 2013 • Manitoba 20 yr MS cohorts: peak age-specific prevalence shifted to older age groups • Increasing MS prevalence in large part due to declining mortality
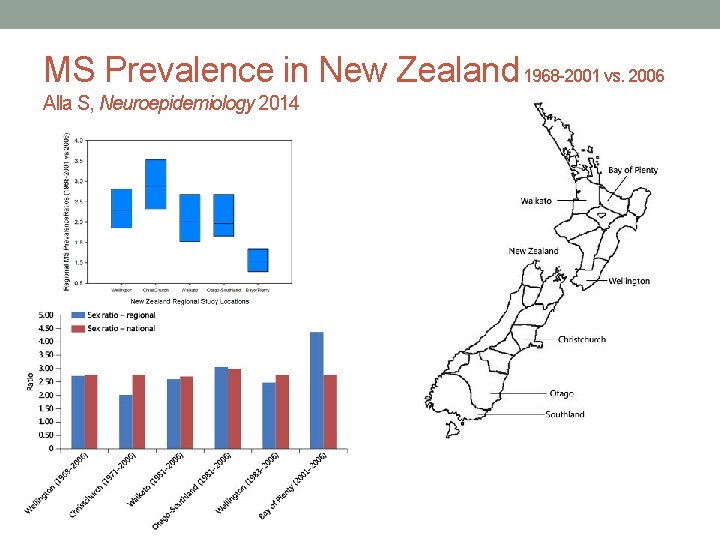
MS Prevalence in New Zealand 1968 -2001 vs. 2006 Alla S, Neuroepidemiology 2014
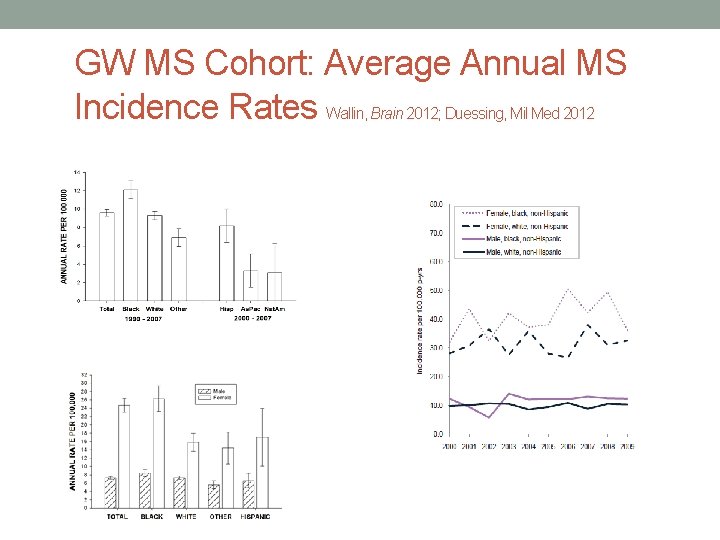
GW MS Cohort: Average Annual MS Incidence Rates Wallin, Brain 2012; Duessing, Mil Med 2012
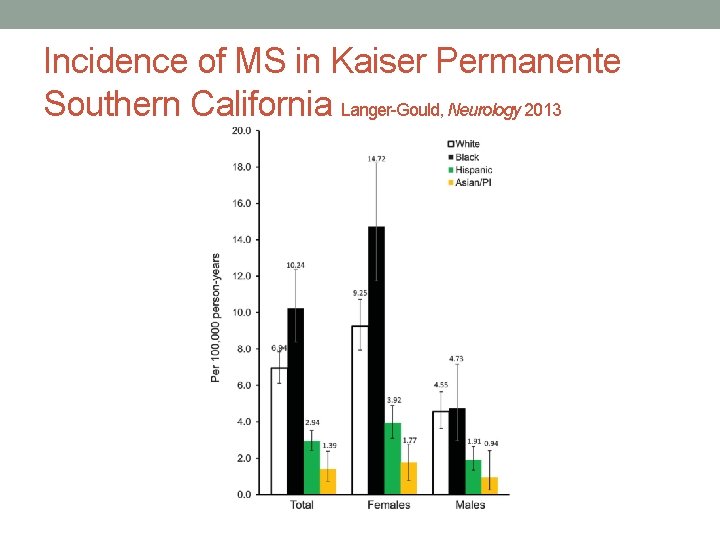
Incidence of MS in Kaiser Permanente Southern California Langer-Gould, Neurology 2013
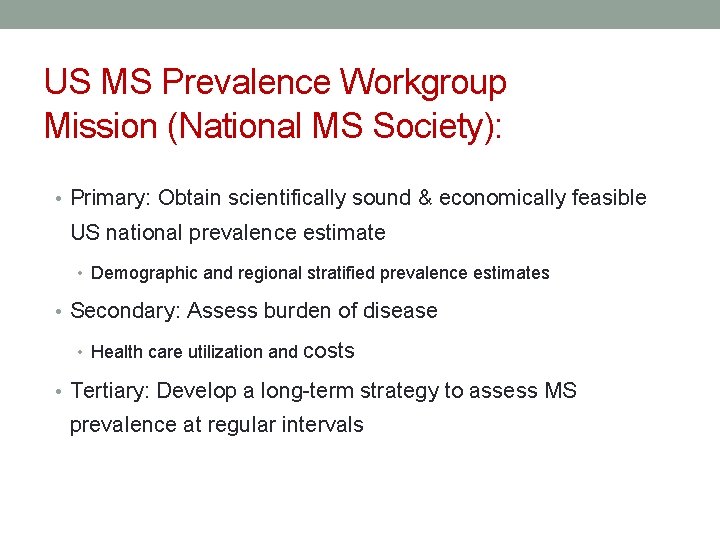
US MS Prevalence Workgroup Mission (National MS Society): • Primary: Obtain scientifically sound & economically feasible US national prevalence estimate • Demographic and regional stratified prevalence estimates • Secondary: Assess burden of disease • Health care utilization and costs • Tertiary: Develop a long-term strategy to assess MS prevalence at regular intervals
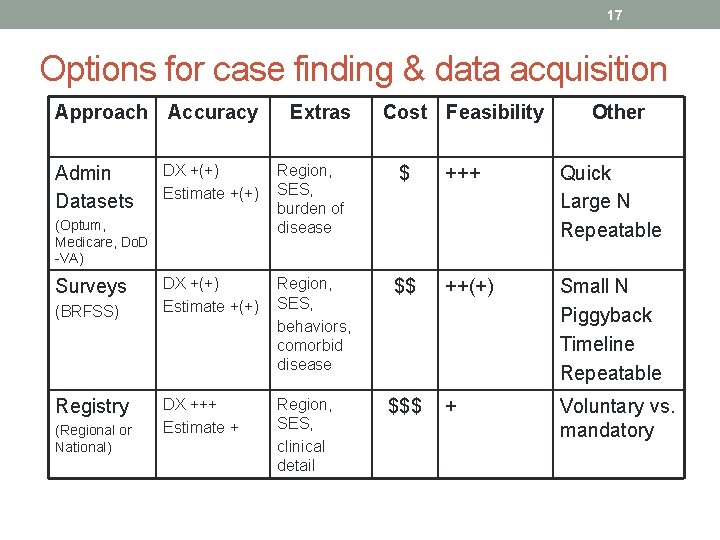
17 Options for case finding & data acquisition Approach Accuracy Admin Datasets (BRFSS) Registry (Regional or National) Cost Feasibility Other DX +(+) Estimate +(+) Region, SES, burden of disease $ +++ Quick Large N Repeatable DX +(+) Estimate +(+) Region, SES, behaviors, comorbid disease $$ ++(+) Small N Piggyback Timeline Repeatable DX +++ Estimate + Region, SES, clinical detail $$$ + Voluntary vs. mandatory (Optum, Medicare, Do. D -VA) Surveys Extras
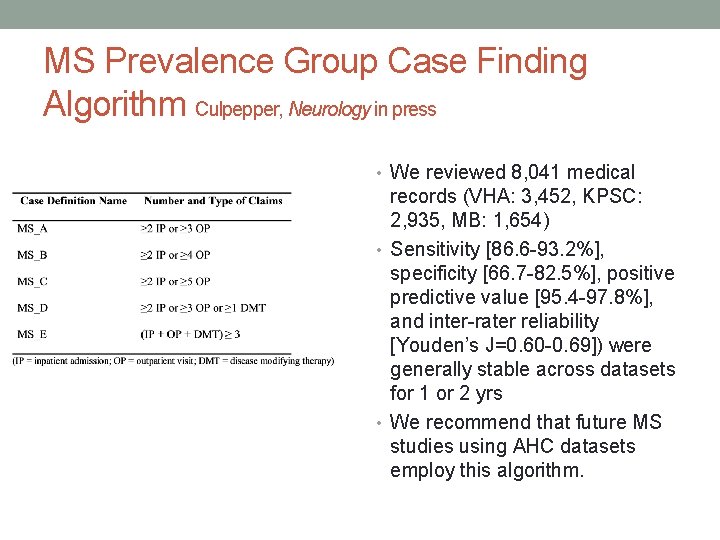
MS Prevalence Group Case Finding Algorithm Culpepper, Neurology in press • We reviewed 8, 041 medical records (VHA: 3, 452, KPSC: 2, 935, MB: 1, 654) • Sensitivity [86. 6 -93. 2%], specificity [66. 7 -82. 5%], positive predictive value [95. 4 -97. 8%], and inter-rater reliability [Youden’s J=0. 60 -0. 69]) were generally stable across datasets for 1 or 2 yrs • We recommend that future MS studies using AHC datasets employ this algorithm.
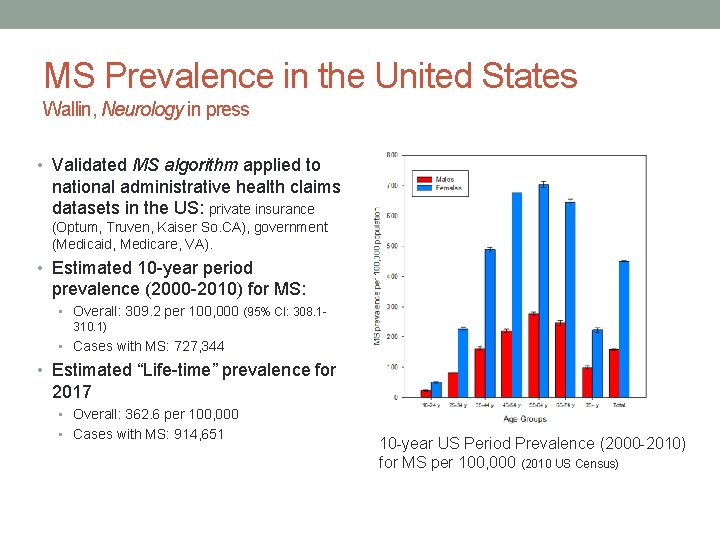
MS Prevalence in the United States Wallin, Neurology in press • Validated MS algorithm applied to national administrative health claims datasets in the US: private insurance (Optum, Truven, Kaiser So. CA), government (Medicaid, Medicare, VA). • Estimated 10 -year period prevalence (2000 -2010) for MS: • Overall: 309. 2 per 100, 000 (95% CI: 308. 1310. 1) • Cases with MS: 727, 344 • Estimated “Life-time” prevalence for 2017 • Overall: 362. 6 per 100, 000 • Cases with MS: 914, 651 10 -year US Period Prevalence (2000 -2010) for MS per 100, 000 (2010 US Census)
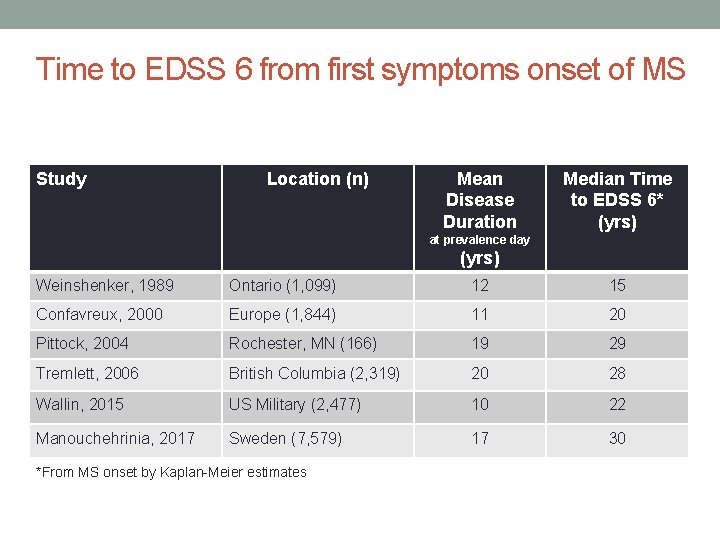
Time to EDSS 6 from first symptoms onset of MS Study Location (n) Mean Disease Duration Median Time to EDSS 6* (yrs) at prevalence day (yrs) Weinshenker, 1989 Ontario (1, 099) 12 15 Confavreux, 2000 Europe (1, 844) 11 20 Pittock, 2004 Rochester, MN (166) 19 29 Tremlett, 2006 British Columbia (2, 319) 20 28 Wallin, 2015 US Military (2, 477) 10 22 Manouchehrinia, 2017 Sweden (7, 579) 17 30 *From MS onset by Kaplan-Meier estimates
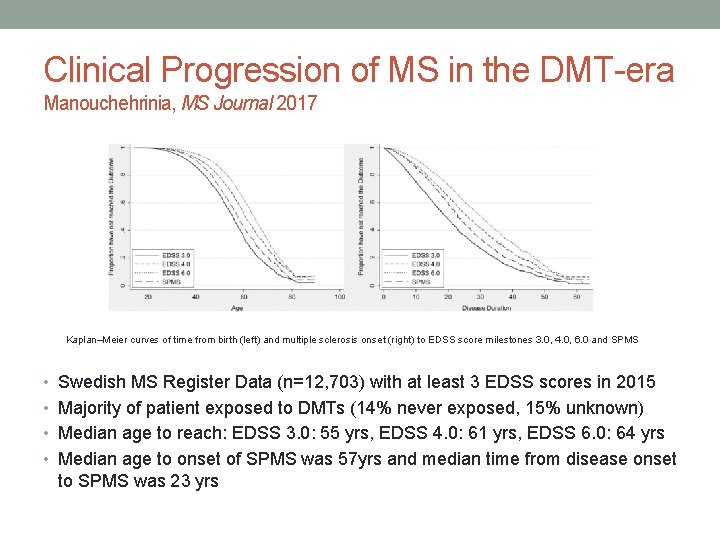
Clinical Progression of MS in the DMT-era Manouchehrinia, MS Journal 2017 Kaplan–Meier curves of time from birth (left) and multiple sclerosis onset (right) to EDSS score milestones 3. 0, 4. 0, 6. 0 and SPMS • Swedish MS Register Data (n=12, 703) with at least 3 EDSS scores in 2015 • Majority of patient exposed to DMTs (14% never exposed, 15% unknown) • Median age to reach: EDSS 3. 0: 55 yrs, EDSS 4. 0: 61 yrs, EDSS 6. 0: 64 yrs • Median age to onset of SPMS was 57 yrs and median time from disease onset to SPMS was 23 yrs
Global Burden of Disease 2016 Approach to MS Morbidity and Mortality • Unique source for integrated global estimates of prevalence, incidence, and deaths from MS • Morbidity and mortality data stratified by country, region and development level • GBD 2016 results are more accessible to researchers and clinicians with interest in MS • Data helpful for clinical planning and health policy makers • Models for estimating outcomes improve with more robust data
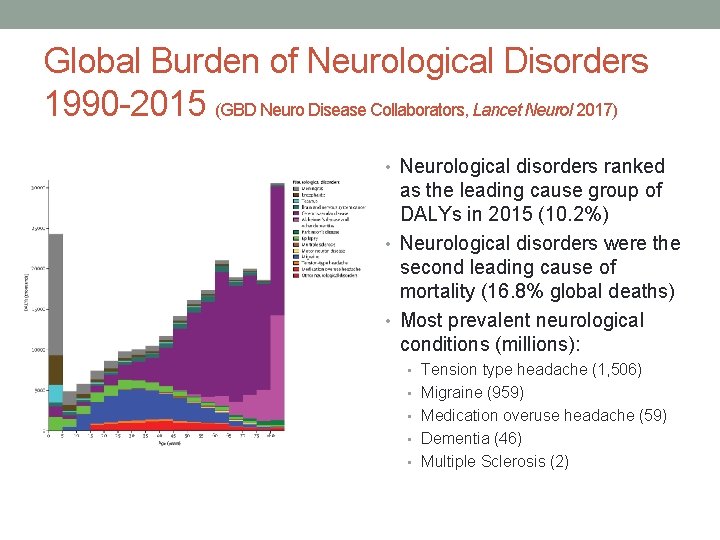
Global Burden of Neurological Disorders 1990 -2015 (GBD Neuro Disease Collaborators, Lancet Neurol 2017) • Neurological disorders ranked as the leading cause group of DALYs in 2015 (10. 2%) • Neurological disorders were the second leading cause of mortality (16. 8% global deaths) • Most prevalent neurological conditions (millions): • Tension type headache (1, 506) • Migraine (959) • Medication overuse headache (59) • Dementia (46) • Multiple Sclerosis (2)
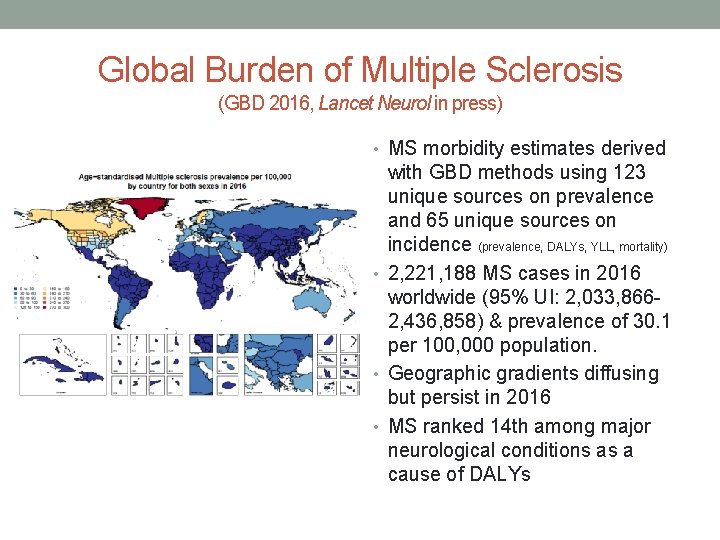
Global Burden of Multiple Sclerosis (GBD 2016, Lancet Neurol in press) • MS morbidity estimates derived with GBD methods using 123 unique sources on prevalence and 65 unique sources on incidence (prevalence, DALYs, YLL, mortality) • 2, 221, 188 MS cases in 2016 worldwide (95% UI: 2, 033, 8662, 436, 858) & prevalence of 30. 1 per 100, 000 population. • Geographic gradients diffusing but persist in 2016 • MS ranked 14 th among major neurological conditions as a cause of DALYs
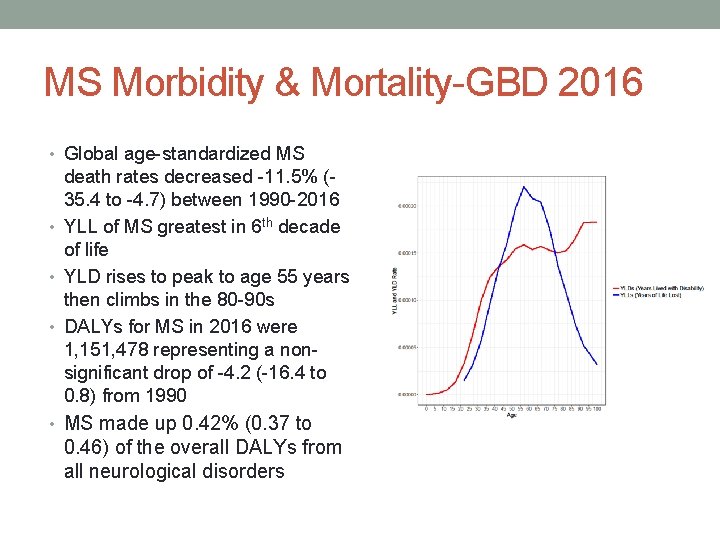
MS Morbidity & Mortality-GBD 2016 • Global age-standardized MS death rates decreased -11. 5% (35. 4 to -4. 7) between 1990 -2016 • YLL of MS greatest in 6 th decade of life • YLD rises to peak to age 55 years then climbs in the 80 -90 s • DALYs for MS in 2016 were 1, 151, 478 representing a nonsignificant drop of -4. 2 (-16. 4 to 0. 8) from 1990 • MS made up 0. 42% (0. 37 to 0. 46) of the overall DALYs from all neurological disorders
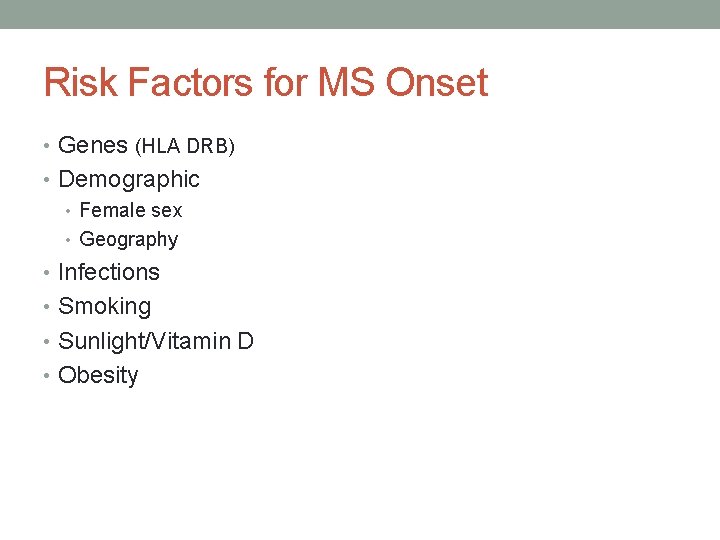
Risk Factors for MS Onset • Genes (HLA DRB) • Demographic • Female sex • Geography • Infections • Smoking • Sunlight/Vitamin D • Obesity
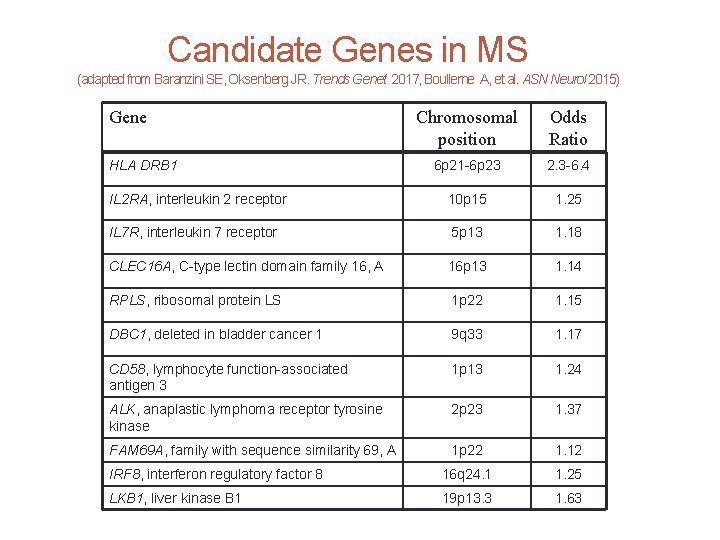
Candidate Genes in MS (adapted from Baranzini SE, Oksenberg JR. Trends Genet 2017, Boullerne A, et al. ASN Neurol 2015) Gene Chromosomal position Odds Ratio 6 p 21 -6 p 23 2. 3 -6. 4 IL 2 RA, interleukin 2 receptor 10 p 15 1. 25 IL 7 R, interleukin 7 receptor 5 p 13 1. 18 CLEC 16 A, C-type lectin domain family 16, A 16 p 13 1. 14 RPLS, ribosomal protein LS 1 p 22 1. 15 DBC 1, deleted in bladder cancer 1 9 q 33 1. 17 CD 58, lymphocyte function-associated antigen 3 1 p 13 1. 24 ALK, anaplastic lymphoma receptor tyrosine kinase 2 p 23 1. 37 FAM 69 A, family with sequence similarity 69, A 1 p 22 1. 12 IRF 8, interferon regulatory factor 8 16 q 24. 1 1. 25 LKB 1, liver kinase B 1 19 p 13. 3 1. 63 HLA DRB 1
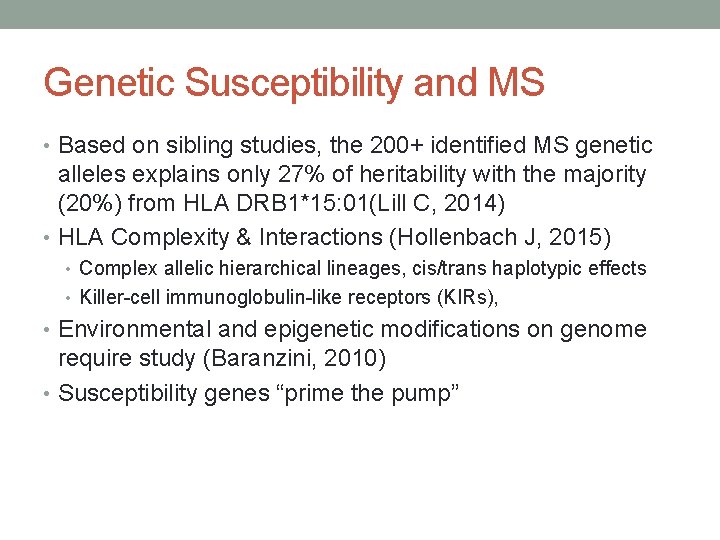
Genetic Susceptibility and MS • Based on sibling studies, the 200+ identified MS genetic alleles explains only 27% of heritability with the majority (20%) from HLA DRB 1*15: 01(Lill C, 2014) • HLA Complexity & Interactions (Hollenbach J, 2015) • Complex allelic hierarchical lineages, cis/trans haplotypic effects • Killer-cell immunoglobulin-like receptors (KIRs), • Environmental and epigenetic modifications on genome require study (Baranzini, 2010) • Susceptibility genes “prime the pump”
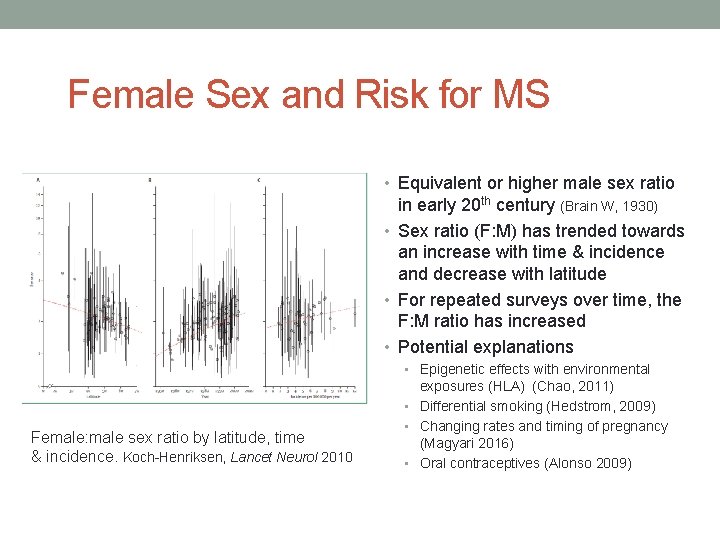
Female Sex and Risk for MS • Equivalent or higher male sex ratio in early 20 th century (Brain W, 1930) • Sex ratio (F: M) has trended towards an increase with time & incidence and decrease with latitude • For repeated surveys over time, the F: M ratio has increased • Potential explanations • Epigenetic effects with environmental Female: male sex ratio by latitude, time & incidence. Koch-Henriksen, Lancet Neurol 2010 exposures (HLA) (Chao, 2011) • Differential smoking (Hedstrom, 2009) • Changing rates and timing of pregnancy (Magyari 2016) • Oral contraceptives (Alonso 2009)
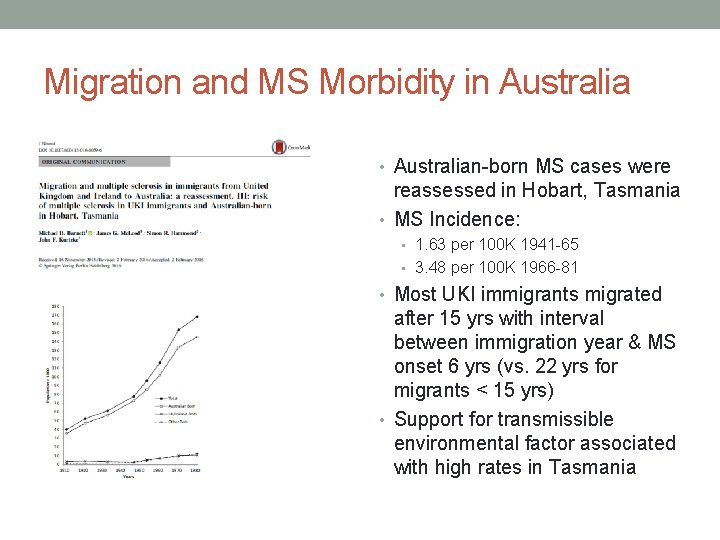
Migration and MS Morbidity in Australia • Australian-born MS cases were reassessed in Hobart, Tasmania • MS Incidence: • 1. 63 per 100 K 1941 -65 • 3. 48 per 100 K 1966 -81 • Most UKI immigrants migrated after 15 yrs with interval between immigration year & MS onset 6 yrs (vs. 22 yrs for migrants < 15 yrs) • Support for transmissible environmental factor associated with high rates in Tasmania
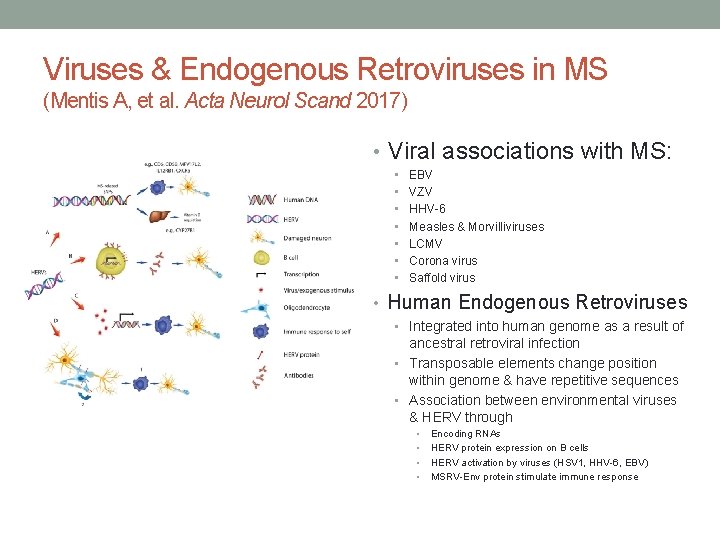
Viruses & Endogenous Retroviruses in MS (Mentis A, et al. Acta Neurol Scand 2017) • Viral associations with MS: • EBV • VZV • HHV-6 • Measles & Morvilliviruses • LCMV • Corona virus • Saffold virus • Human Endogenous Retroviruses • Integrated into human genome as a result of ancestral retroviral infection • Transposable elements change position within genome & have repetitive sequences • Association between environmental viruses & HERV through • • Encoding RNAs HERV protein expression on B cells HERV activation by viruses (HSV 1, HHV-6, EBV) MSRV-Env protein stimulate immune response
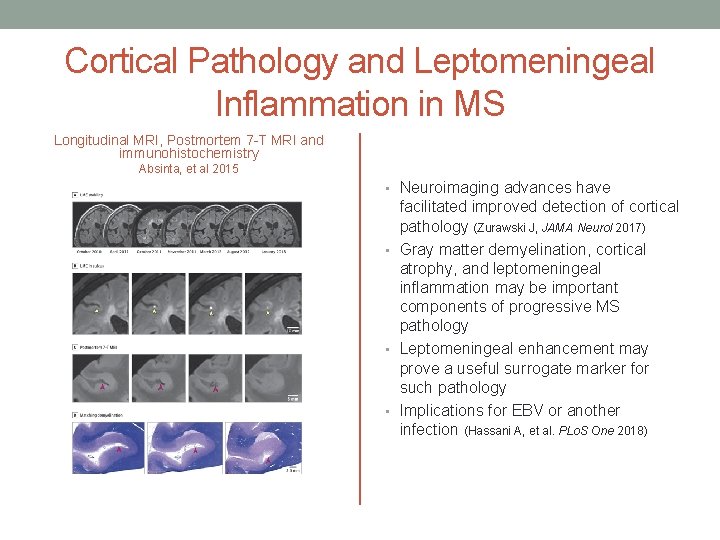
Cortical Pathology and Leptomeningeal Inflammation in MS Longitudinal MRI, Postmortem 7 -T MRI and immunohistochemistry Absinta, et al 2015 • Neuroimaging advances have facilitated improved detection of cortical pathology (Zurawski J, JAMA Neurol 2017) • Gray matter demyelination, cortical atrophy, and leptomeningeal inflammation may be important components of progressive MS pathology • Leptomeningeal enhancement may prove a useful surrogate marker for such pathology • Implications for EBV or another infection (Hassani A, et al. PLo. S One 2018)
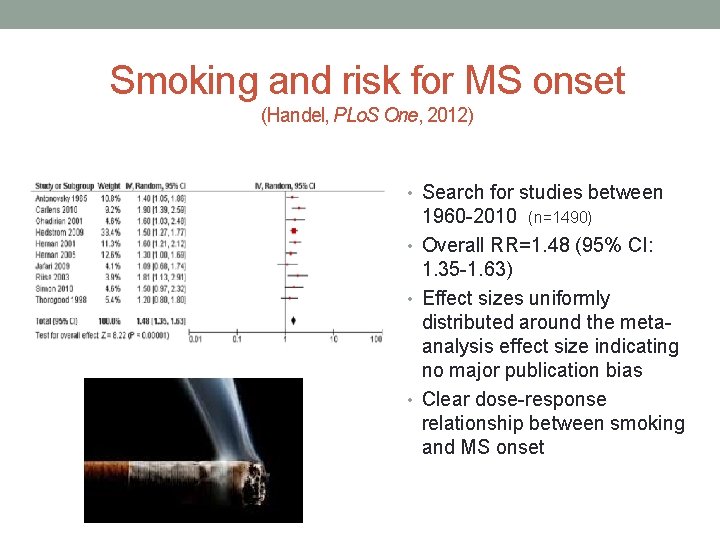
Smoking and risk for MS onset (Handel, PLo. S One, 2012) • Search for studies between 1960 -2010 (n=1490) • Overall RR=1. 48 (95% CI: 1. 35 -1. 63) • Effect sizes uniformly distributed around the metaanalysis effect size indicating no major publication bias • Clear dose-response relationship between smoking and MS onset
Obesity & MS Risk for Onset n For women in the Nurses Health Study, obesity at age 18 years was associated with a 2. 25 adjusted RR (95% CI: 1. 50 -3. 37) for MS onset. (Munger, Neurology 2009) n A Swedish population-based case-control study found a two-fold significant risk for MS in men and women with BMI > 27 kg/m 2 at age 20 years (Hedstrom, Mult Scler 2012) n In a pediatric MS cohort in Kaiser Southern California, obesity was associated with an increased odds of developing CIS/MS in girls (Langer-Gould A, Neurology 2013): • Overweight vs. normal weight: OR: 1. 58 (95% CI: 0. 71 -3. 50) • Moderately obese : OR 1. 78 (95% CI: 0. 70 -4. 49) • Moderately obese vs. normal weight: OR 3. 76 (95% CI: 1. 549. 16)
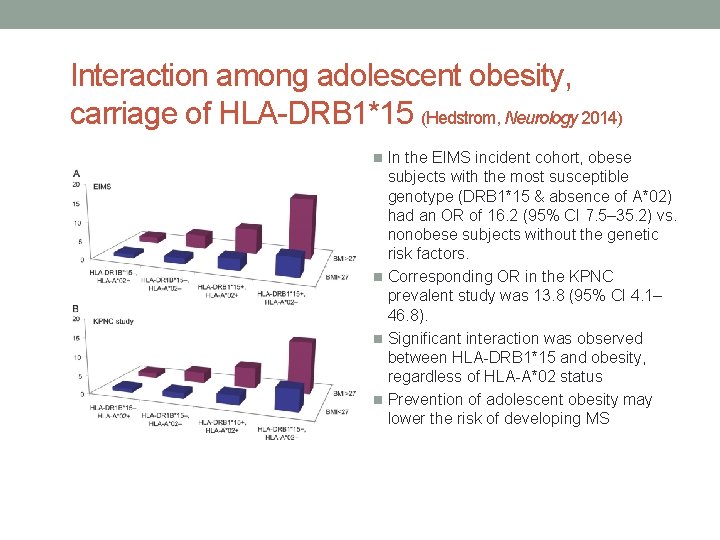
Interaction among adolescent obesity, carriage of HLA-DRB 1*15 (Hedstrom, Neurology 2014) n In the EIMS incident cohort, obese subjects with the most susceptible genotype (DRB 1*15 & absence of A*02) had an OR of 16. 2 (95% CI 7. 5– 35. 2) vs. nonobese subjects without the genetic risk factors. n Corresponding OR in the KPNC prevalent study was 13. 8 (95% CI 4. 1– 46. 8). n Significant interaction was observed between HLA-DRB 1*15 and obesity, regardless of HLA-A*02 status n Prevention of adolescent obesity may lower the risk of developing MS
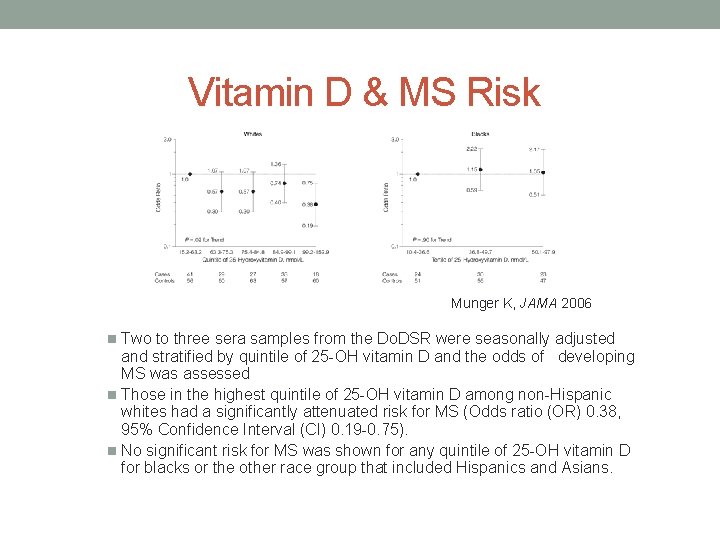
Vitamin D & MS Risk Munger K, JAMA 2006 n Two to three sera samples from the Do. DSR were seasonally adjusted and stratified by quintile of 25 -OH vitamin D and the odds of developing MS was assessed n Those in the highest quintile of 25 -OH vitamin D among non-Hispanic whites had a significantly attenuated risk for MS (Odds ratio (OR) 0. 38, 95% Confidence Interval (CI) 0. 19 -0. 75). n No significant risk for MS was shown for any quintile of 25 -OH vitamin D for blacks or the other race group that included Hispanics and Asians.
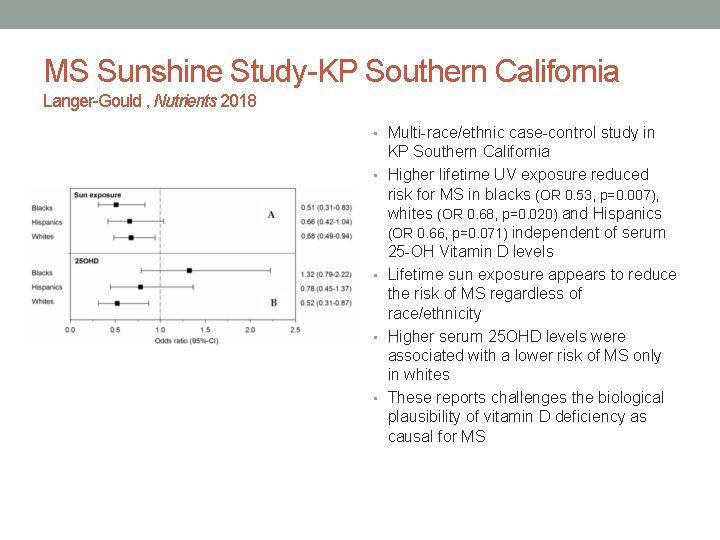
MS Sunshine Study-KP Southern California Langer-Gould , Nutrients 2018 • Multi-race/ethnic case-control study in • • KP Southern California Higher lifetime UV exposure reduced risk for MS in blacks (OR 0. 53, p=0. 007), whites (OR 0. 68, p=0. 020) and Hispanics (OR 0. 66, p=0. 071) independent of serum 25 -OH Vitamin D levels Lifetime sun exposure appears to reduce the risk of MS regardless of race/ethnicity Higher serum 25 OHD levels were associated with a lower risk of MS only in whites These reports challenges the biological plausibility of vitamin D deficiency as causal for MS
Vitamin D and MS Onset • Optimal dose and normal range of Vitamin D not clear (IOM, 2011) • Differences in polymorphisms in vitamin D-binding protein gene and bio-available Vitamin D between racial groups (Powe, 2013) • Reverse causation between Vitamin D and MS not ruled out • Goal of 40 nmol/L 25 -OH for adults is reasonable
New Trends in MS Epidemiology Conclusions • MS prevalence is higher than previously reported in many world regions. Lower mortality is in part driving this trend. • Geographic gradients for MS risk persist • Use of algorithms with large population datasets will provide a basis for efficient morbidity and mortality surveillance in the future (US Neurological Disease Surveillance System, Public Law 114 -255) • Modifiable risk factor for MS onset should be targeted for MS prevention: smoking, obesity, sunlight exposure • Use of large diverse cohorts of MS cases and controls with appropriate technology should be used to understand risk factors that trigger and perpetuate MS
40 US Department of Veterans Affairs Multiple Sclerosis Centers of Excellence Mission: To support and maintain the health, independence, quality of life and productivity of Veterans with MS through clinical care, education, research and informatics. Purpose: Coordinate clinical, educational and research activity across VHA; providing consultative direction on care, promoting collaborative research and utilizing VHA big data to study the disease course. Multiple Sclerosis System of Care-VHA Directive 1011. 06 (April 2017)
Multiple Sclerosis Centers of Excellence • Multiple Sclerosis Co. E- East: (Baltimore, MD & Washington, DC) Special expertise in basic science research, imaging, epidemiology and telehealth. • Multiple Sclerosis Co. E- West: (Portland, OR & Seattle, WA) Special expertise in translational research, clinical research, rehabilitation, and integrative medicine.
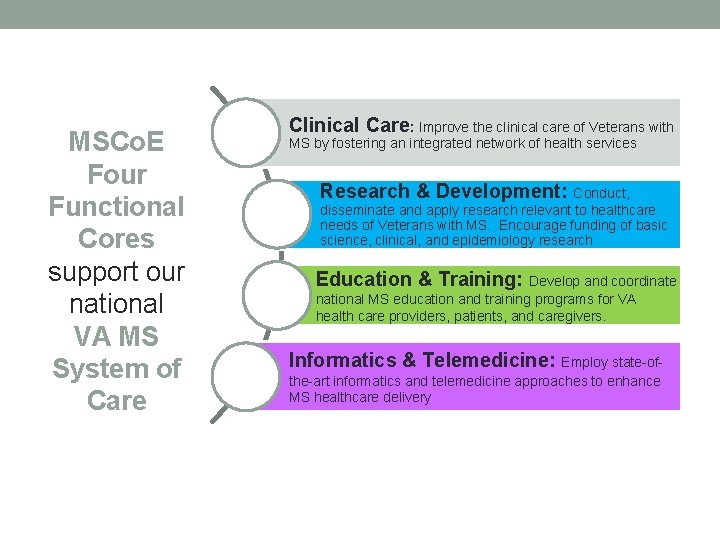
MSCo. E Four Functional Cores support our national VA MS System of Care Clinical Care: Improve the clinical care of Veterans with MS by fostering an integrated network of health services Research & Development: Conduct, disseminate and apply research relevant to healthcare needs of Veterans with MS. Encourage funding of basic science, clinical, and epidemiology research Education & Training: Develop and coordinate national MS education and training programs for VA health care providers, patients, and caregivers. Informatics & Telemedicine: Employ state-ofthe-art informatics and telemedicine approaches to enhance MS healthcare delivery
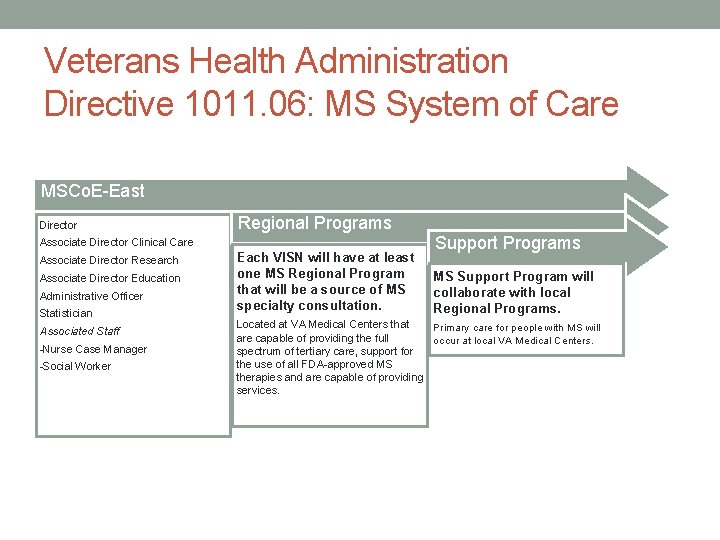
Veterans Health Administration Directive 1011. 06: MS System of Care MSCo. E-East Director Regional Programs Associate Director Clinical Care Associate Director Research Associate Director Education Administrative Officer Statistician Associated Staff -Nurse Case Manager -Social Worker Each VISN will have at least one MS Regional Program that will be a source of MS specialty consultation. Support Programs MS Support Program will collaborate with local Regional Programs. Located at VA Medical Centers that Primary care for people with MS will are capable of providing the full occur at local VA Medical Centers. spectrum of tertiary care, support for the use of all FDA-approved MS therapies and are capable of providing services.
Clinical Care • VHA Handbook 1011. 06: MS System of Care Procedures • 18, 000 -20, 000 patients with MS annually (40, 000 unique patients since 1998) • National Consultations (e-consults) and telehealth • MS Disease Management: safe access to all FDA approved Disease Modifying Therapies: • Pharmacy Benefits Management Criteria for Use • Monitoring guidelines • Cost of Medications vs. Private Sector • Coordinate Regional Programs and Support Program Network
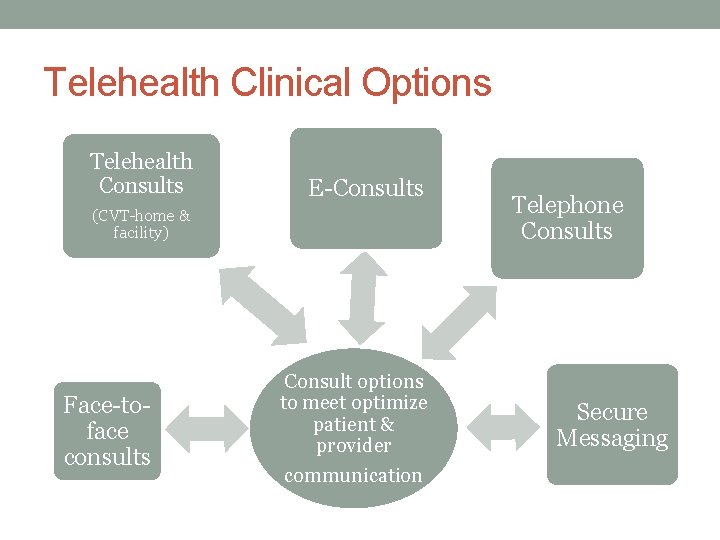
Telehealth Clinical Options Telehealth Consults E-Consults (CVT-home & facility) Face-toface consults Consult options to meet optimize patient & provider communication Telephone Consults Secure Messaging
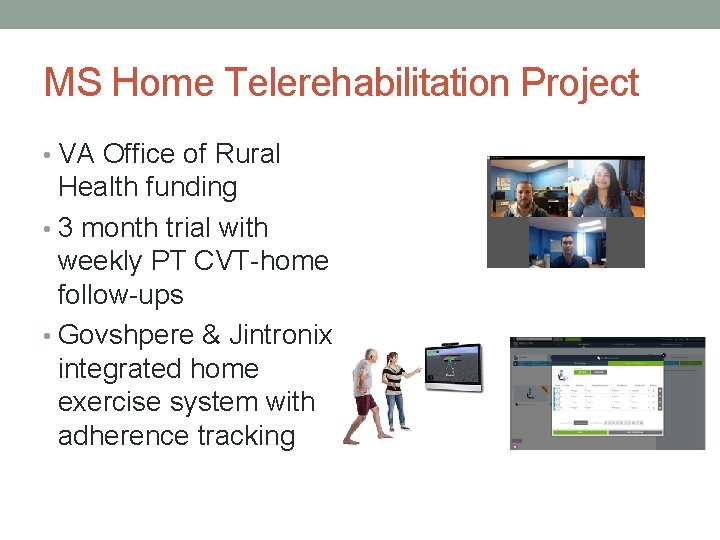
MS Home Telerehabilitation Project • VA Office of Rural Health funding • 3 month trial with weekly PT CVT-home follow-ups • Govshpere & Jintronix integrated home exercise system with adherence tracking
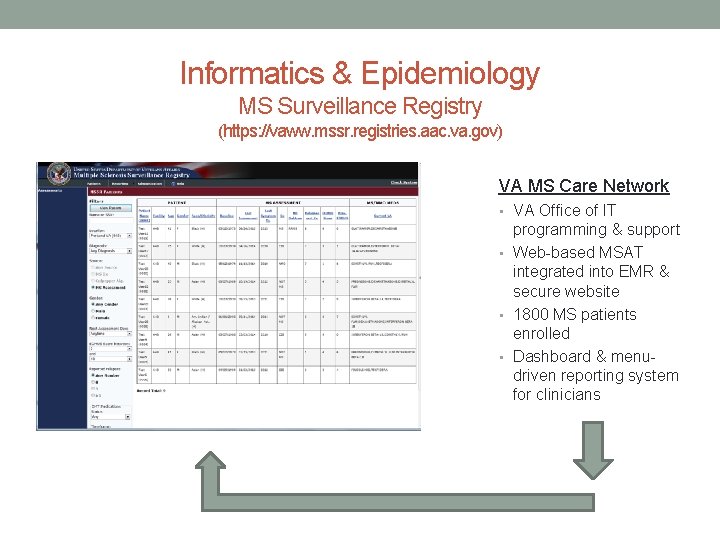
Informatics & Epidemiology MS Surveillance Registry (https: //vaww. mssr. registries. aac. va. gov) VA MS Care Network • VA Office of IT programming & support • Web-based MSAT integrated into EMR & secure website • 1800 MS patients enrolled • Dashboard & menudriven reporting system for clinicians

Research & Development • Research Studies: Bench and Clinical • Neuroimmunology • Health Services and Epidemiology • Rehabilitation • Clinical trials • Grants and Publications: unique VA/Do. D funding sources • Mentoring • Opportunities for collaboration
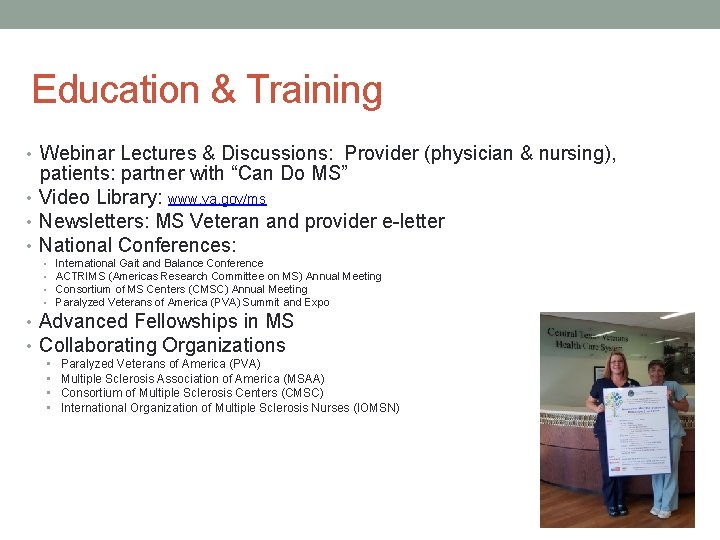
Education & Training • Webinar Lectures & Discussions: Provider (physician & nursing), patients: partner with “Can Do MS” • Video Library: www. va. gov/ms • Newsletters: MS Veteran and provider e-letter • National Conferences: International Gait and Balance Conference ACTRIMS (Americas Research Committee on MS) Annual Meeting Consortium of MS Centers (CMSC) Annual Meeting Paralyzed Veterans of America (PVA) Summit and Expo • • • Advanced Fellowships in MS • Collaborating Organizations • • Paralyzed Veterans of America (PVA) Multiple Sclerosis Association of America (MSAA) Consortium of Multiple Sclerosis Centers (CMSC) International Organization of Multiple Sclerosis Nurses (IOMSN)
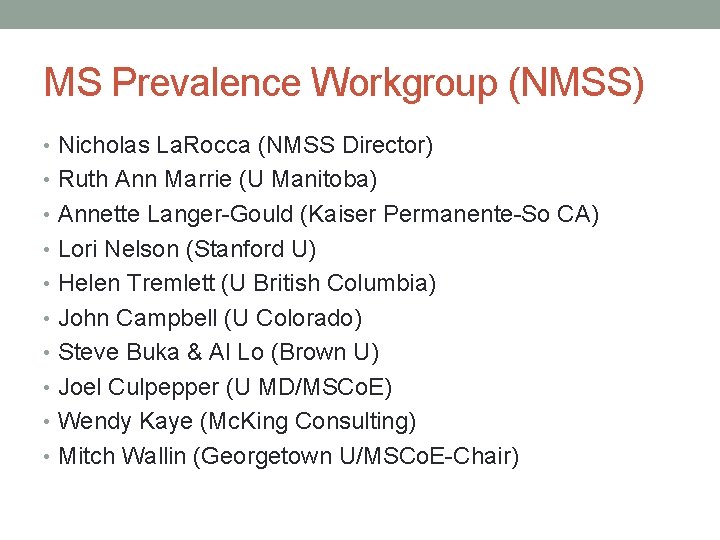
MS Prevalence Workgroup (NMSS) • Nicholas La. Rocca (NMSS Director) • Ruth Ann Marrie (U Manitoba) • Annette Langer-Gould (Kaiser Permanente-So CA) • Lori Nelson (Stanford U) • Helen Tremlett (U British Columbia) • John Campbell (U Colorado) • Steve Buka & Al Lo (Brown U) • Joel Culpepper (U MD/MSCo. E) • Wendy Kaye (Mc. King Consulting) • Mitch Wallin (Georgetown U/MSCo. E-Chair)
Neuroepidemiology Research Collaborators Global Burden of Disease Neurology Collaborators: • Kate Muller, MPH • Theo Vos, MD, MS, Ph. D • Mari Smith • VA MSCo. E and University of Maryland, George Washington University, Johns Hopkins University and University of Washington School of Medicine • Kate Fitzgerald, Ph. D • Jodie Haselkorn, MD, MPH • Heidi Maloni, Ph. D • Shan Jin, Ph. D • VA Office of Post Deployment Health. Washington, DC • Joel Culpepper, Ph. D • Aaron Schneiderman, Ph. D • Funding: VA Merit Review, NMSS, VA MSCo. E, Biogen-Idec, Bill & Melinda Gates
- Slides: 51