
New Probabilistic Snow Products Coming to NWS Websites
New Probabilistic Snow Products Coming to NWS Websites National Weather Service Weather Forecast Office GSP National Weather Service GSP
Generally speaking, precipitation forecasts are good to a factor of 2 If there is a lot of model agreement, the uncertainty is less, and if there is a lot of model disagreement, the uncertainty is greater. Probabilistic products are an attempt to communicate this. National Weather Service GSP

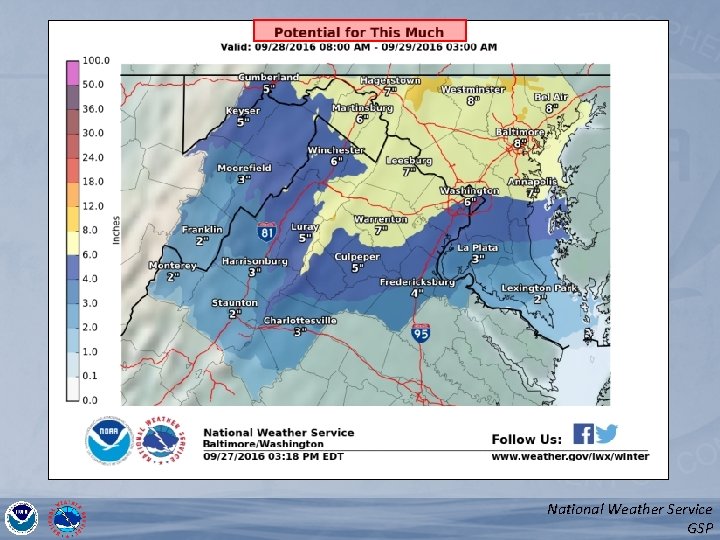
Three Products - Winter 2016 -2017 1) Minimum / Most Likely / Maximum Snowfall Expect at least this much Potential for this much • “Goal Posts” of Possibilities • NWS Forecast Is the Most Likely Forecast 2) Chance that Snow Will Be Greater Than… • 0. 1”, 2”, 4”, 8”, 12” and 18” 3) Locality Tables • Info for Several Locations in Each County Will be available here: weather. gov/gsp/winter (weather. gov/btv/winter currently works) National Weather Service GSP

Range of Possibilities {use local CWA example if available} National Weather Service GSP
National Weather Service GSP
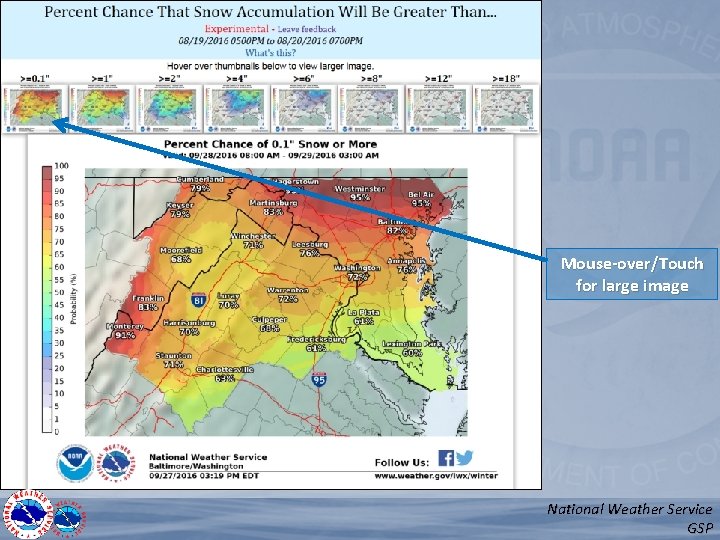
Mouse-over/Touch for large image National Weather Service GSP
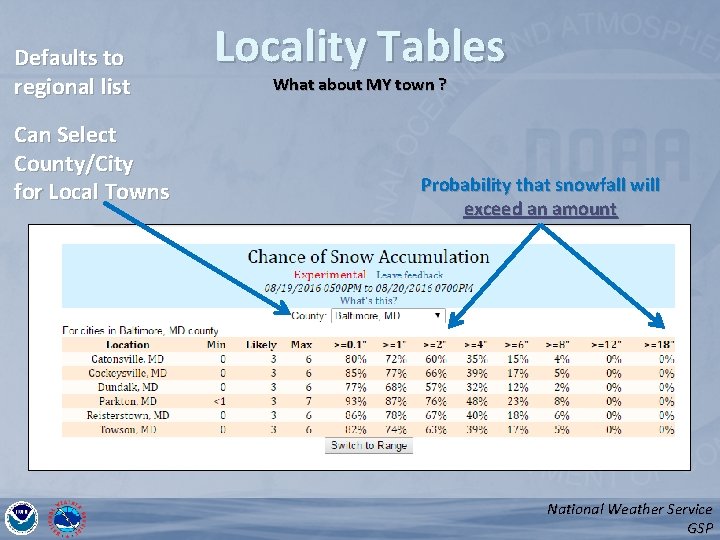
Defaults to regional list Can Select County/City for Local Towns Locality Tables What about MY town ? Probability that snowfall will exceed an amount National Weather Service GSP
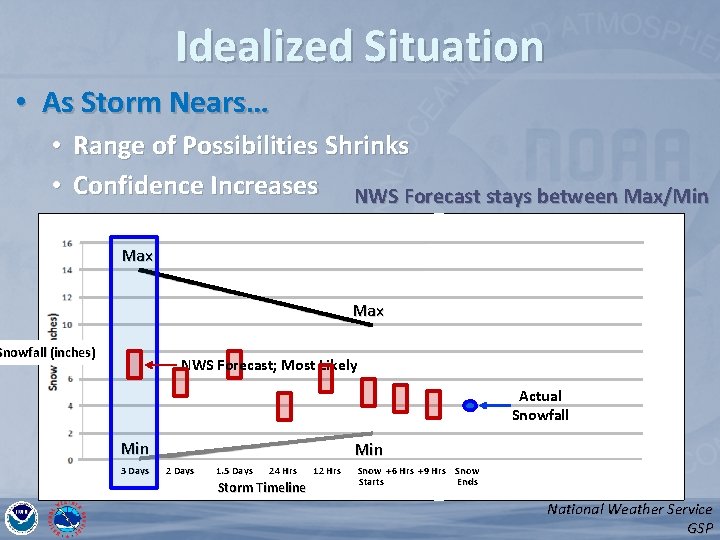
Idealized Situation • As Storm Nears… • Range of Possibilities Shrinks • Confidence Increases NWS Forecast stays between Max/Min Max Max Snowfall (inches) NWS Forecast; Most Likely Actual Snowfall Min 3 Days Min 2 Days 1. 5 Days 24 Hrs Storm Timeline 12 Hrs Snow +6 Hrs +9 Hrs Snow Starts Ends National Weather Service GSP
Example National Weather Service GSP
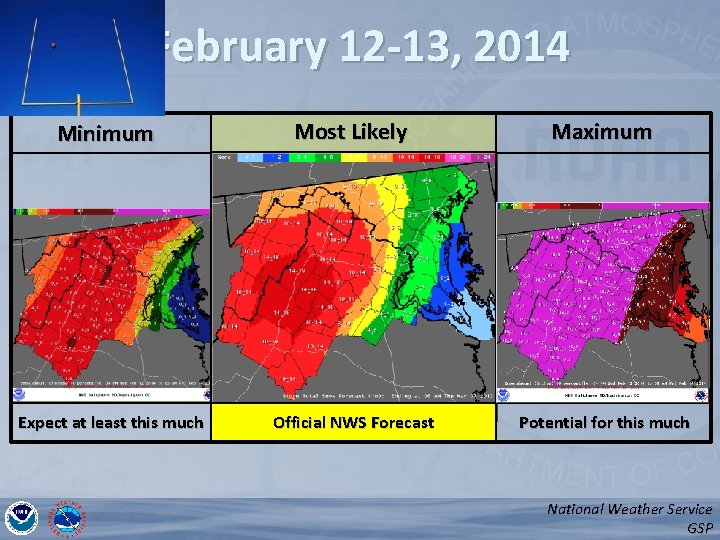
February 12 -13, 2014 Minimum Expect at least this much Most Likely Maximum Official NWS Forecast Potential for this much National Weather Service GSP
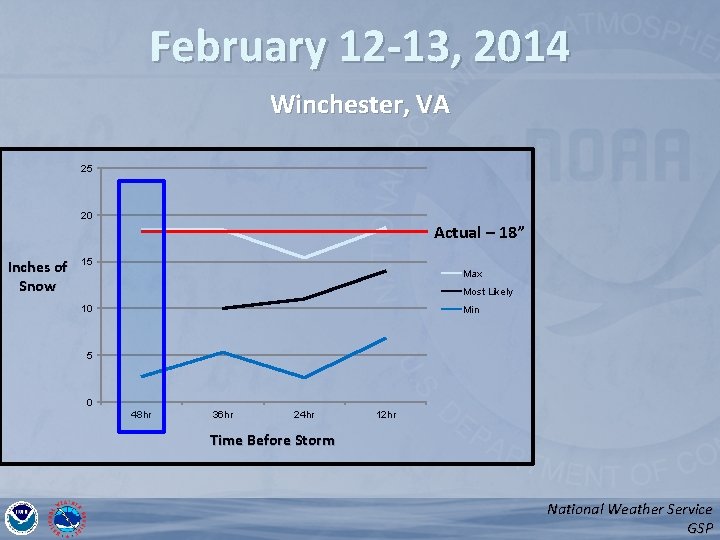
February 12 -13, 2014 Winchester, VA 25 20 Inches of Snow Actual – 18” 15 Max Most Likely 10 Min 5 0 48 hr 36 hr 24 hr 12 hr Time Before Storm National Weather Service GSP
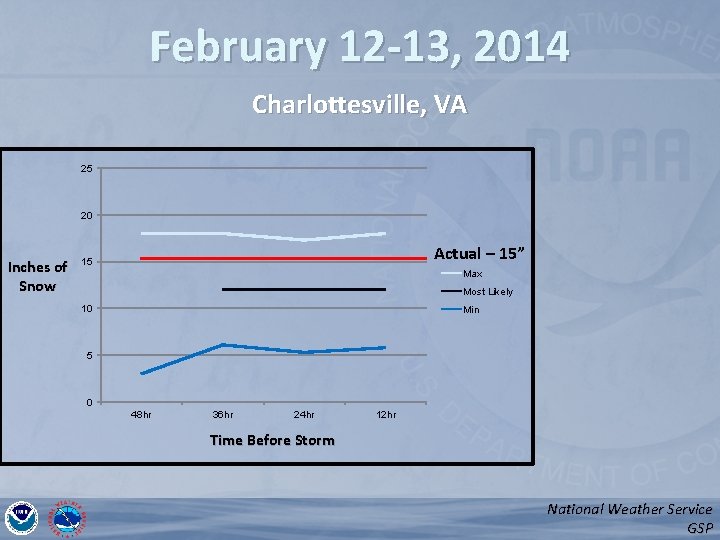
February 12 -13, 2014 Charlottesville, VA 25 20 Inches of Snow Actual – 15” 15 Max Most Likely 10 Min 5 0 48 hr 36 hr 24 hr 12 hr Time Before Storm National Weather Service GSP
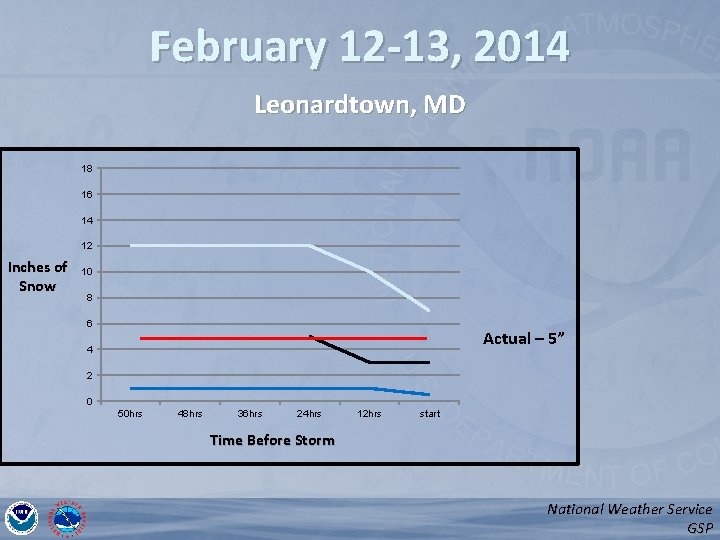
February 12 -13, 2014 Leonardtown, MD 18 16 14 12 Inches of Snow 10 8 6 Actual – 5” 4 2 0 50 hrs 48 hrs 36 hrs 24 hrs 12 hrs start Time Before Storm National Weather Service GSP
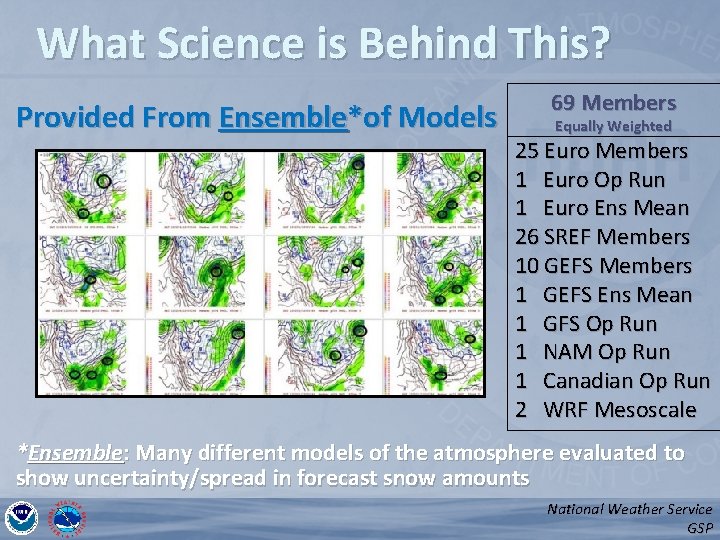
What Science is Behind This? Provided From Ensemble*of Models 69 Members Equally Weighted 25 Euro Members 1 Euro Op Run 1 Euro Ens Mean 26 SREF Members 10 GEFS Members 1 GEFS Ens Mean 1 GFS Op Run 1 NAM Op Run 1 Canadian Op Run 2 WRF Mesoscale *Ensemble: Many different models of the atmosphere evaluated to show uncertainty/spread in forecast snow amounts National Weather Service GSP
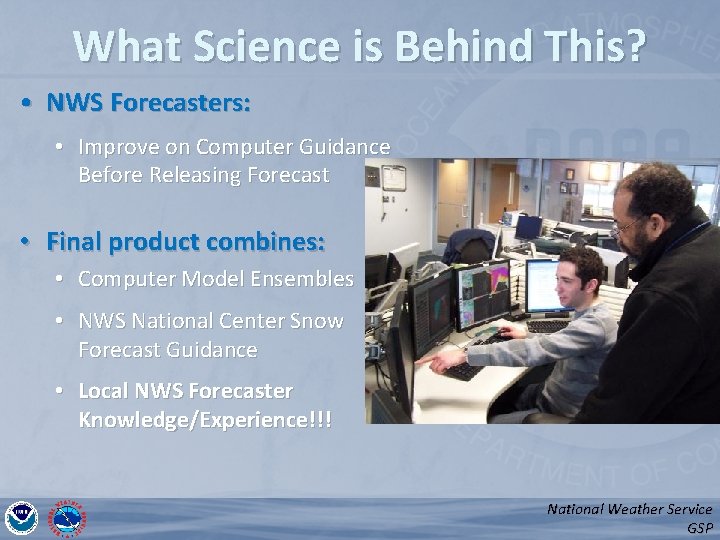
What Science is Behind This? • NWS Forecasters: • Improve on Computer Guidance Before Releasing Forecast • Final product combines: • Computer Model Ensembles • NWS National Center Snow Forecast Guidance • Local NWS Forecaster Knowledge/Experience!!! National Weather Service GSP
Summary • Three New Products (In addition to what we routinely produce) – Minimum - Expect at least this much Most Likely - Maximum Potential for this much – Chance of Exceeding X Inches – Locality Table • New Winter Weather Webpage – http: //weather. gov/gsp/winter/ • Communicating Uncertainty Enables Better Decisions – Minimize Winter’s Impact on the Region National Weather Service GSP
- Slides: 16