New Measurements of the Hyperfine Interactions and Dipole


 + -0. 00210(52) · (v")

- Slides: 19
New Measurements of the Hyperfine Interactions and Dipole Moment of KI Ben Mc. Donald, Advisor: Professor James Cederberg
Charge Distribution The ultimate goal of our work was to find the field gradient acting on the nuclei in the molecule and the shapes of the charge distributions within the nuclei. Various Nuclear Moments. L to R: Quadrupole, Octuple, Hexadecapole Our work finds the constants that describe the shape of the charge and current distributions in the nucleus.
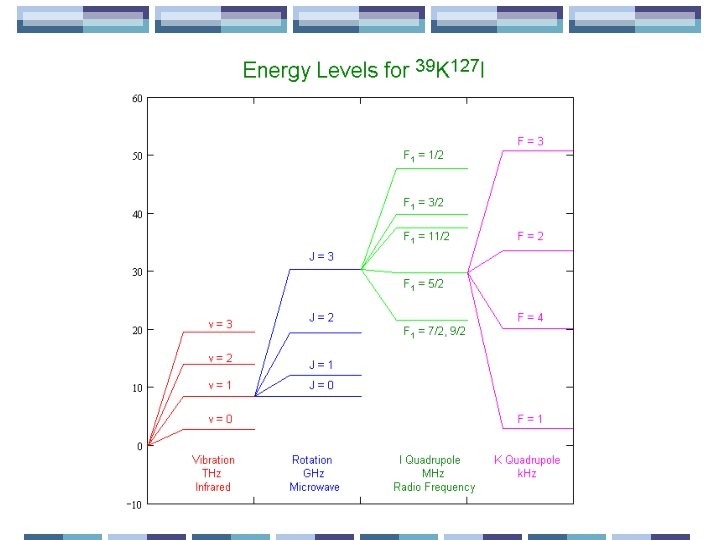
Energy States Hyperfine Our research focused on the Hyperfine energy transitions within the KI molecule. Rotational Vibrational Hyperfine
Inducing Transitions To find the different energy states, we measured the energy required to induce a transition. We do this by stimulating the KI with an electric field. Frequency corresponds to energy. Electric Field Initial State Final State Transition
Measuring Transitions We measure the number of molecules that don’t make a transition. At the frequency where a transition occurs, we measure a drop in the detector signal. We invert the image to see peaks.
Fitting Transitions We use software to fit lines to transition data using the Rabi function.
Taking the Data First, we used theoretical predictions to give a rough estimate of transition frequencies. Then, we performed an initial run that allowed a refinement of the molecular constants, which in turn improved our predictions for subsequent runs. Using this “bootstrapping” technique, we achieved an increase in precision of four orders of magnitude over previous measurements.
Stark Effect With RF and DC fields, we induced transitions within the hyperfine energy levels using the Stark Effect. We needed to fit these Stark splits to achieve the desired precision in pinpointing the hyperfine levels. The Stark Effect involves a change in the molecule’s energy levels due to a KI’s orientation relative to the RF and DC electric fields. Positive energy shift Negative energy shift
RF-induced Transitions After finding the desired range in frequency for a transition, we used the RF field to get a Stark splitting of the hyperfine energy levels. Fitting for this RF-induced Stark split gave a measurement of the RF factor. The RF factor is an indicator of the RF field’s behavior within the transition region of the beam.
RF-induced Transitions We fit RF Stark split data to obtain the RF factor.
DC-induced Transitions Once we found the correct RF factor, which was not under our control, we used it to help fit data from transitions due to the DC field, which was under our control.
The Dipole Moment The Stark splitting is proportional to the square of the dipole and the sum of the squares of the RF and DC fields. Since we knew about the Stark splits, the RF fields, and the DC fields, we then calculated a value for the dipole moment = 11. 064(14) + 0. 049(23)(v +½) debye
39 KI and 41 KI We found a mysterious shift in the nuclear electric quadrupole moment of Iodine when comparing 39 KI and 41 KI. 1 2 3 2 1 3
39 KI and 41 KI This is a fit of the same spectrum with frequencies adjusted for the transitions at 17938. 5 MHz, 17940. 5 MHz, and 17945 MHz. 1 2 3 2 1 3
Our Results Old Potassium e. Qq = -4120 k. Hz New Potassium e. Qq = -4294. 744 0. 022 k. Hz Old Iodine e. Qq = -85320 120 k. Hz New Iodine e. Qq = -85471. 144 0. 012 k. Hz
e. Qq The expanded e. Qq, or nuclear electric quadrupole interaction, for Iodine is -85471. 144(12) + -2860. 046(19) · (v + ½) + 22. 0761(63) · (v + ½)2 + 0. 03281(65) · (v + ½)3 + -0. 66608(67) · J(J + 1) + 0. 00549(59) · J(J + 1) · (v + ½) k. Hz and for Potassium, it is -4294. 744(22) + 27. 519(49) · (v + ½) + -0. 078(22) · (v + ½)2 + 0. 0010(17) · J(J + 1) k. Hz
Further Results K spin rotation interaction = 0. 10093(65) + -0. 00210(52) · (v + ½) + 0. 00044(19) · (v + ½)2 k. Hz I spin rotation interaction = 0. 88874(45) + -0. 00251(61) · (v + ½) + -0. 00013(24) · (v + ½)2 k. Hz Tensor spin-spin interaction = 0. 00920(69) + 0. 00081(52) · (v + ½) k. Hz Scalar spin-spin interaction = 0. 02329(36) + 0. 00049(38) · (v + ½) k. Hz
Thanks!