
New Insulin Formulations Guillermo Umpierrez MD FACP FACE
- Slides: 10
New Insulin Formulations Guillermo Umpierrez, MD, FACP, FACE Professor of Medicine Emory University School of Medicine Part 2
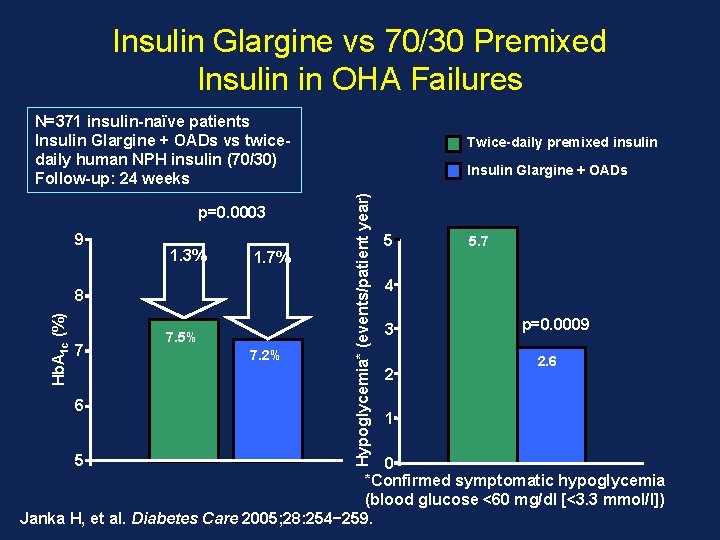
Insulin Glargine vs 70/30 Premixed Insulin in OHA Failures N=371 insulin-naïve patients Insulin Glargine + OADs vs twicedaily human NPH insulin (70/30) Follow-up: 24 weeks 9 1. 3% 1. 7% Hb. A 1 c (%) 8 7 6 5 7. 5% 7. 2% Insulin Glargine + OADs Hypoglycemia* (events/patient year) p=0. 0003 Twice-daily premixed insulin 5 5. 7 4 3 2 p=0. 0009 2. 6 1 0 *Confirmed symptomatic hypoglycemia (blood glucose <60 mg/dl [<3. 3 mmol/l]) Janka H, et al. Diabetes Care 2005; 28: 254− 259.
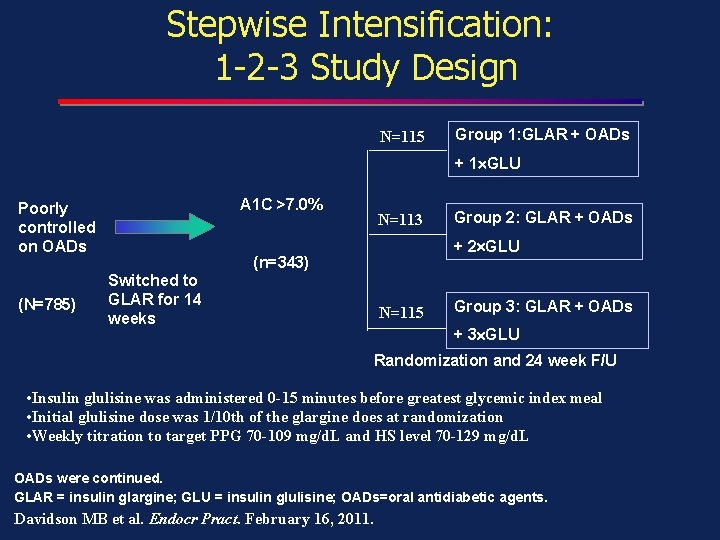
Stepwise Intensification: 1 -2 -3 Study Design N=115 Group 1: GLAR + OADs + 1 GLU A 1 C >7. 0% Poorly controlled on OADs (N=785) N=113 Group 2: GLAR + OADs + 2 GLU (n=343) Switched to GLAR for 14 weeks N=115 Group 3: GLAR + OADs + 3 GLU Randomization and 24 week F/U • Insulin glulisine was administered 0 -15 minutes before greatest glycemic index meal • Initial glulisine dose was 1/10 th of the glargine does at randomization • Weekly titration to target PPG 70 -109 mg/d. L and HS level 70 -129 mg/d. L OADs were continued. GLAR = insulin glargine; GLU = insulin glulisine; OADs=oral antidiabetic agents. Davidson MB et al. Endocr Pract. February 16, 2011.
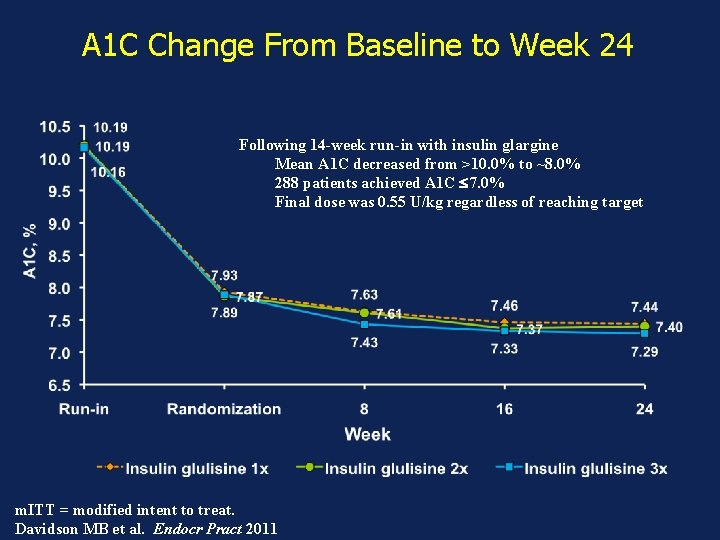
A 1 C Change From Baseline to Week 24 Following 14 -week run-in with insulin glargine Mean A 1 C decreased from >10. 0% to ~8. 0% 288 patients achieved A 1 C 7. 0% Final dose was 0. 55 U/kg regardless of reaching target m. ITT = modified intent to treat. Davidson MB et al. Endocr Pract 2011
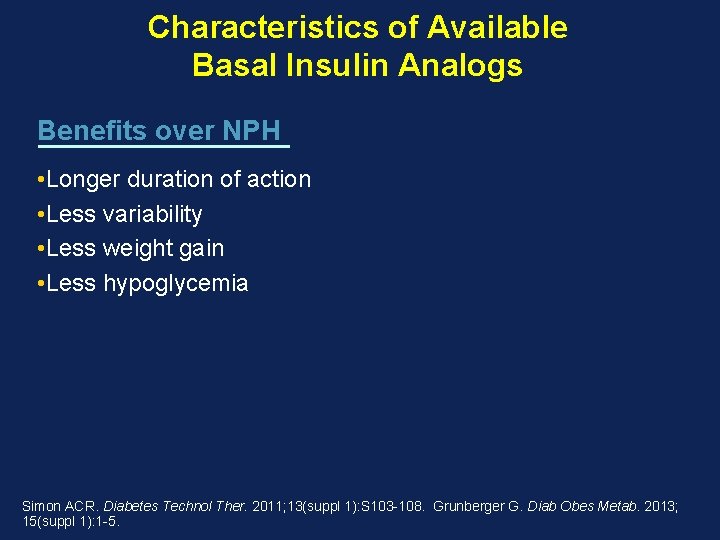
Characteristics of Available Basal Insulin Analogs Benefits over NPH Room for Improvement • Longer duration of action • Less variability • Less weight gain • Less hypoglycemia • More consistent 24+ hour coverage • Flat time-action profile • Less day-to-day variability • Less weight gain • Less hypoglycemia • More suppression of hepatic glucose production Simon ACR. Diabetes Technol Ther. 2011; 13(suppl 1): S 103 -108. Grunberger G. Diab Obes Metab. 2013; 15(suppl 1): 1 -5.
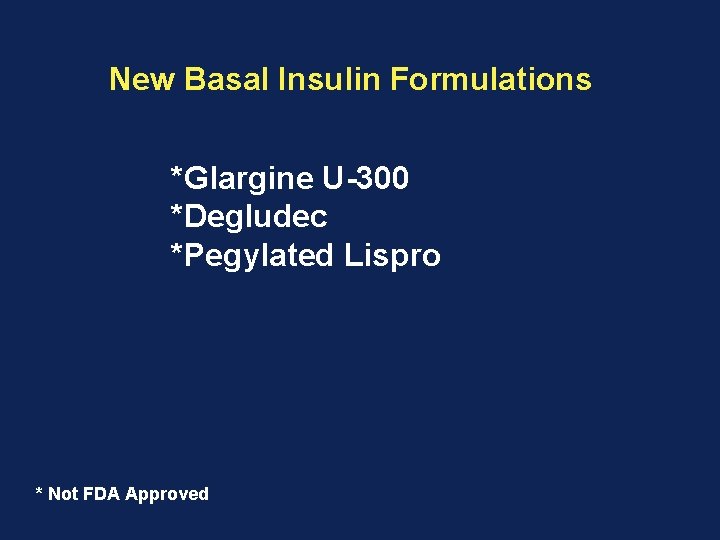
New Basal Insulin Formulations *Glargine U-300 *Degludec *Pegylated Lispro * Not FDA Approved
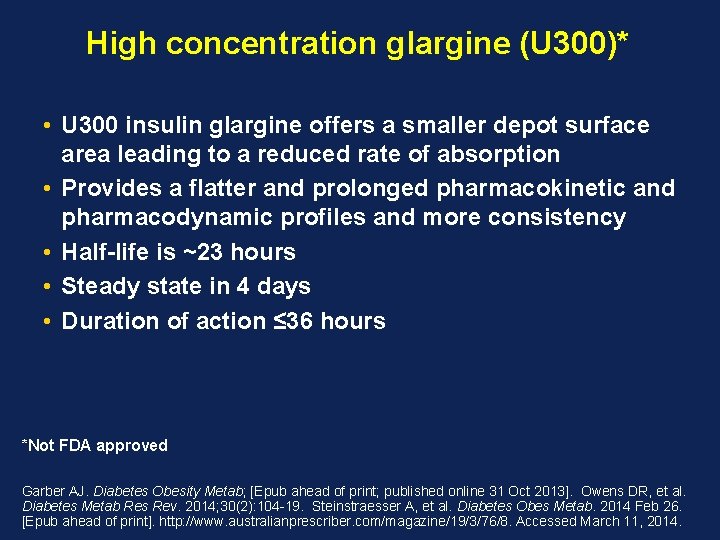
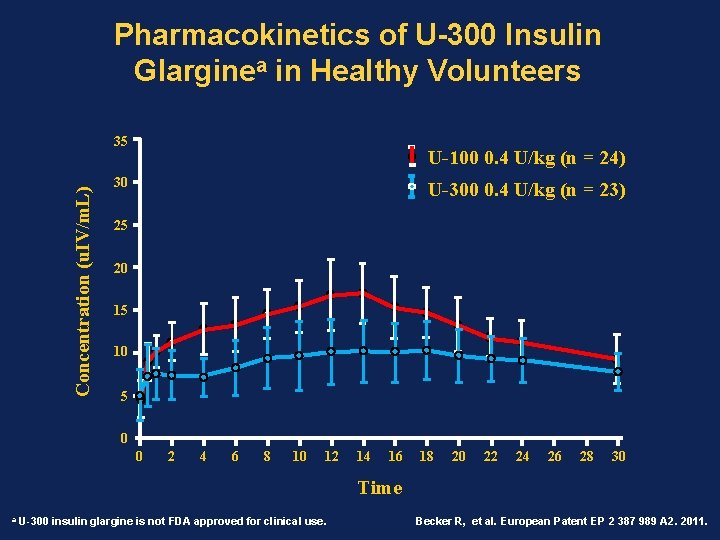
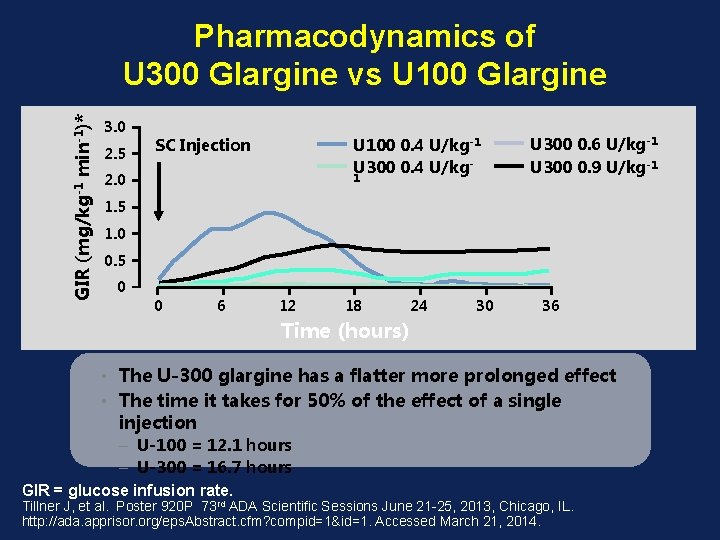
High concentration glargine (U 300)* • U 300 insulin glargine offers a smaller depot surface area leading to a reduced rate of absorption • Provides a flatter and prolonged pharmacokinetic and pharmacodynamic profiles and more consistency • Half-life is ~23 hours • Steady state in 4 days • Duration of action ≤ 36 hours *Not FDA approved Garber AJ. Diabetes Obesity Metab; [Epub ahead of print; published online 31 Oct 2013]. Owens DR, et al. Diabetes Metab Res Rev. 2014; 30(2): 104 -19. Steinstraesser A, et al. Diabetes Obes Metab. 2014 Feb 26. [Epub ahead of print]. http: //www. australianprescriber. com/magazine/19/3/76/8. Accessed March 11, 2014.
Pharmacokinetics of U-300 Insulin Glarginea in Healthy Volunteers Concentration (u. IV/m. L) 35 U-100 0. 4 U/kg (n = 24) 30 U-300 0. 4 U/kg (n = 23) 25 20 15 10 5 0 0 2 4 6 8 10 12 14 16 18 20 22 24 26 28 30 Time a U-300 insulin glargine is not FDA approved for clinical use. Becker R, et al. European Patent EP 2 387 989 A 2. 2011.
GIR (mg/kg-1 min-1)* Pharmacodynamics of U 300 Glargine vs U 100 Glargine 3. 0 2. 5 SC Injection U 100 0. 4 U/kg-1 U 300 0. 4 U/kg- 2. 0 1 U 300 0. 6 U/kg-1 U 300 0. 9 U/kg-1 1. 5 1. 0 0. 5 0 0 6 12 18 24 30 36 Time (hours) • The U-300 glargine has a flatter more prolonged effect • The time it takes for 50% of the effect of a single injection – U-100 = 12. 1 hours – U-300 = 16. 7 hours GIR = glucose infusion rate. Tillner J, et al. Poster 920 P 73 rd ADA Scientific Sessions June 21 -25, 2013, Chicago, IL. http: //ada. apprisor. org/eps. Abstract. cfm? compid=1&id=1. Accessed March 21, 2014.
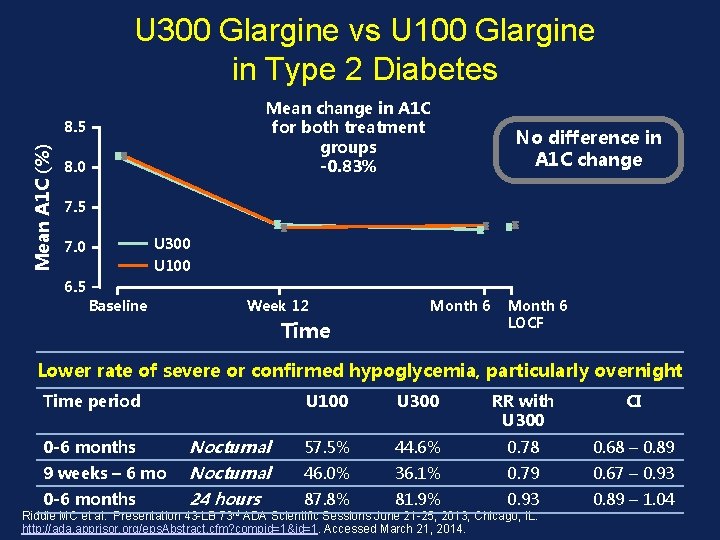
U 300 Glargine vs U 100 Glargine in Type 2 Diabetes Mean change in A 1 C for both treatment groups -0. 83% Mean A 1 C (%) 8. 5 8. 0 No difference in A 1 C change 7. 5 U 300 7. 0 U 100 6. 5 Baseline Week 12 Month 6 Time Month 6 LOCF Lower rate of severe or confirmed hypoglycemia, particularly overnight Time period U 100 U 300 RR with U 300 CI 0 -6 months Nocturnal 57. 5% 44. 6% 0. 78 0. 68 – 0. 89 9 weeks – 6 mo Nocturnal 46. 0% 36. 1% 0. 79 0. 67 – 0. 93 0 -6 months 24 hours 87. 8% 81. 9% 0. 93 0. 89 – 1. 04 Riddle MC et al. Presentation 43 -LB 73 rd ADA Scientific Sessions June 21 -25, 2013, Chicago, IL. http: //ada. apprisor. org/eps. Abstract. cfm? compid=1&id=1. Accessed March 21, 2014.