
New developments in the Graphical Turbulence Guidance GTG

New developments in the Graphical Turbulence Guidance (GTG) product Aviation Turbulence Workshop NCAR 28 Aug 2013 Robert Sharman NCAR/RAL Boulder, CO USA sharman@ucar. edu
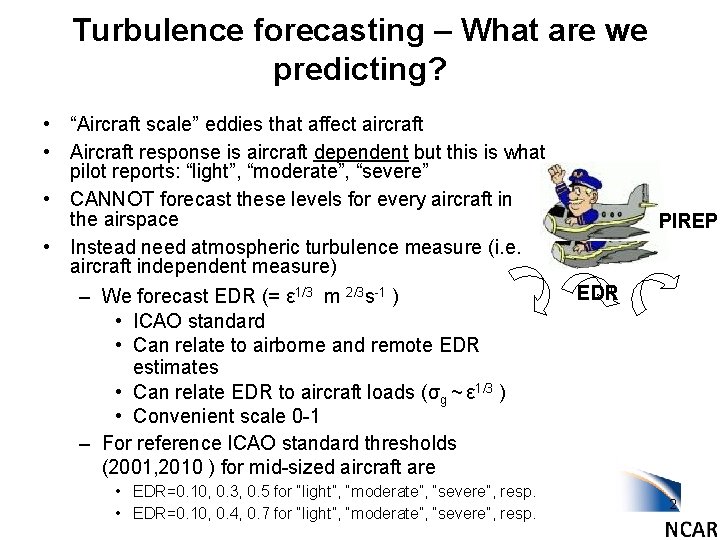
Turbulence forecasting – What are we predicting? • “Aircraft scale” eddies that affect aircraft • Aircraft response is aircraft dependent but this is what pilot reports: “light”, “moderate”, “severe” • CANNOT forecast these levels for every aircraft in the airspace • Instead need atmospheric turbulence measure (i. e. aircraft independent measure) – We forecast EDR (= ε 1/3 m 2/3 s-1 ) • ICAO standard • Can relate to airborne and remote EDR estimates • Can relate EDR to aircraft loads (σg ~ ε 1/3 ) • Convenient scale 0 -1 – For reference ICAO standard thresholds (2001, 2010 ) for mid-sized aircraft are • EDR=0. 10, 0. 3, 0. 5 for “light”, “moderate”, “severe”, resp. • EDR=0. 10, 0. 4, 0. 7 for “light”, “moderate”, “severe”, resp. PIREP EDR 2
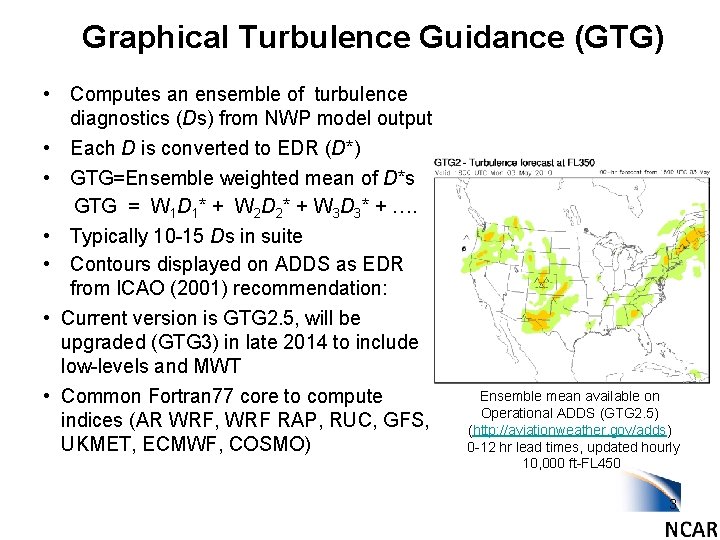
Graphical Turbulence Guidance (GTG) • Computes an ensemble of turbulence diagnostics (Ds) from NWP model output • Each D is converted to EDR (D*) • GTG=Ensemble weighted mean of D*s GTG = W 1 D 1* + W 2 D 2* + W 3 D 3* + …. • Typically 10 -15 Ds in suite • Contours displayed on ADDS as EDR from ICAO (2001) recommendation: • Current version is GTG 2. 5, will be upgraded (GTG 3) in late 2014 to include low-levels and MWT • Common Fortran 77 core to compute indices (AR WRF, WRF RAP, RUC, GFS, UKMET, ECMWF, COSMO) Ensemble mean available on Operational ADDS (GTG 2. 5) (http: //aviationweather. gov/adds) 0 -12 hr lead times, updated hourly 10, 000 ft-FL 450 3
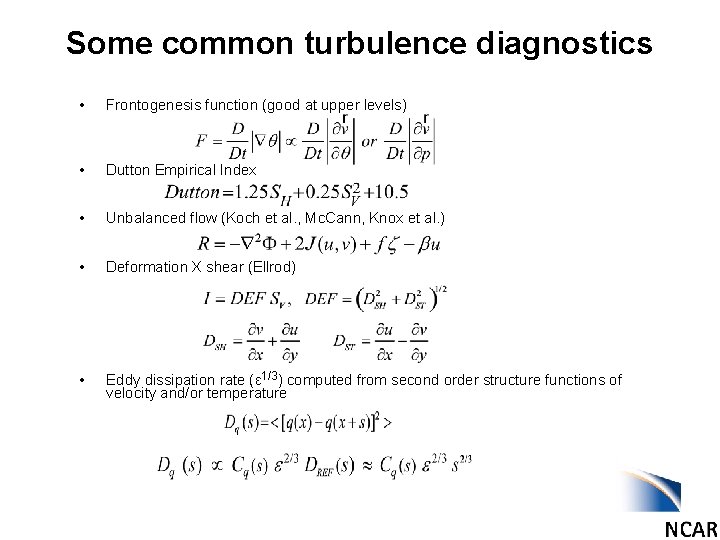
Some common turbulence diagnostics • Frontogenesis function (good at upper levels) • Dutton Empirical Index • Unbalanced flow (Koch et al. , Mc. Cann, Knox et al. ) • Deformation X shear (Ellrod) • Eddy dissipation rate (ε 1/3) computed from second order structure functions of velocity and/or temperature
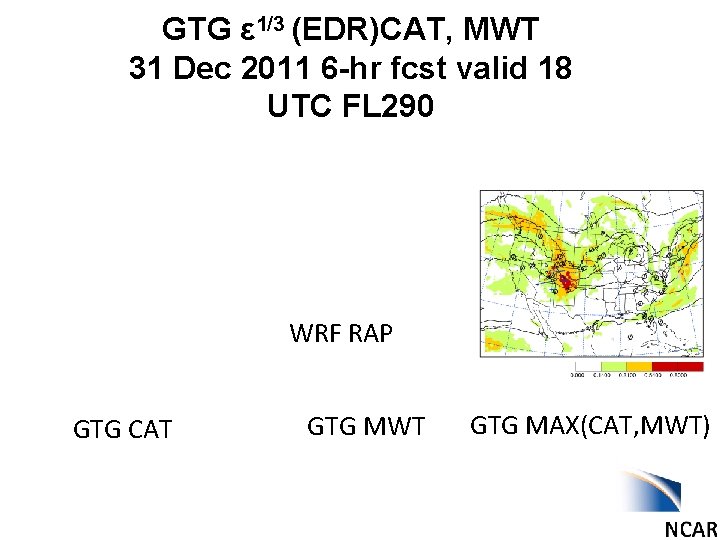
GTG ε 1/3 (EDR)CAT, MWT 31 Dec 2011 6 -hr fcst valid 18 UTC FL 290 WRF RAP GTG CAT GTG MWT GTG MAX(CAT, MWT)
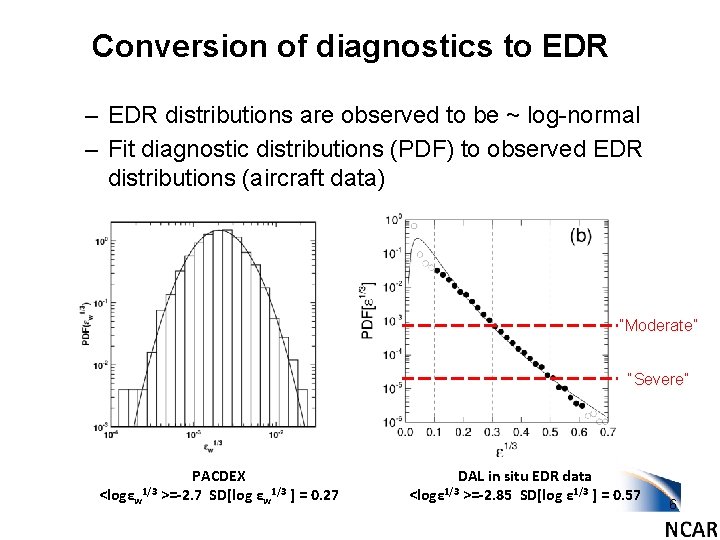
Conversion of diagnostics to EDR – EDR distributions are observed to be ~ log-normal – Fit diagnostic distributions (PDF) to observed EDR distributions (aircraft data) “Moderate” “Severe” <logεw 1/3 PACDEX >=-2. 7 SD[log εw 1/3 ] = 0. 27 DAL in situ EDR data >=-2. 85 SD[log ε 1/3 ] = 0. 57 <logε 1/3 6
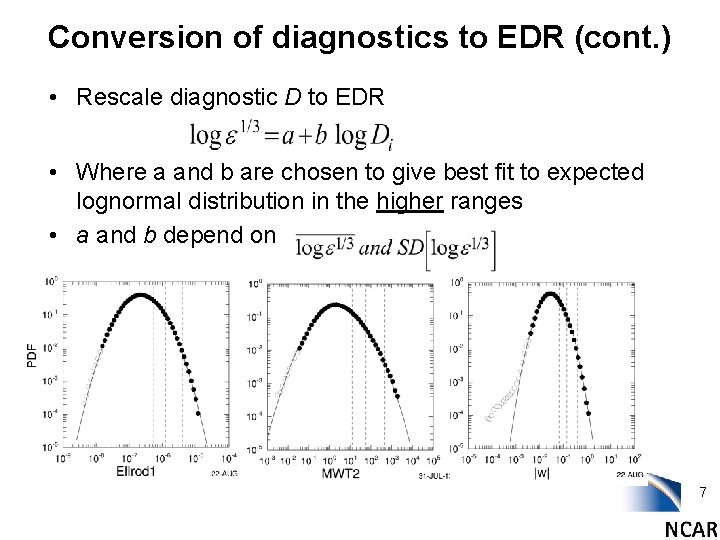
Conversion of diagnostics to EDR (cont. ) • Rescale diagnostic D to EDR • Where a and b are chosen to give best fit to expected lognormal distribution in the higher ranges • a and b depend on 7
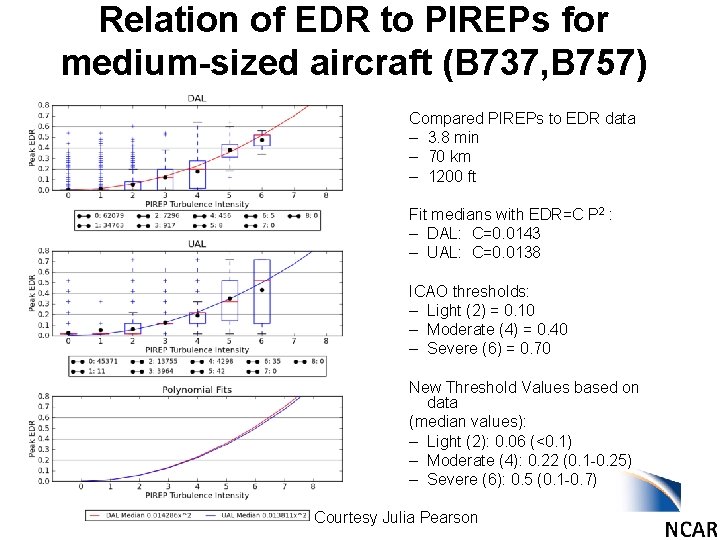
Relation of EDR to PIREPs for medium-sized aircraft (B 737, B 757) Compared PIREPs to EDR data – 3. 8 min – 70 km – 1200 ft Fit medians with EDR=C P 2 : – DAL: C=0. 0143 – UAL: C=0. 0138 ICAO thresholds: – Light (2) = 0. 10 – Moderate (4) = 0. 40 – Severe (6) = 0. 70 New Threshold Values based on data (median values): – Light (2): 0. 06 (<0. 1) – Moderate (4): 0. 22 (0. 1 -0. 25) – Severe (6): 0. 5 (0. 1 -0. 7) Courtesy Julia Pearson
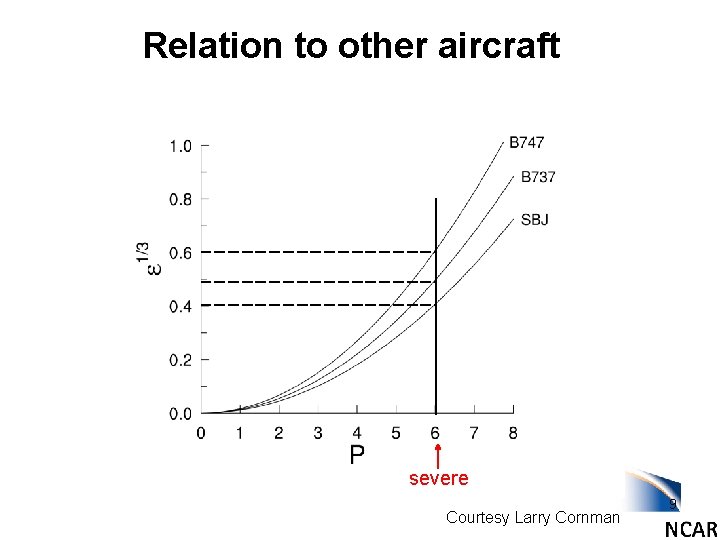
Relation to other aircraft severe Courtesy Larry Cornman 9
GTG 3 POD curves 6 -hr fcst (2 years) using both PIREPs and in situ EDR data + 60 min from forecast valid time High h>20, 000 ft Mid h=10 -20, 000 ft Low h<10, 000 ft
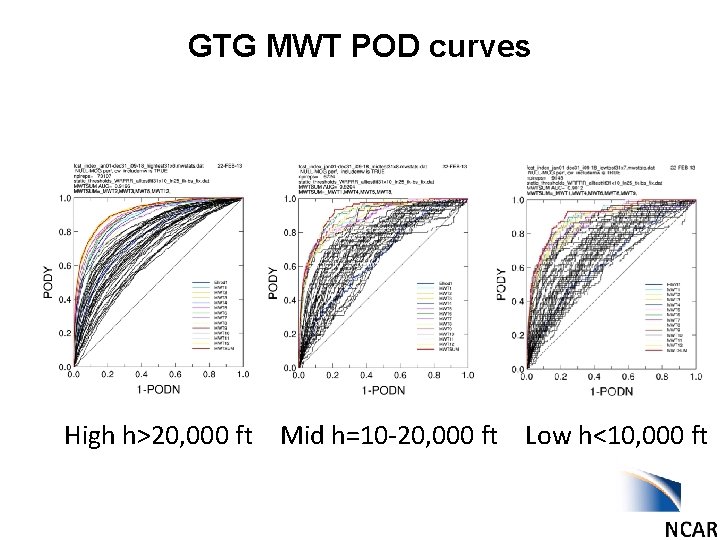
GTG MWT POD curves High h>20, 000 ft Mid h=10 -20, 000 ft Low h<10, 000 ft
GFS Global GTG UKMET ECMWF GTG output based on 3 global models for the same case. Contours are EDR (m 2/3 s-1) at FL 290 31 Dec 2011 6 -hr fcst valid 18 Z All models used native vertical grids All models used same number of diagnostics All models used same thresholds
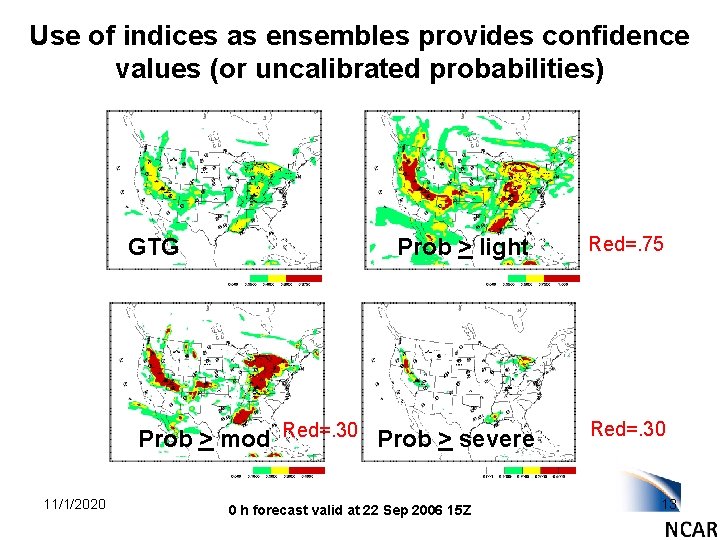
Use of indices as ensembles provides confidence values (or uncalibrated probabilities) Prob > light Red=. 75 Prob > mod Red=. 30 Prob > severe Red=. 30 GTG 11/1/2020 0 h forecast valid at 22 Sep 2006 15 Z 13
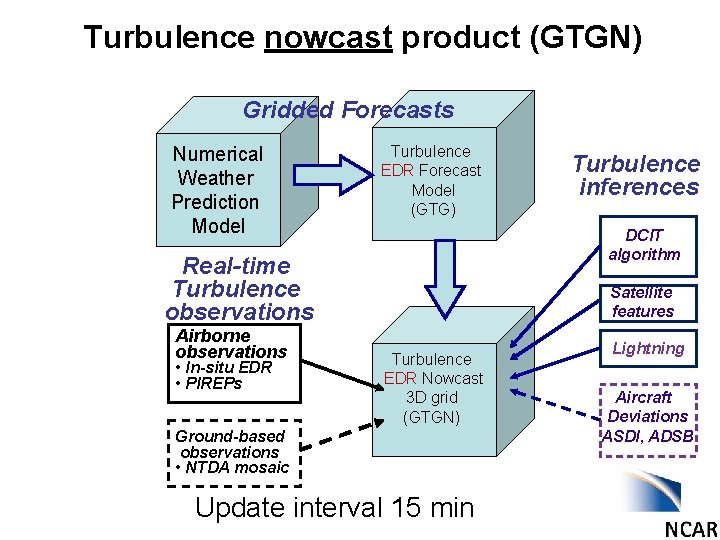
Turbulence nowcast product (GTGN) Gridded Forecasts Numerical Weather Prediction Model Turbulence EDR Forecast Model (GTG) DCIT algorithm Real-time Turbulence observations Airborne observations • In-situ EDR • PIREPs Turbulence inferences Satellite features Turbulence EDR Nowcast 3 D grid (GTGN) Ground-based observations • NTDA mosaic Update interval 15 min Lightning Aircraft Deviations ASDI, ADSB
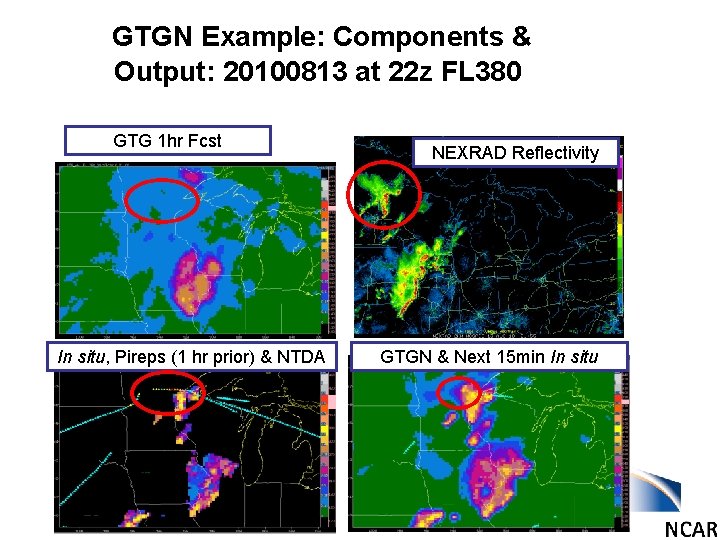
GTGN Example: Components & Output: 20100813 at 22 z FL 380 GTG 1 hr Fcst In situ, Pireps (1 hr prior) & NTDA NEXRAD Reflectivity GTGN & Next 15 min In situ
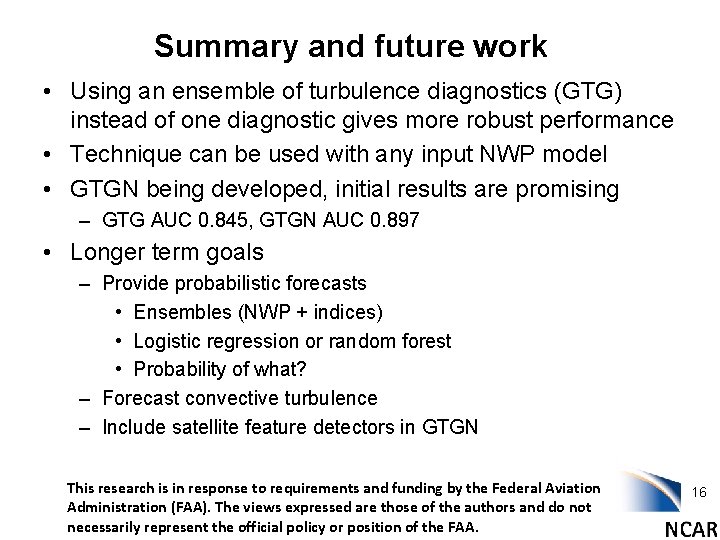
Summary and future work • Using an ensemble of turbulence diagnostics (GTG) instead of one diagnostic gives more robust performance • Technique can be used with any input NWP model • GTGN being developed, initial results are promising – GTG AUC 0. 845, GTGN AUC 0. 897 • Longer term goals – Provide probabilistic forecasts • Ensembles (NWP + indices) • Logistic regression or random forest • Probability of what? – Forecast convective turbulence – Include satellite feature detectors in GTGN This research is in response to requirements and funding by the Federal Aviation Administration (FAA). The views expressed are those of the authors and do not necessarily represent the official policy or position of the FAA. 16
- Slides: 16