
Network Science By Ralucca Gera NPS Excellence Through
Network Science By: Ralucca Gera, NPS Excellence Through Knowledge
Overview • Current research • Section 1: Graph theory: – Origins (Eulerian graphs) • Section 2: Complex networks: – Random graphs (Erdos-Renyi) – Small world graphs (Watts-Strogatz) – Scale free graphs (Barabasi-Albert) – The configuration model (Molloy-Reed)
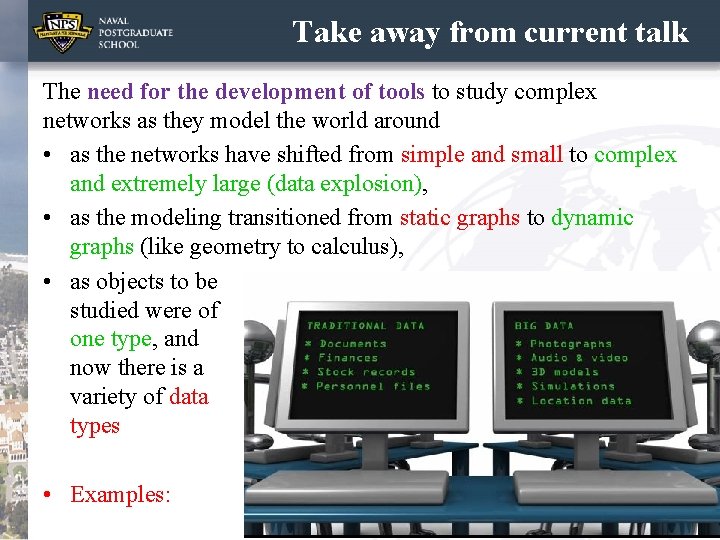
Take away from current talk The need for the development of tools to study complex networks as they model the world around • as the networks have shifted from simple and small to complex and extremely large (data explosion), • as the modeling transitioned from static graphs to dynamic graphs (like geometry to calculus), • as objects to be studied were of one type, and now there is a variety of data types • Examples: 3
Why Networks? • Nothing happens in isolation: “everything is connected, caused by, and interacting with a huge number of other pieces of a complex universal puzzle” (AL Barabasi, “Linked”) • The power of the network is in the links • However, most people don’t see the links till they are exposed to them (put your Net. Sci glasses on) 4
Why Network Science? • Newest science (20 years old or so) and a very active field, relevant to the type and amount of data available nowadays • Applicable to the study of the structural evolution of large networks • It studies networks holistically • Modeling phenomena around us using networks can be done in multiple ways and at different levels/depths • Can be used both for passive and active 5 measurements

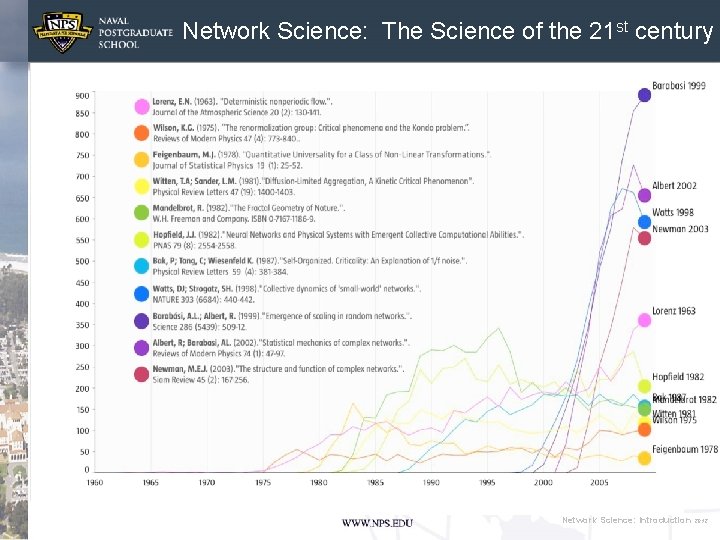
Original papers for Network Science • 1998: Watts-Strogatz paper in the most cited Nature publication from 1998; highlighted by ISI as one of the ten most cited papers in physics in the decade after its publication. • 1999: Barabasi and Albert paper is the most cited Science paper in 1999; highlighted by ISI as one of the ten most cited papers in physics in the decade after its publication. • 2001: Pastor -Satorras and Vespignani is one of the two most cited papers among the papers published in 2001 by Physical Review Letters. • 2002: Girvan-Newman is the most cited paper in 2002 Proceedings of the National Academy of Sciences. 6
Network Science: The Science of the 21 st century Network Science: Introduction 2012
Tools that CN uses: > Graph theory > Social network theory > Statistical physics > Computer science > Biology > Statistics > Sociology 8
Origins • 1735: Euler was puzzled by solving the bridges of Königsberg (origins of graph theory) • 1950: Erdos was puzzled by social networks structure • 1999: Barabasi was puzzle by the Internet • Now: we are puzzled by all of them (brain, social networks, communication and transportation networks) 9
Origins of graph theory Eulerian trails and circuits Graph Theory 10
The Origin of Graph Theory The Seven Bridges of Königsberg (the problem that is at the origin of graph theory) was posed by Leonhard Euler in 1735 (also prefigured the idea of topology) The citizens of Königsberg supposedly walked about on Sundays trying to find a route that crosses each bridge Königsberg of exactly once, and return to the starting point. 11
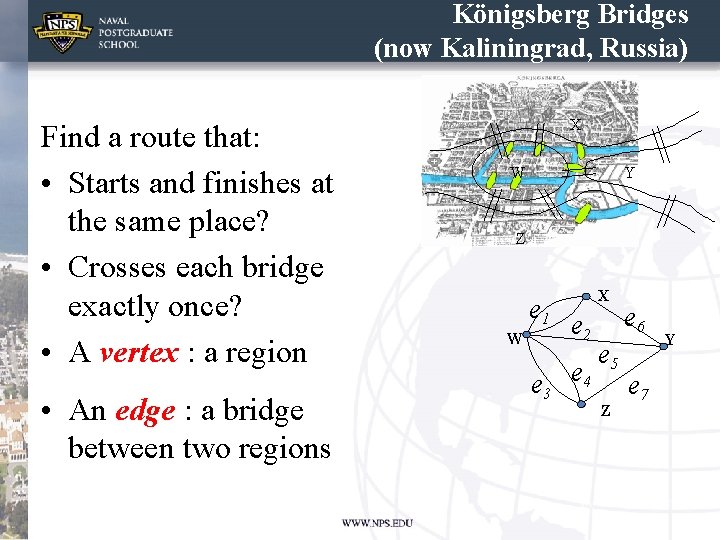
Königsberg Bridges (now Kaliningrad, Russia) Find a route that: • Starts and finishes at the same place? • Crosses each bridge exactly once? • A vertex : a region • An edge : a bridge between two regions X W Y Z e 1 W X e 2 e 3 e 4 e 5 Z e 6 e 7 Y
Section 2 Analysis of Complex Networks: Erdos-Renyi (ER) random graph model
From Simple to Complex Networks Simple graphs (the ones we have seen in graph theory): • have a small number of vertices, • which interact according to well understood laws • usually static in time (at least on small time intervals). Complex networks (no established definition): • very large and contain mixt type of data • evolve (In 1990 the WWW had only one page. Now it has a few billion pages) • generally display organization with no apparent external organizing principle being applied, and no internal control 14
Goals (for Complex Networks) Goals of studying complex networks • to extract emergent properties • to understand the function of such complex systems • to be able to predict changes in the network • to control how the network evolves In order to understand a complex system we need to grasp the network that models it. 15
Network/Graph Theory • The formulation of graph theory/networks is attributed to Euler (bridges of Königsberg) • Networks/graphs became more popular due in great part to Erdös. – Erdös interest in networks was also a puzzle (a social puzzle): What is the structure of social networks? • He formally introduced random graphs (1950 s): – graphs in which the existence of an edge is given with a probability p. 16
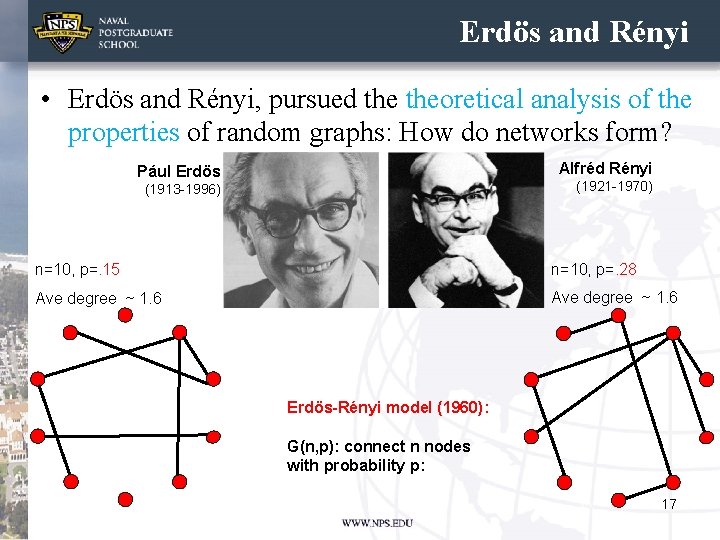
Erdös and Rényi • Erdös and Rényi, pursued theoretical analysis of the properties of random graphs: How do networks form? Alfréd Rényi Pául Erdös (1921 -1970) (1913 -1996) n=10, p=. 15 n=10, p=. 28 Ave degree ~ 1. 6 Erdös-Rényi model (1960): G(n, p): connect n nodes with probability p: 17
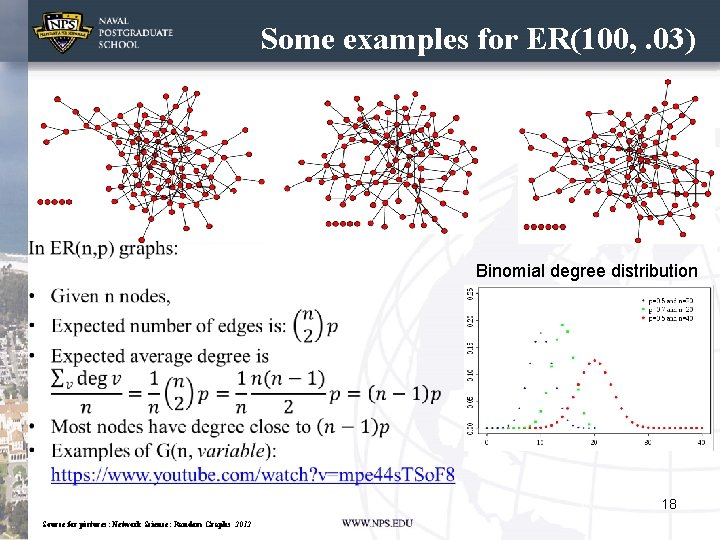
Some examples for ER(100, . 03) Binomial degree distribution 18 Source for pictures: Network Science: Random Graphs 2012
Erdos and Renyi’s work • They equated complexity with randomness. • Is that really the case? Do connections form at random with equal probably of attachment? – Researchers don’t believe that now (we’ll see why) – However it was a good model to begin with (still used today, in part due to the ease of analysis due to the independence of the edges being present). • Erdos and Renyi didn’t plan on providing universal theory for network formation, – rather the mathematical beauty got them intrigued more than capturing the way nature creates networks. 19
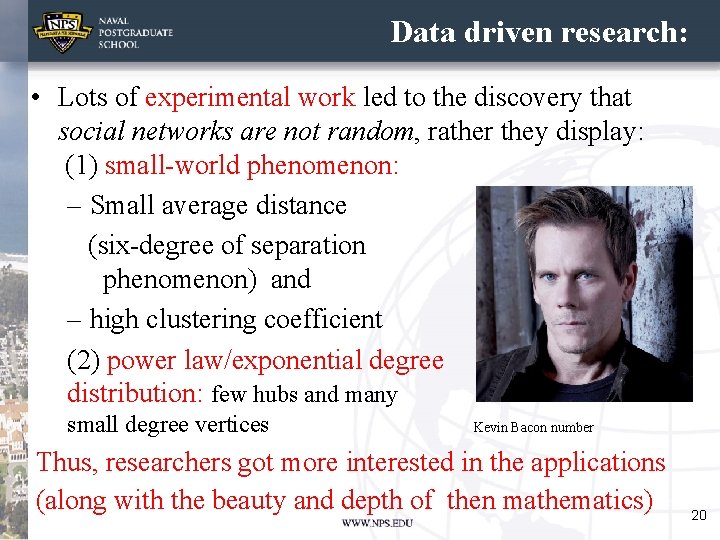
Data driven research: • Lots of experimental work led to the discovery that social networks are not random, rather they display: (1) small-world phenomenon: – Small average distance (six-degree of separation phenomenon) and – high clustering coefficient (2) power law/exponential degree distribution: few hubs and many small degree vertices Kevin Bacon number Thus, researchers got more interested in the applications (along with the beauty and depth of then mathematics) 20
Stanly Milgram's Experiment The 1 st experiment of this kind dates back to the 60 s: https: //www. youtube. com/watch? v=NRWSF 1 c 0 Ez 0 In 1967 Milgram (a Harvard psychology professor) got interested in studying the structure of social networks: What is the average path length for social networks? • Experiment: 296 random individuals from two US cities (Omaha, Nebraska and Wichita, Kansas), were asked to forward a letter to a target contact in Boston. • Results: – only 20 percent of the packages sent reached their target, – an average number of hops of 6 (although this number does not take into account the remaining 80 percent of the undelivered packages). 21
Stanly Milgram's Experiment (2) • His experiment was confined to US, linking people “out there” in Wichita and Omaha to “over here” in Boston • This was coined “small world” in network science • In 1991 a play by John Guare named “Everybody on this planet is separated by only six other people” – made the “six degree of separation” expression into a myth (yet famous) applied to the world since more people watch movies than read sociology. 22 Source: (Barabasi from “Linked”)
More Recently on small world: • The experiment was later reproduced by Dodds: – used email as a medium to collect data for resarch – at a more global scale (18 targets, 13 countries, 60 K participants) which resulted in 384 messages reaching their target, – yielding an average path length of 4. • Similar versions happened publicly, in the recent years, using FB and Linked. In social media. • Small world networks: https: //www. youtube. com/watch? v=Lq 5 hls. JAOfc 23
- Slides: 23