Network Measurement Jennifer Rexford COS 461 Computer Networks


- Slides: 35

Network Measurement Jennifer Rexford COS 461: Computer Networks Lectures: MW 10 -10: 50 am in Architecture N 101 http: //www. cs. princeton. edu/courses/archive/spr 12/cos 461/

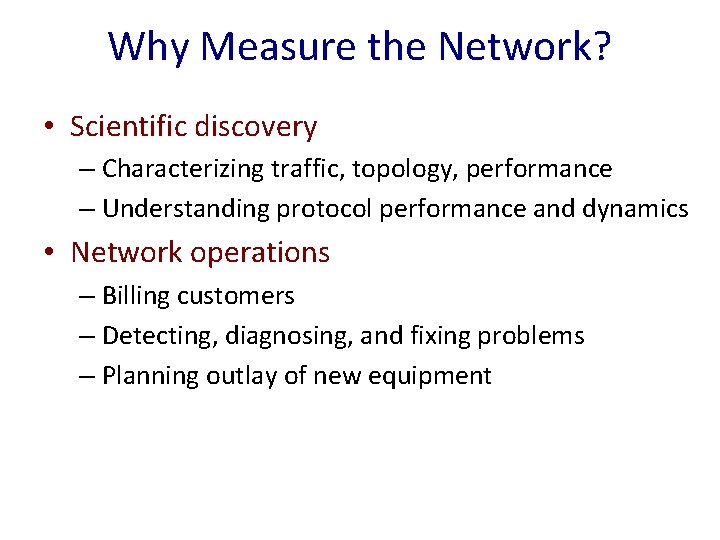
Why Measure the Network? • Scientific discovery – Characterizing traffic, topology, performance – Understanding protocol performance and dynamics • Network operations – Billing customers – Detecting, diagnosing, and fixing problems – Planning outlay of new equipment

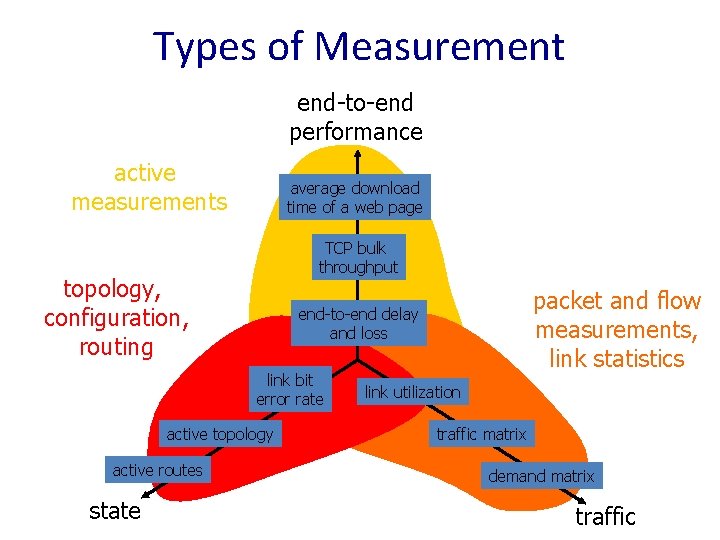
Types of Measurement end-to-end performance active measurements average download time of a web page TCP bulk throughput topology, configuration, routing link bit error rate active topology active routes state packet and flow measurements, link statistics end-to-end delay and loss link utilization traffic matrix demand matrix traffic

4 Traffic Measurement

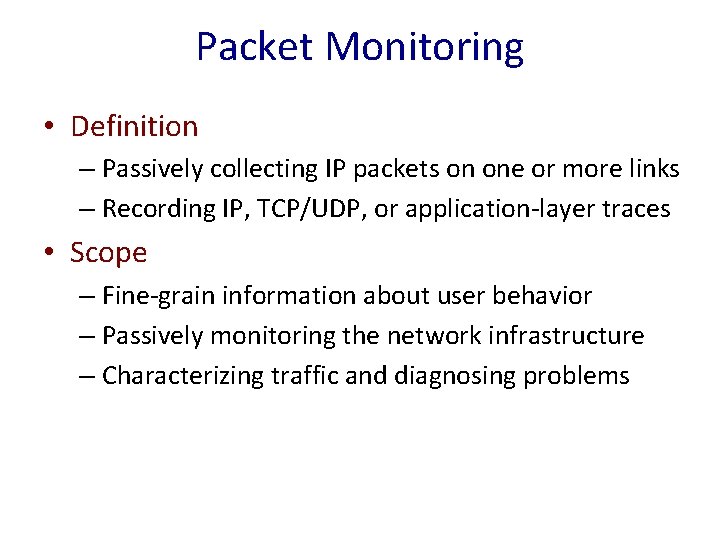
Packet Monitoring • Definition – Passively collecting IP packets on one or more links – Recording IP, TCP/UDP, or application-layer traces • Scope – Fine-grain information about user behavior – Passively monitoring the network infrastructure – Characterizing traffic and diagnosing problems

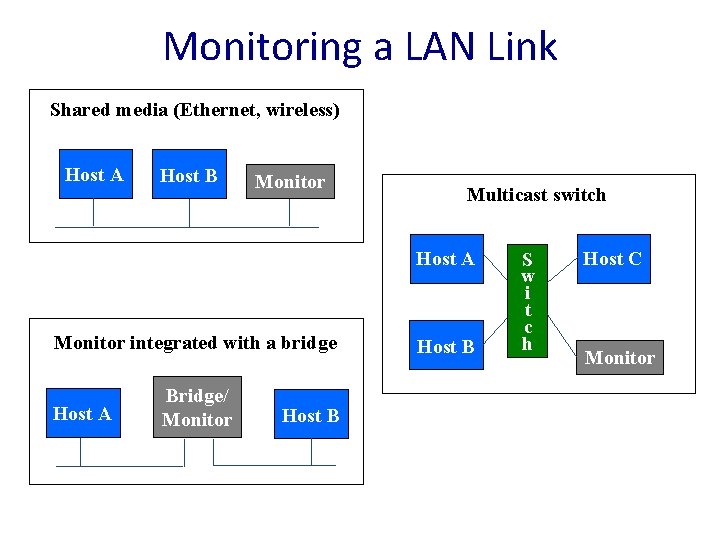
Monitoring a LAN Link Shared media (Ethernet, wireless) Host A Host B Monitor Multicast switch Host A Monitor integrated with a bridge Host A Bridge/ Monitor Host B S w i t c h Host C Monitor

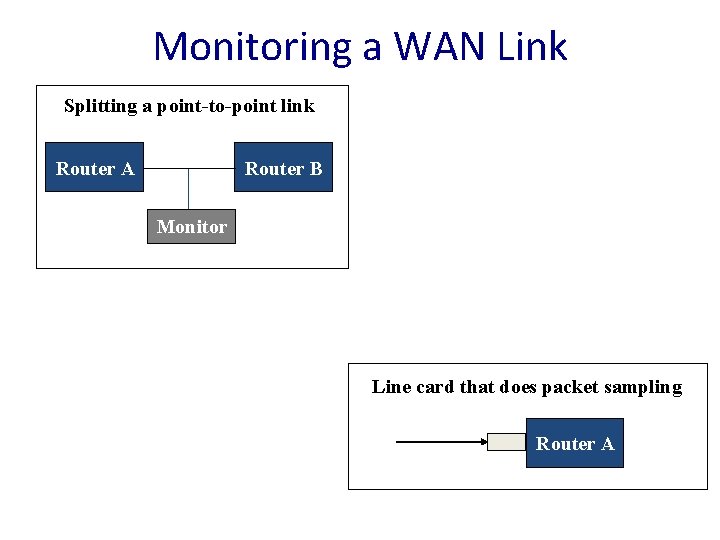
Monitoring a WAN Link Splitting a point-to-point link Router B Router A Monitor Line card that does packet sampling Router A

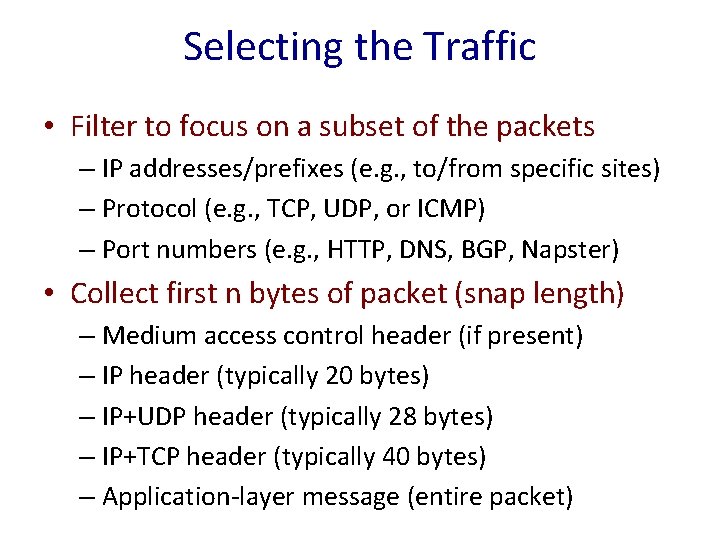
Selecting the Traffic • Filter to focus on a subset of the packets – IP addresses/prefixes (e. g. , to/from specific sites) – Protocol (e. g. , TCP, UDP, or ICMP) – Port numbers (e. g. , HTTP, DNS, BGP, Napster) • Collect first n bytes of packet (snap length) – Medium access control header (if present) – IP header (typically 20 bytes) – IP+UDP header (typically 28 bytes) – IP+TCP header (typically 40 bytes) – Application-layer message (entire packet)

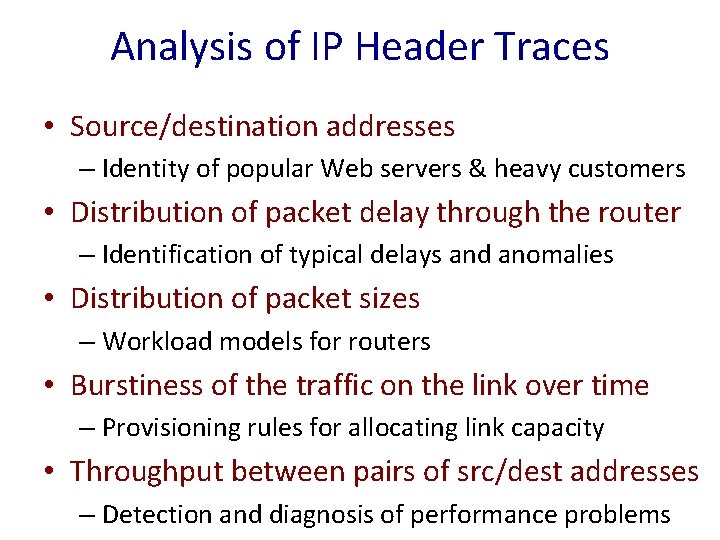
Analysis of IP Header Traces • Source/destination addresses – Identity of popular Web servers & heavy customers • Distribution of packet delay through the router – Identification of typical delays and anomalies • Distribution of packet sizes – Workload models for routers • Burstiness of the traffic on the link over time – Provisioning rules for allocating link capacity • Throughput between pairs of src/dest addresses – Detection and diagnosis of performance problems

TCP Header Analysis • Source and destination port numbers – Popular applications; parallel connections • Sequence/ACK numbers and packet timestamps – Out-of-order/lost packets; throughput and delay • Number of packets/bytes per connection – Web transfer sizes; frequency of bulk transfers • SYN flags from client machines – Unsuccessful requests; denial-of-service attacks • FIN/RST flags from client machines – Frequency of Web transfers aborted by clients

Packet Contents • Application-layer header – HTTP and RTSP request and response headers – FTP, NNTP, and SMTP commands and replies – DNS queries and responses; OSPF/BGP messages • Application-layer body – HTTP resources (or checksums of the contents) – User keystrokes in Telnet/Rlogin sessions

Application-Layer Analysis • URLs from HTTP request messages – Popular resources/sites; benefits of caching • Meta-data in HTTP request/response messages – Content type, cacheability, change frequency, etc. – Browsers, protocol versions, protocol features, etc. • Contents of DNS messages – Common queries, error frequency, query latency • Contents of Telnet/Rlogin sessions – Intrusion detection (break-ins, stepping stones)

Flow Measurement (e. g. , Net. Flow)

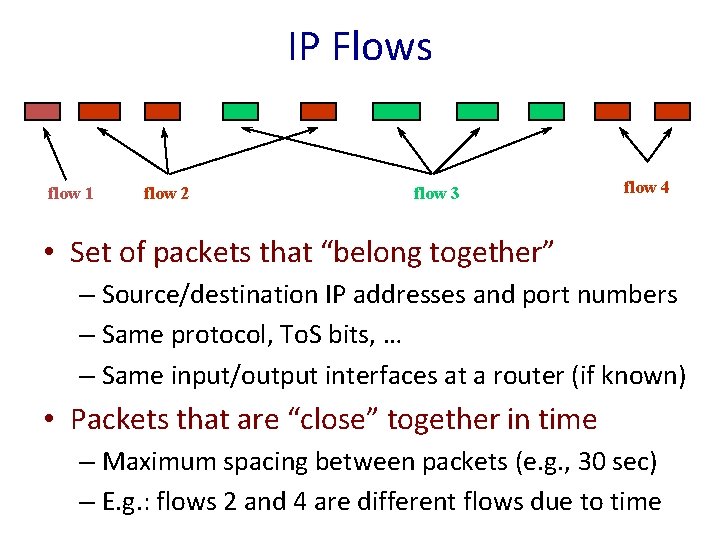
IP Flows flow 1 flow 2 flow 3 flow 4 • Set of packets that “belong together” – Source/destination IP addresses and port numbers – Same protocol, To. S bits, … – Same input/output interfaces at a router (if known) • Packets that are “close” together in time – Maximum spacing between packets (e. g. , 30 sec) – E. g. : flows 2 and 4 are different flows due to time

Flow Abstraction • Not exactly the same as a “session” – Sequence of related packets may be multiple flows – Related packets may not follow the same links – “Session” is hard to measure from inside network • Motivation for this abstraction – As close to a “session” as possible from inside – Router optimization forwarding/access-control – … might as well throw in a few counters

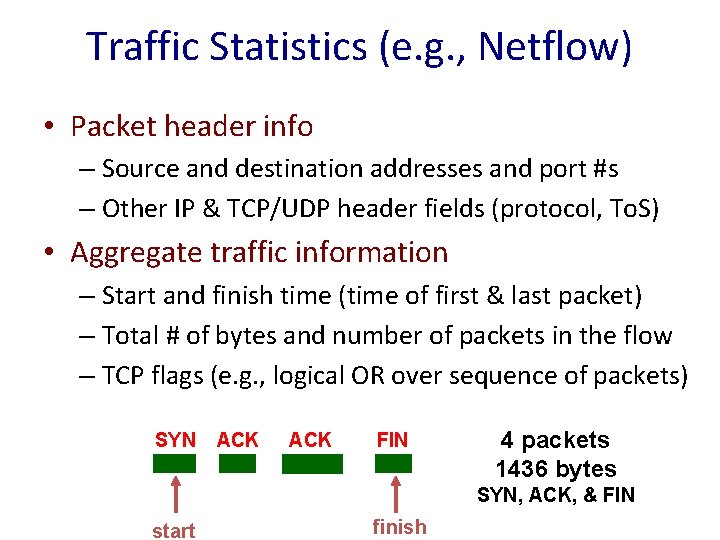
Traffic Statistics (e. g. , Netflow) • Packet header info – Source and destination addresses and port #s – Other IP & TCP/UDP header fields (protocol, To. S) • Aggregate traffic information – Start and finish time (time of first & last packet) – Total # of bytes and number of packets in the flow – TCP flags (e. g. , logical OR over sequence of packets) SYN ACK FIN 4 packets 1436 bytes SYN, ACK, & FIN start finish

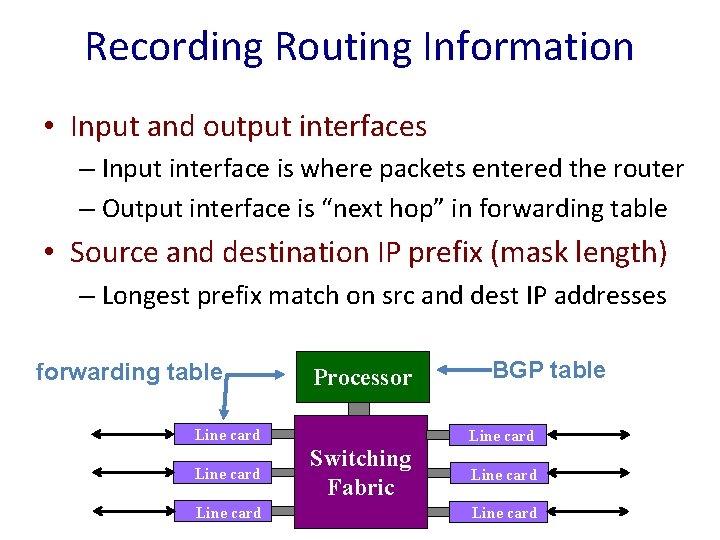
Recording Routing Information • Input and output interfaces – Input interface is where packets entered the router – Output interface is “next hop” in forwarding table • Source and destination IP prefix (mask length) – Longest prefix match on src and dest IP addresses forwarding table Processor Line card BGP table Line card Switching Fabric Line card

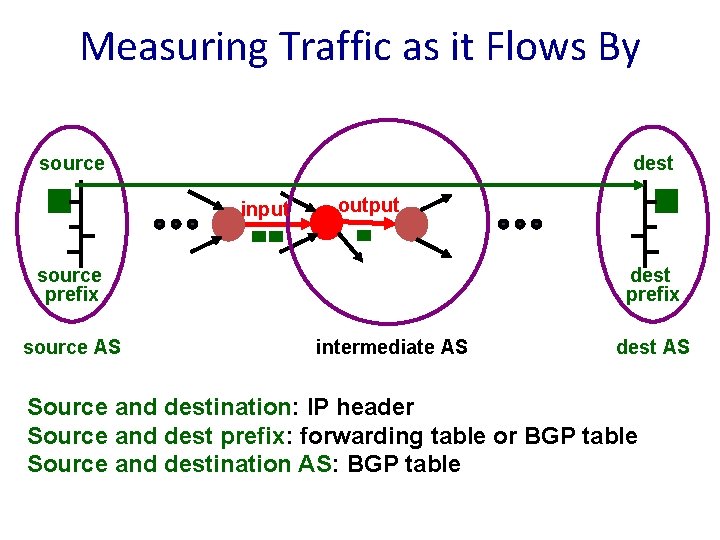
Measuring Traffic as it Flows By source dest input output source prefix source AS dest prefix intermediate AS dest AS Source and destination: IP header Source and dest prefix: forwarding table or BGP table Source and destination AS: BGP table

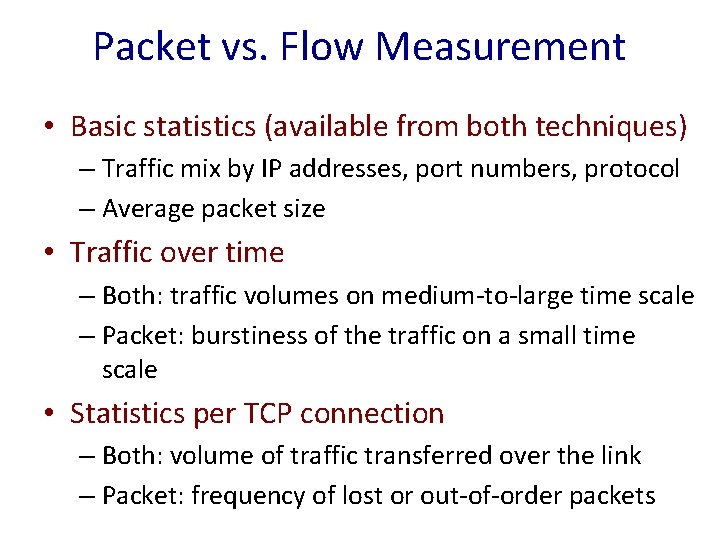
Packet vs. Flow Measurement • Basic statistics (available from both techniques) – Traffic mix by IP addresses, port numbers, protocol – Average packet size • Traffic over time – Both: traffic volumes on medium-to-large time scale – Packet: burstiness of the traffic on a small time scale • Statistics per TCP connection – Both: volume of traffic transferred over the link – Packet: frequency of lost or out-of-order packets

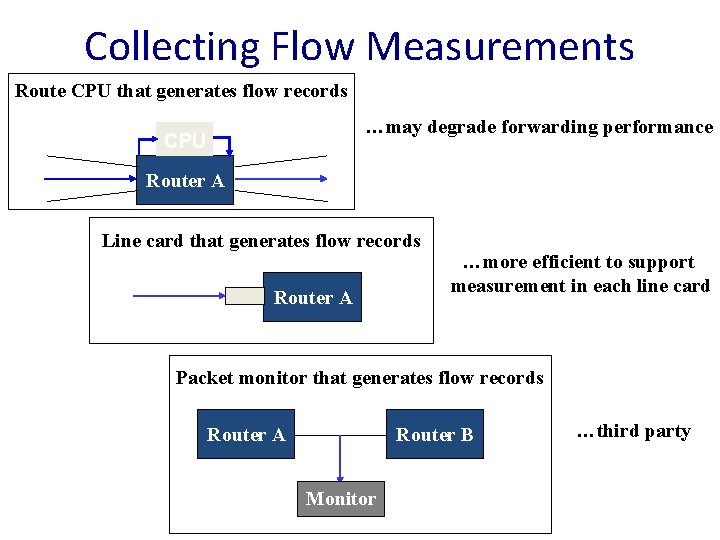
Collecting Flow Measurements Route CPU that generates flow records …may degrade forwarding performance CPU Router A Line card that generates flow records Router A …more efficient to support measurement in each line card Packet monitor that generates flow records Router A Router B Monitor …third party

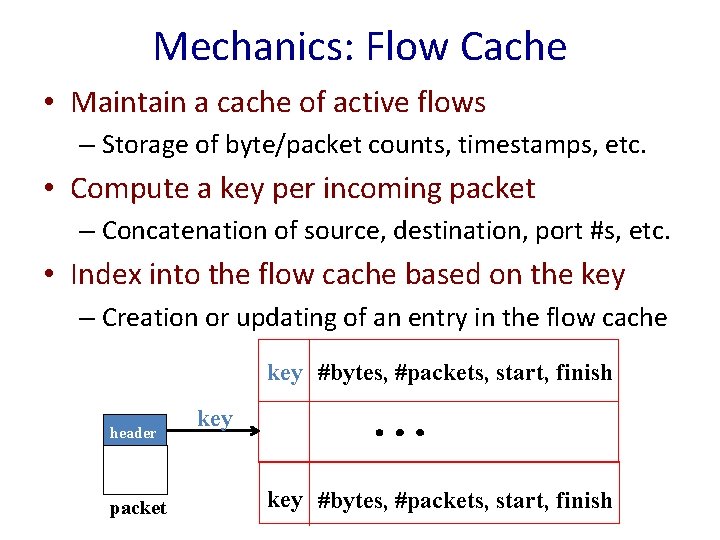
Mechanics: Flow Cache • Maintain a cache of active flows – Storage of byte/packet counts, timestamps, etc. • Compute a key per incoming packet – Concatenation of source, destination, port #s, etc. • Index into the flow cache based on the key – Creation or updating of an entry in the flow cache key #bytes, #packets, start, finish header packet key #bytes, #packets, start, finish

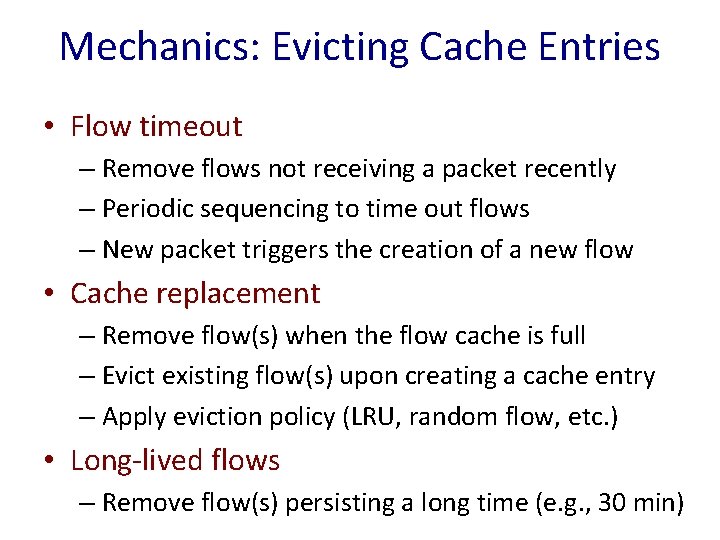
Mechanics: Evicting Cache Entries • Flow timeout – Remove flows not receiving a packet recently – Periodic sequencing to time out flows – New packet triggers the creation of a new flow • Cache replacement – Remove flow(s) when the flow cache is full – Evict existing flow(s) upon creating a cache entry – Apply eviction policy (LRU, random flow, etc. ) • Long-lived flows – Remove flow(s) persisting a long time (e. g. , 30 min)

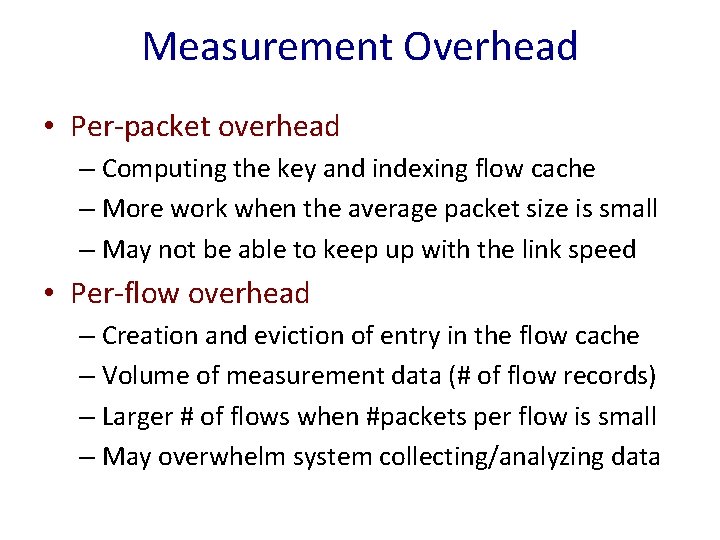
Measurement Overhead • Per-packet overhead – Computing the key and indexing flow cache – More work when the average packet size is small – May not be able to keep up with the link speed • Per-flow overhead – Creation and eviction of entry in the flow cache – Volume of measurement data (# of flow records) – Larger # of flows when #packets per flow is small – May overwhelm system collecting/analyzing data

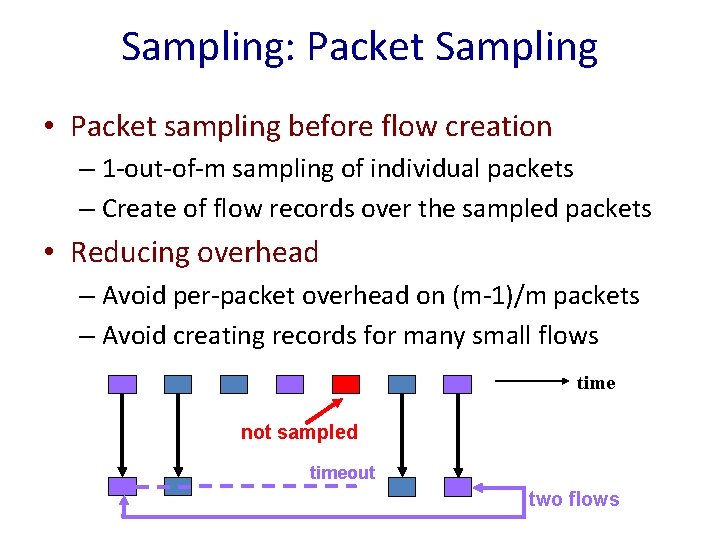
Sampling: Packet Sampling • Packet sampling before flow creation – 1 -out-of-m sampling of individual packets – Create of flow records over the sampled packets • Reducing overhead – Avoid per-packet overhead on (m-1)/m packets – Avoid creating records for many small flows time not sampled timeout two flows

25 BGP Monitoring

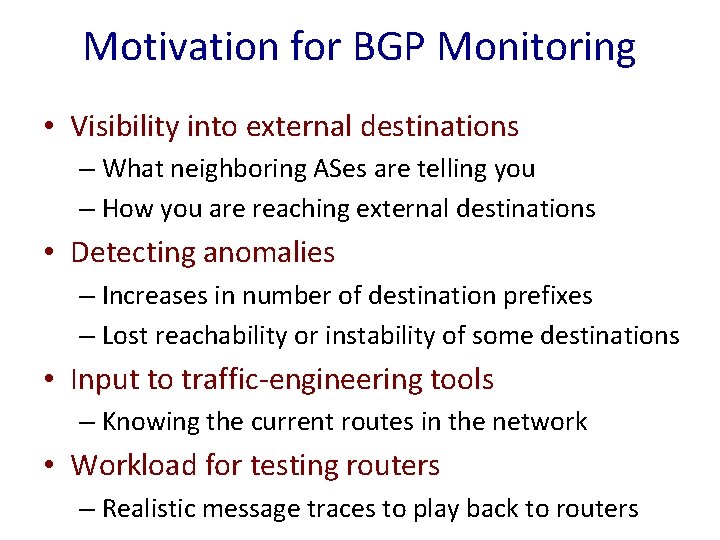
Motivation for BGP Monitoring • Visibility into external destinations – What neighboring ASes are telling you – How you are reaching external destinations • Detecting anomalies – Increases in number of destination prefixes – Lost reachability or instability of some destinations • Input to traffic-engineering tools – Knowing the current routes in the network • Workload for testing routers – Realistic message traces to play back to routers

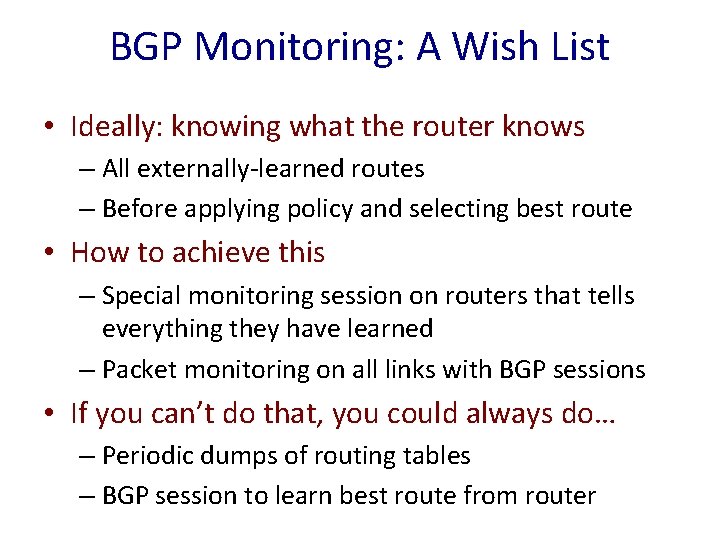
BGP Monitoring: A Wish List • Ideally: knowing what the router knows – All externally-learned routes – Before applying policy and selecting best route • How to achieve this – Special monitoring session on routers that tells everything they have learned – Packet monitoring on all links with BGP sessions • If you can’t do that, you could always do… – Periodic dumps of routing tables – BGP session to learn best route from router

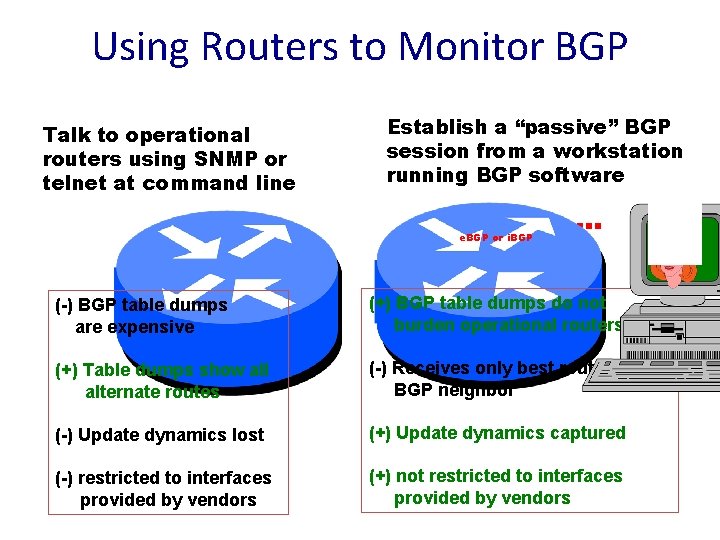
Using Routers to Monitor BGP Talk to operational routers using SNMP or telnet at command line Establish a “passive” BGP session from a workstation running BGP software e. BGP or i. BGP (-) BGP table dumps are expensive (+) BGP table dumps do not burden operational routers (+) Table dumps show all alternate routes (-) Receives only best routes from BGP neighbor (-) Update dynamics lost (+) Update dynamics captured (-) restricted to interfaces provided by vendors (+) not restricted to interfaces provided by vendors

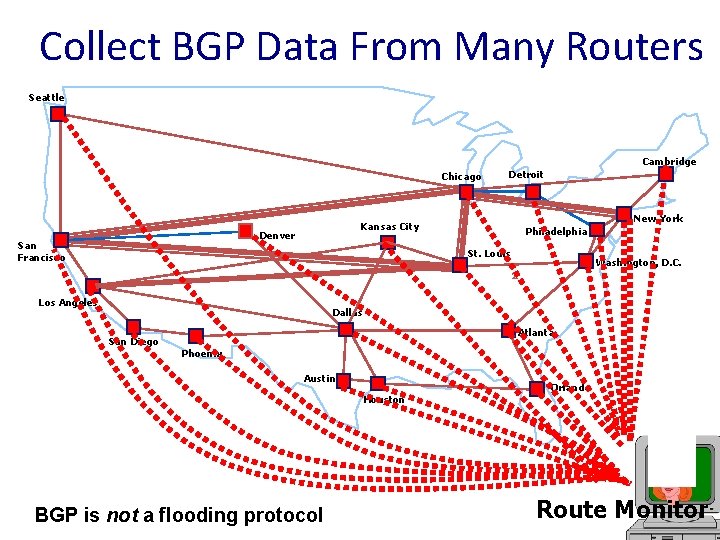
Collect BGP Data From Many Routers Seattle Cambridge Chicago New York Kansas City Denver San Francisco Detroit Philadelphia St. Louis Washington, D. C. 2 Los Angeles Dallas San Diego Atlanta Phoenix Austin Houston BGP is not a flooding protocol Orlando Route Monitor

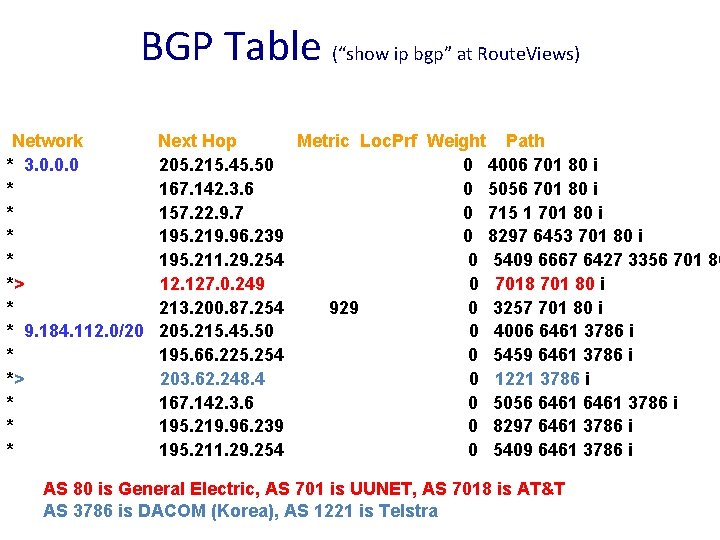
BGP Table (“show ip bgp” at Route. Views) Network * 3. 0. 0. 0 * * *> * * 9. 184. 112. 0/20 * *> * * * Next Hop Metric Loc. Prf Weight Path 205. 215. 45. 50 0 4006 701 80 i 167. 142. 3. 6 0 5056 701 80 i 157. 22. 9. 7 0 715 1 701 80 i 195. 219. 96. 239 0 8297 6453 701 80 i 195. 211. 29. 254 0 5409 6667 6427 3356 701 80 12. 127. 0. 249 0 7018 701 80 i 213. 200. 87. 254 929 0 3257 701 80 i 205. 215. 45. 50 0 4006 6461 3786 i 195. 66. 225. 254 0 5459 6461 3786 i 203. 62. 248. 4 0 1221 3786 i 167. 142. 3. 6 0 5056 6461 3786 i 195. 219. 96. 239 0 8297 6461 3786 i 195. 211. 29. 254 0 5409 6461 3786 i AS 80 is General Electric, AS 701 is UUNET, AS 7018 is AT&T AS 3786 is DACOM (Korea), AS 1221 is Telstra

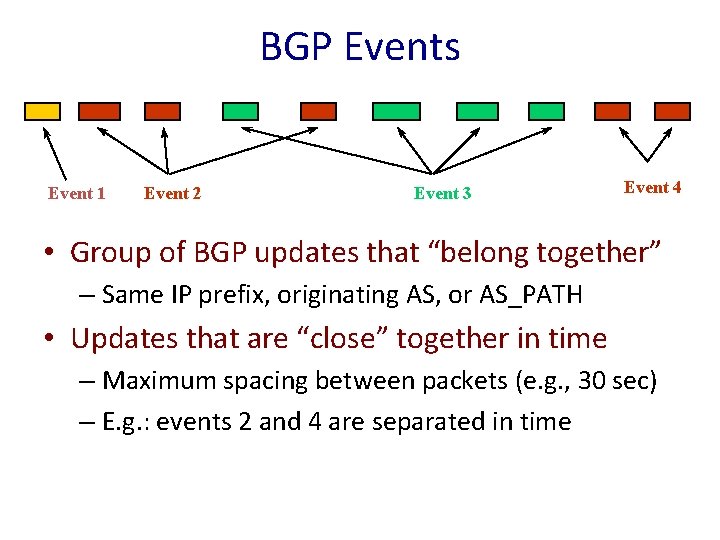
BGP Events Event 1 Event 2 Event 3 Event 4 • Group of BGP updates that “belong together” – Same IP prefix, originating AS, or AS_PATH • Updates that are “close” together in time – Maximum spacing between packets (e. g. , 30 sec) – E. g. : events 2 and 4 are separated in time

32 Assignment #4 Due Dean’s Date

33 Measurement Analysis • Two data sets – Netflow traffic measurements – BGP update messages and routing tables • Traffic analysis – Packet and flow sizes – Application break-down – Popularity of traffic sources • Routing analysis – Frequency of update messages by IP prefixes – Dynamics of BGP convergence

34 Measurement Analysis • • • Parsing the data Extracting relevant fields Combining data across measurement records Generating tables of results Plotting results (e. g. , Gnuplot, Excel, Matlab) Understanding the Internet better • Use any languages and tools – And work with a partner

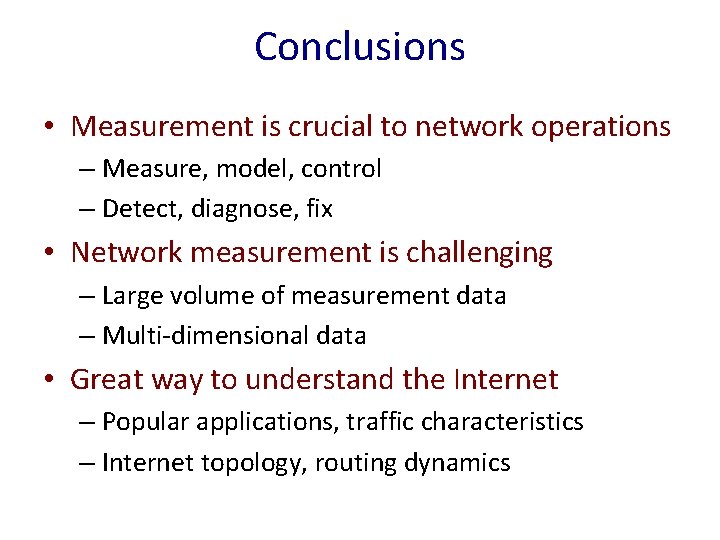
Conclusions • Measurement is crucial to network operations – Measure, model, control – Detect, diagnose, fix • Network measurement is challenging – Large volume of measurement data – Multi-dimensional data • Great way to understand the Internet – Popular applications, traffic characteristics – Internet topology, routing dynamics