Network Analysis of Interlocking Directorates ANLY 482 Practicum


")


- Slides: 12
Network Analysis of Interlocking Directorates ANLY 482 Practicum AY 2014/2015 Term 2 Supervised by Prof Kam Tin Seong Le Hoang Trinh Zheng TIanwei
Meeting Scope • What we have done • Outstanding issues • Overview of Company Distribution • Week 6 Scope • Questions
What we have done • Crawl Raw Data from One. Source • Company Dataset: 87664 entries • “List of Companies_Complete. xlsx” • Executive Dataset: 110065 entries • “List of Executives_Full. xlsx” • After processed • Company Dataset: 40824 entries • Because of duplicates in executive entries • “List of Companies_No. Duplicate. xlsx” • Executive Dataset: 110065 entries • “List of Executives_Removed. Dup. Titles. xlsx”
What we have done • Missing Data from Parent Company & Country • ~50% entries missing • Proposed Fix • Performed Internet search to find missing entries • If found, add it to data set • If no results, • Assume no parent company/country, enter company name/ Singapore respectively (Chosen) • Delete data with missing field
What we have done • Inconsistency in Executive Title and Executive names columns • Check and replace Executive titles & names to have more consistency • Followed the hierarchy levels as seen in http: //www. hierarchystructure. com/boarddirectors-corporate-hierarchy/
Company Distribution Overview • Distribution by parented company and ultimate parented company • Highest Distribution: Singapore, US, Japan
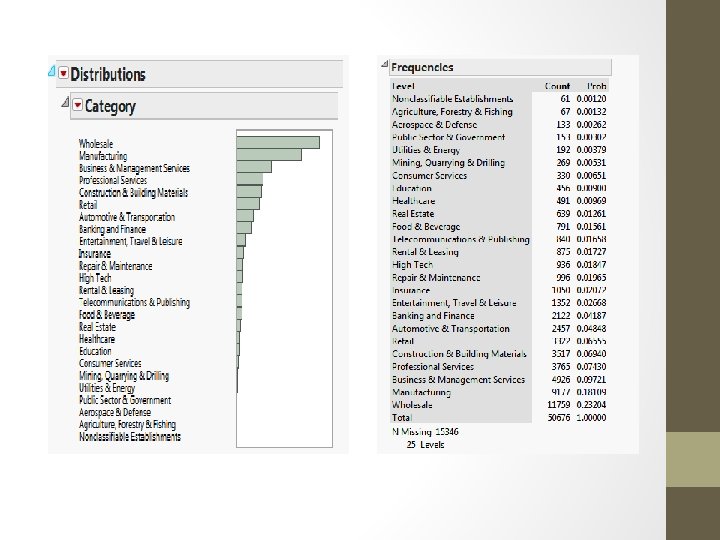
Company Distribution Overview • Distribution by industry • Highest Distribution: • Wholesale (23. 2%) • Manufacturing (18. 1%) • Business & Mgmt Services (9. 7%)
Company Distribution Overview • Distribution by ownership
Next week Scope • Distribution Analysis of Executives • Initial analysis of executives and companies connection between/within industry
Appendix • Raw Data • List of Companies_Complete. xlsx • List of Executives_Full. xlsx • Processed Data • List of Companies_No. Duplicate. xlsx • List of Executives_Removed. Dup. Titles. xlsx • List of Companies_No. Dup_Parent. Filled. xlsx
Appendix • Distribution Data. jmp • Distribution_Pcountry • Distribution analysis of company data according to parent and ultimate parent country • Distribution_Industry • Distribution analysis of company data according to industry classifications • Distribution_Ownership • Distribution analysis of company data according to ownership classifications *JMP based on “List of Companies_No. Dup_Parent. Filled. xlsx”