NET Debugging for the Production Environment Part 1
. NET Debugging for the Production Environment Part 1: Diagnosing application issues Brad Linscott Premier Field Engineering
Agenda Problem Resolution Framework Hangs Exceptions Performance Problems 2
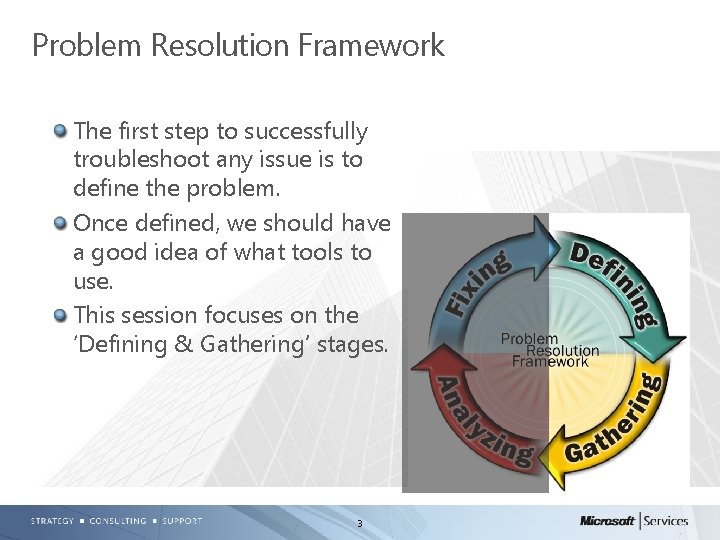
Problem Resolution Framework The first step to successfully troubleshoot any issue is to define the problem. Once defined, we should have a good idea of what tools to use. This session focuses on the ‘Defining & Gathering’ stages. 3
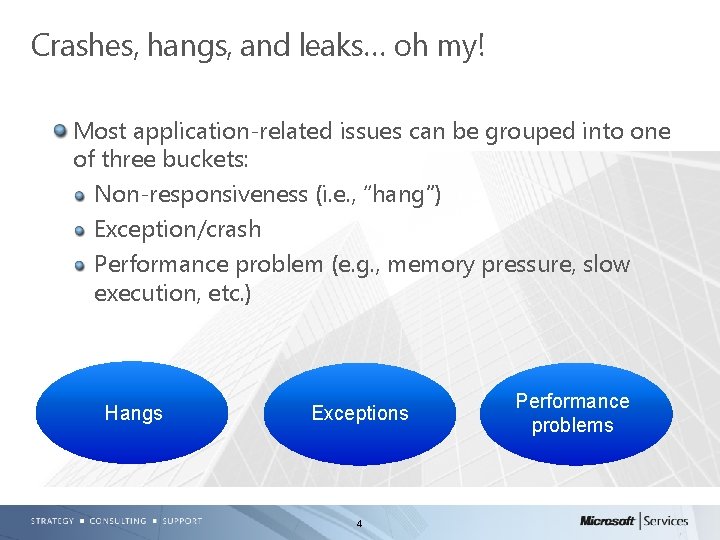
Crashes, hangs, and leaks… oh my! Most application-related issues can be grouped into one of three buckets: Non-responsiveness (i. e. , “hang”) Exception/crash Performance problem (e. g. , memory pressure, slow execution, etc. ) Hangs Exceptions 4 Performance problems
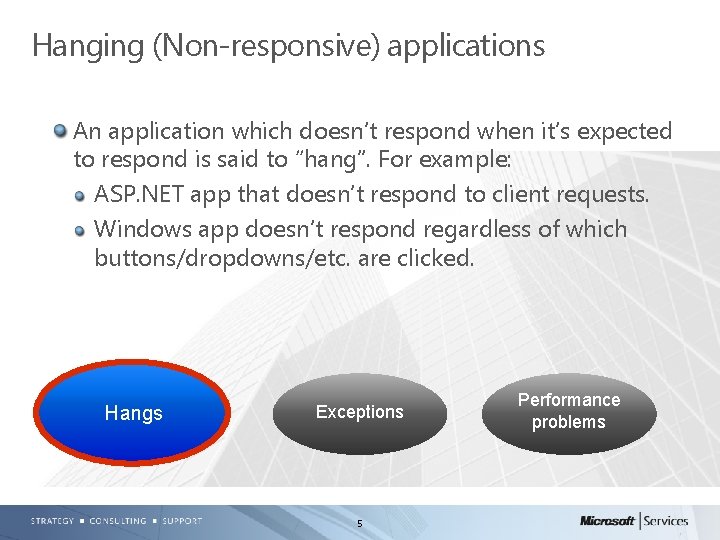
Hanging (Non-responsive) applications An application which doesn’t respond when it’s expected to respond is said to “hang”. For example: ASP. NET app that doesn’t respond to client requests. Windows app doesn’t respond regardless of which buttons/dropdowns/etc. are clicked. Hangs Exceptions 5 Performance problems
Troubleshooting tools for hanging apps Debug. Diag, ADPlus, other tools that dump For Debug. Diag, see http: //msdn. microsoft. com/enus/library/ff 420662. aspx#Usage and search for “creating manual user dumps” Key is to obtain dump *during* hang behavior – Can use perfmon/event log to validate dump was taken during the problem time Two dumps ~ 30 seconds apart may be needed – Rarely needed for low cpu, but can be invaluable for high cpu hangs 6
Troubleshooting tools for hanging apps, cont’d Perfmon – supporting data Cpu usage, status of requests (ASP. NET) Key is to ensure perfmon log encompasses time frame before & during problem symptoms Event logs, IIS logs, debugger (e. g. , Debug. Diag) log 7
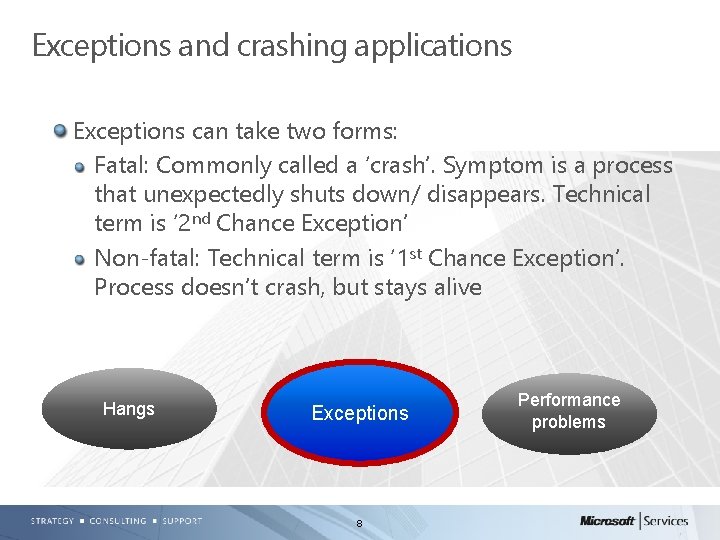
Exceptions and crashing applications Exceptions can take two forms: Fatal: Commonly called a ‘crash’. Symptom is a process that unexpectedly shuts down/ disappears. Technical term is ‘ 2 nd Chance Exception’ Non-fatal: Technical term is ‘ 1 st Chance Exception’. Process doesn’t crash, but stays alive Hangs Exceptions 8 Performance problems
Troubleshooting tools for exceptions Debug. Diag, ADPlus, other tools that dump For Debug. Diag, see http: //msdn. microsoft. com/enus/library/ff 420662. aspx#Usage to learn about Crash Rules For ADPlus usage, see http: //support. microsoft. com/kb/286350 or Windows Debuggers help file (debugger. chm) Key is to obtain dump *when* exception is thrown – 0. 1 seconds later is often too late – Default dump type from DD and AD+ provide stacks, heap info, and disassembly to help find root cause. 9
Troubleshooting tools for exceptions, cont’d Sometimes getting a dump file isn’t possible/acceptable If getting a dump is too intrusive, getting just call stacks may be sufficient – Managed Stack Explorer is an example (. NET stacks only, not recommended for production) For ASP. NET, Health Monitoring may be an option. http: //msdn. microsoft. com/en-us/library/bb 398933(v=vs. 90). aspx 10
Troubleshooting tools for exceptions, cont’d Sometimes a dump file isn’t the best data. We may need to learn about process execution prior to the exception – Live debug – Intrusive, not ideal for production – Must have a somewhat-reliable repro Event logs Application logs 11
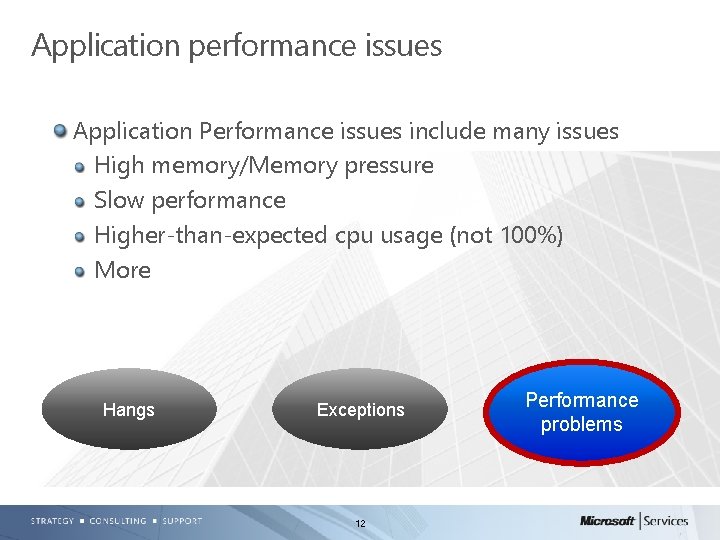
Application performance issues Application Performance issues include many issues High memory/Memory pressure Slow performance Higher-than-expected cpu usage (not 100%) More Hangs Exceptions 12 Performance problems
Troubleshooting application performance High memory Very common. NET-related issue When combined with other problem symptoms (e. g. , unexpected behavior, app instability, higher-thanexpected cpu, etc. ), resolve memory pressure first Use debugger (e. g. , DD) for full user mode dump – Key is to dump *during* problem symptom Use perfmon to validate, along with a dump – Perfmon not mandatory, but can streamline the troubleshooting process 13
Troubleshooting application perf, cont’d High memory For native memory leaks, Leak. Track in Debug. Diag is a popular troubleshooting tool. http: //msdn. microsoft. com/enus/library/ff 420662. aspx#Usage For managed (e. g. , . NET) memory pressure, one or more dumps is usually sufficient – If perfmon shows memory growing over time, then multiple dumps over time can aide troubleshooting – Using Leak. Track for managed memory issues isn’t helpful 14
Troubleshooting application perf, cont’d Slow performance Profiler – VS Profiler (only for VS-compiled apps) Tracing Multiple dumps over time IIS Logs (IIS apps only) Perfmon – ASP. Net monitoring: http: //msdn. microsoft. com/enus/library/ms 972959. aspx 15
Troubleshooting application perf, cont’d Higher than expected cpu usage Different from a high/100% cpu hang Profiler – VS Profiler (VS-compiled only) Debug. Diag 16
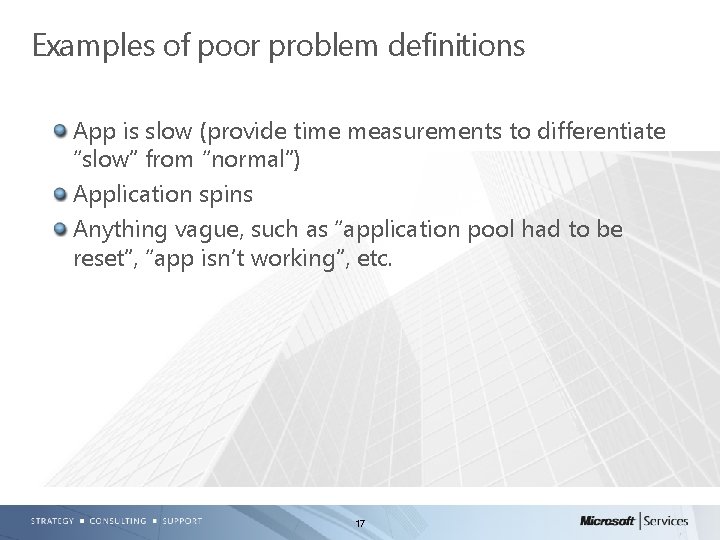
Examples of poor problem definitions App is slow (provide time measurements to differentiate “slow” from “normal”) Application spins Anything vague, such as “application pool had to be reset”, “app isn’t working”, etc. 17
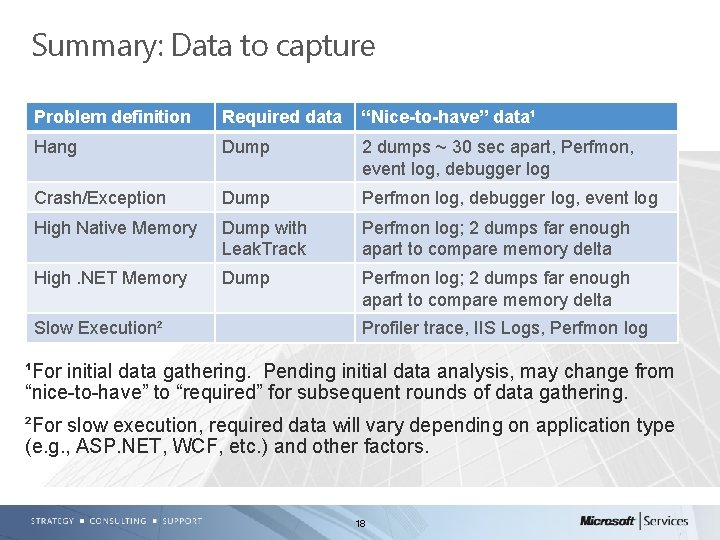
Summary: Data to capture Problem definition Required data “Nice-to-have” data¹ Hang Dump 2 dumps ~ 30 sec apart, Perfmon, event log, debugger log Crash/Exception Dump Perfmon log, debugger log, event log High Native Memory Dump with Leak. Track Perfmon log; 2 dumps far enough apart to compare memory delta High. NET Memory Dump Perfmon log; 2 dumps far enough apart to compare memory delta Slow Execution² Profiler trace, IIS Logs, Perfmon log ¹For initial data gathering. Pending initial data analysis, may change from “nice-to-have” to “required” for subsequent rounds of data gathering. ²For slow execution, required data will vary depending on application type (e. g. , ASP. NET, WCF, etc. ) and other factors. 18
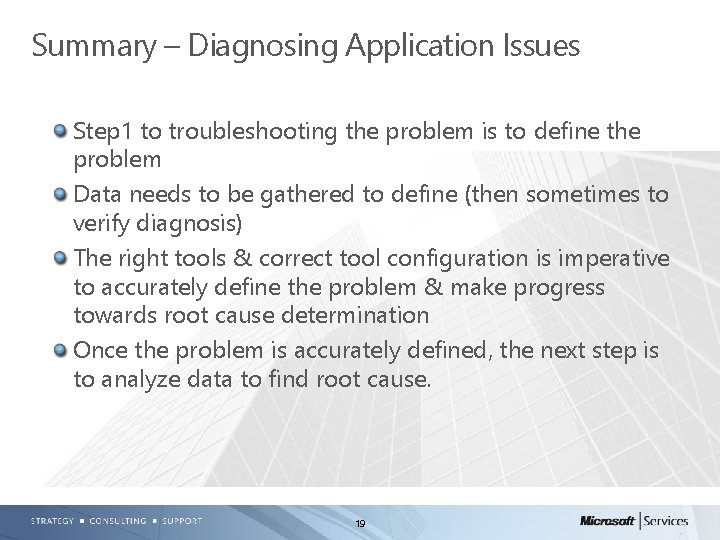
Summary – Diagnosing Application Issues Step 1 to troubleshooting the problem is to define the problem Data needs to be gathered to define (then sometimes to verify diagnosis) The right tools & correct tool configuration is imperative to accurately define the problem & make progress towards root cause determination Once the problem is accurately defined, the next step is to analyze data to find root cause. 19
- Slides: 19